Variability Analysis of Prime Cost Sums
Ime Johnson Ikpo1
Abstract: This paper investigated the variability levels of prime cost sums in building projects in order to establish the reliability of such estimates in bills of quantities. It involved a purposive sampling of forty-six executed projects in South-western Nigeria from which data on estimated and final prime cost sums as well as estimated and final contract sums were procured. Ratios interrelating the four variables were generated and their mean values determined. The mean prime cost sum overrun was found to be 41% of the estimated sums. However, a negative relationship between the prime cost sums and the final contract sums was established. Based on observed variations, models were developed to predict any of the ratios in general, and specifically, the practical prime cost range in order to effectively control overall project costs.
Keywords: prime cost sums, contract sums, cost ratios, variability.
Introduction
In building contracts, there are sums often provided for in the Bills of Quantities that are not of exact measurement and yet do take significant percentages of the contract sums. These include “Provisional Sums” meant for unforeseen work details, “Conti-ngency Sums” for items that might have been overlooked and “Prime Cost (PC) Sums” for aspects not normally undertaken by the contractor but rather by specialists. In South-western Nigeria it has been observed by that, of the three special sums, PC sums often account for the heaviest percentage of the contract sum [1]. Incidentally, parties not privy to the contract prepare these prime cost sums.
The tradition in the construction industry is that the expenditure profile for each project be monitored to the final accounts point. Interestingly, final accounts do not often tally with these initial sets of sums. If the estimated sum is larger than what is stated in the final account, then as a general rule, the balance is expected to get back to the client. However, experience and pilot surveys show that the reverse is usually the case, i.e. the actual amounts spent on such items always exceed the estimated costs. It gives great concern to note that the estimates of items of such magnitude often indicate very significant error levels to the disadvantage of the client. In estimating practice, surveyors most times adopt well-known percentages to determine the approximate cost of building elements. The degree of accuracy depends on the reliability of the sampling technique. Current works portray this as a highly controversial issue [2].
1 Reader, Department of Building, Obafemi Awolowo University,
Ile-Ife, Nigeria
E-mail: [email protected]
Note: Discussion is expected before June, 1st 2008, and will be published in the “Civil Engineering Dimension” volume 10, number 2, September 2008.
Received 30 May 2007; revised 11 February 2008; accepted 22 February 2008.
This may equally be extended to prime cost esti-mating – a feature which is of prime concern to participants in the construction industry in general and to clients in particular.
This study was therefore aimed at assessing the characteristic variability of PC estimates in building construction works. The specific objectives pursuant to this were twofold. The first was to examine the relationship between estimated and final PC sums and the second was to determine the error level on the final accounts due to variations. This would allow more accurate estimates to be made at the tender stage.
Prime Cost Sums in Building Contracts
Standard conditions of contract recognize the practice of subcontracting specialist works to nominated subcontractors and allow for their estimates as prime cost items. The Aqua Group [3] explained this within the context of the Joints Contract Tribunal (JCT) document. Examples of such coverage include piling, structural steelwork, fixing of aluminium doors and windows, specialized floor finishing (terrazzo, mosaic, etc), plumbing and metal works. Others include electrical installations, acoustic suspended ceilings, roofing and general engineering installations [4]. The concept is not particularly limited to construction works but also to materials to be delivered by nominated suppliers.
to carry out such work, indicating what the items of work are, so that they may be set in the appendix to the conditions. However. the architect must be willing to accept a tender from the contractor for such work; if not the contractor will not be permitted to do the work himself.
If the tender is competitive, then the contractor is entitled to the profit additions just as if a subcontractor were to do the work. Otherwise, it is deemed to be included in the contractor’s price and the contractor should be informed of this at the tender invitation stage [5]. A contractor may not therefore arrogate upon himself such works because any sum included in the contract sum for general attendance would be deducted [6]. A contractor may execute the work himself where a nominated subcontractor defaults before completion of his subcontract to avoid delay that would be occasioned by the need for the architect to re-nominate.
Initial and Final Prime Costs Differential
Past works, particularly those of Aladegbaiye [1] and Brownlee [7], suggest that the final cost profiles of virtually every building project exceed the estimated values. Prime cost is no exception to this claim. The difference between the actual amounts expended on PC items as shown in final accounts, and the initial estimates may be attributed to a number of factors. The major source of variation in PC estimates is a change in the design emanating from either a change in the brief or a change in opinion by the architect, both of which necessitate variation orders.
Variation orders by architects attract strict com-pliance. Mistakes due to lack of adequate and appropriate construction knowledge may lead to variation orders, but it is important to state that this is not usually according to an architect’s whims [8]. It has been shown that clients are not always certain of their requirements at the inception of projects [5]. Variation orders could therefore be borne out of circumstantial considerations rooted in the fact that many private and public clients do not allow sufficient time for project planning [9]. More so, there could be better innovations in the market between the tender period and the project commencement date that could necessitate such changes [10], particularly when the cost, juxtaposed with the serviceability, justifies such [2]. The architect may also wish to avoid the use of materials in which the delivery time may affect the project duration due to some anticipated events.
Disparities have also been traced to the quantity surveyor’s estimating inaccuracies. This may be as a result of not being familiar with the design details [11] or inaccurate specifications, detailing, and general working drawings, i.e. the entire contract documents [12] Perhaps the only factor out of the
control of the parties but which affects cost diffe-rentials significantly is that of prevailing economic or market conditions. Price fluctuations seem a common phenomenon particularly in underdeveloped econo-mies and politically unstable countries. In Nigeria, it was observed that fluctuations stem from direct government policies as well as general inflation [13]. Studies by Leivers [14] and Al-khahl and Al-Ghafly [15] also showed that government policies and legislations could affect project costs. A variation in the PC sums initially provided, which resulted in cost overruns, was found to emanate from delays [16]. Most delays are due to the introduction of a number of changes in a project [17] and are usually attributed to the architects’, engineers’, or contractors’ short-comings [18]. Other construction features identified as prime sources of delays include materials procu-rement, cash flow, manpower and plant scheduling, contractual relationships, and inadequate program-ming techniques [19].
From the foregoing, it is apparent that items covered by PC sums are so vast that there hardly would be a building contract without PC estimates. These esti-mates, which are prepared by parties not privy to the contract, are fraught with such errors or inaccuracies that clients detest, particularly as the final accounts often reflect a sum higher than the estimated. Conceptually, if the observed PCs, contract sums, and final accounts are examined, their statistical properties may serve as a basis for the prediction of PC ranges. This work therefore made use of the observed differences between the estimated PCs and the final sums to measure of the coefficient of variations for various levels of contract sums.
Analysis of Prime Costs and Contract Sums for Variation Coefficients
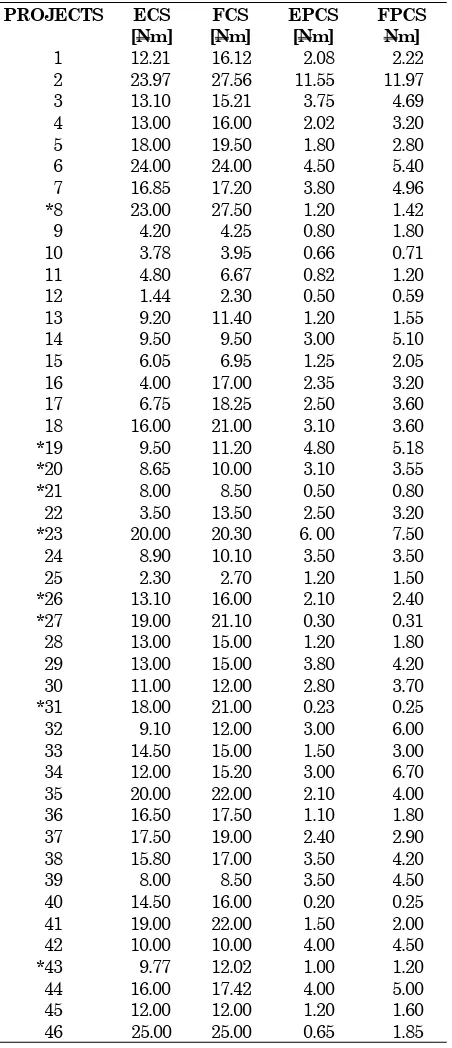
Data pertaining to the estimated and final PC sums, contract sums, and duration of each project were obtained from a purposive sample of projects executed in South-western Nigeria. All the projects examined involved key professionals such as archi-tects, engineers, contractors and quantity surveyors in which reliable estimates were expected. In addition, the forty-six projects selected were those that were completed within schedule. This eliminated the incidence of variations arising from time overruns, which could modify the characteristic behaviour of estimated costs. Table 1 shows the primary data sorted in ascending order of the estimated contract sums. The asterisks indicate the projects in which the general contractor executed works covered by PC sums.
sums and Contract sums were obtained by expressing the final sums as ratios of the estimated sums respectively. The final prime cost sums exceeded the estimated prime cost sums in all the forty-six projects by varying margins. In the case of the final contract sum estimates, 11% showed no cost overrun.
Table 1. Field Data on Prime Cost and Contract Sums
EPCS = ESTIMATED PRIME COST SUM; FPCS = FINAL PRIME COST SUM
ECS = ESTIMATED CONTRACT SUM; FCS = FINAL CONTRACT SUM. [$1 = N130.00]
Table 2. Derived Prime Cost and Contract Sum Ratios
to play useful roles in short-term and long term contract planning, reliable models were therefore derived which could aid to curtail cost overruns. Table 2 showed a mean PC overrun figure of 41% with a corresponding high standard deviation (0.37) as against a mean 14% overrun in the case of the contract sums. A variability coefficient of 1.41was therefore ascribed to estimated PC sums. A 41% error level would not be acceptable to the clientele especially if it was known that the mean variability coefficient could be far less. To buttress this, the mean PC overrun for the nine-asterisked projects that the contractor executed the works covered by PC sums was 1.19.
From the mean figures in Table 2,
FPCS = 1.41EPCS (1) FPCS = 0.24FCS (2) Therefore evaluating equations (1) and (2) simulta-neously,
EPCS = 0.17FCS (3)
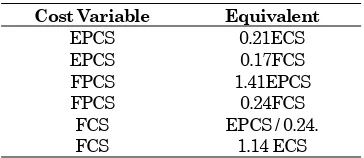
These and a range of other possible relationships between prime cost sums and contract sums (estimated and final) that could be drawn from Table 2 are summarised in Table 3.
Table 3. Derived Prime cost and Final Contract Sum Relationships
Cost Variable Equivalent
EPCS 0.21ECS EPCS 0.17FCS FPCS 1.41EPCS FPCS 0.24FCS
FCS EPCS / 0.24.
FCS 1.14 ECS
EPCS may readily be ascertained for planning purposes at the pre-tender stages while FPCS is useful for cost control at the pre-contract and contract stages. It is therefore possible to use these ratios to obtain an overview of a project at any point prior to the practical completion date.
Estimated final cost figures are equally essential at the pre-tender and pre-contract stages and an accurate prediction of the final contract sun (FCS) is an invaluable planning and controlling tool. In all these computations, the estimated PC sums and final PC sums indicated considerable variability, the extent of which, as contained in Table 3, could be stated as:
FPCS = 1.41EPCS
Prime Cost Differential Pattern
Aladegbaiye [1] observed that cost variation characteristics could depend on the magnitude of contract sums. To test the behaviour of the same
ratios as the contract sum increased, the sample was grouped into three million Naira contract cost brackets, and the mean figures for the variables A, B, C, D and E in Table 2 recomputed for each group and shown in Table 4. The chart showing the mean values of the five ratios over the grouped contract sums indicated no direct relationships not even for B (Figure 1). In computing the correlation coefficients for each of these variables against the contract sum groups at 95% significance level, it was found that the relationship between the estimated and the final prime cost sum (B), was surprisingly very low (0.41) even when the last contract sum bracket (N24m – N27m) with single data entry was discountenanced.
Arrangement of each group of the five ratio bars from left for each cost bracket:
A = FCS / ECS; B = FPCS / EPCS; C = FPCS / FCS; D = EPCS / ECS; and E = EPCS / FCS
Fig. 1. Graphical Relationship Between Ratios and Group-ed Contract Sums
This ratio (B), by definition, was expected to establish the variability trend. The other ratios showed very strong correlation with the contract sum brackets above the critical value of 0.666 for 95% significance level. At 99% level of significance, the critical value
(r0.005) was 0.798. The seemingly strong relationship
of the other ratios could therefore be dismissed as mere chance occurrences, with the exception of the ratio FPCS/FCS in which the correlation coefficient was –0.83. The relevant pair with the strongest relationship from this table (the ratio of the final prime cost sums to those of the final contract sums (FPCS/FCS)) was not considered appropriate for describing the variability of prime cost sums, since other factors apart from the prime cost could vary final contract sums.
Conclusion and Recommendation
traditional estimating procedure. This situation cer-tainly would impair approximate estimating particularly for tendering purposes.
Variability could therefore only be measured in relation to the observed differential between the estimated sums prior to construction and the final sums at the practical completion date. The mean of the differences between the estimated and the final prime cost sums, computed as 0.41, was observed to be on the high side. The relationships generated were considered appropriate for the approximate estimating of prime cost sums and also for the control of such sums during the contract period. It was also found that the level of variation of prime costs in projects where the general contractor executed those items of work was relatively lower. It could therefore be inferred that as far as practicable, main contractors should be encouraged to execute items of work which would otherwise have been subcontrac-ted, if it is apparent that they posses the wherewithal to do so.
The computations depended on data from just forty-six contractors. It is recommended that more extensive studies involving very large samples be undertaken so as to derive more reliable models to assist practising surveyors.
References
1. Aladegbaiye O.B., A study of the variability of prime cost sums in the bill of quantities for building contracts in south-western Nigeria,
Unpublished M.Sc. thesis, dept. of Quantity Surveying, O.A.U. Ile-Ife, 2002
2. Hackett M., Robinson I., and Statham G., AQUA Group Guide to Procurement, Tendering, and Contract Administration Blackwell Publishing Ltd., 2006.
3. The Aqua Group, Contact Administration for Architects and Surveyors 5th Ed. Granada, 1980, p. 121.
4. Ayeni J.O. “Principles of tendering and esti-mating” The Builder’s Magazine, Lagos, 1997.
5. Seeley I.H., Quantity Surveying Practice. London, Macmillan Publishers Ltd., 1984.
6. Ramus J. and Birchall S., Contract Practice for Surveyors. Oxford, Laxton’s, 1996.
7. Brownlee J.K.., Survey of cost performance…., www.scs.ie/submissions/GDLA, 2005
8. Waterhouse R., Implementing project manage-ment: Is the client the problem?, Journal of the Royal Institute of Chartered Surveyors, (CSM).
Vol.4, Iss.7, 1995, pp. 76-77.
9. Osemenam C.A., Why construction projects are abandoned, and the use of direct labour in the construction industry, Paper presented at the inauguration of the Lagos Chapter of the NIQS, 1984.
10. Goodacre P.E., On a critical look at final accounts.
The Quantity Surveyor. Lagos, 30 (6) May/June, 1984.
11. Adetola F.O., Auditing of quantity surveyors bills of quantities, The Quantity Surveyor, V. 29, Oct/Dec, 1999, pp. 14-18.
12. Giwa S.L., Differences between initial and final contract sums of construction projects in Nigeria,
Paper presented at NIQS seminar, Lagos, 1988.
13. Abiola O. and Oladele R., Management impli-cations of trends in the construction cost in Nigeria from 1989 to 1999, The Quantity Surve-yor, V30, Jan/Mar, 2000, pp. 35-40.
14. Leviers M., Unpublished notes from interviews carried out at Leviers Associates office, Notting-ham, May 16, 1995.
15. Al-Khalil M.I. and Al-Ghafly M.A., Important causes of delay in public utility projects in Saudi Arabia, Construction Management and Econo-mics, V17, 1999, pp. 647-655.
16. Odeyinka H. A. and Yusif A., The causes and effects of construction delays on completion cost of housing projects in Nigeria, Journal of Financial Management of Property and Construction. V 2 (3), 1997, pp. 31-44.
17. Bramble B.B. and Callahan M.T., Construction Delay Claims Wiley law publications, New York, 1992.
18. Kangari R. and Sadri S., Delays in the cons-truction industry. Building Economics and Construction Management. V 6, 263, 1990.
19. Assaf S.A., Al-Khalil M.,and Al-Hazimi M.. Causes of delay in large building construction projects, Journal of Management in Engineering