Perf
Department o
2
Depart
epartment of
mail: chusnu @yahoo.com
hisaaki@
* Author to w
oceedings of p://dx.doi.org SN 2227-302
ce of Qu
S
udi. I. Setia I Wayan Bu
of Civil and E
tment of Glo
f Mechanical
4
whom corres
f the Asia-Pa g/10.7125/APA 26
uasi Rea
Systems
obal Agricult Bunk To
l and Biosys Kampu Bogo
4
Udayana U Denpa
arch Institute 7-4 Motoyam Ky
o.com, budin ahoo.com, l_ p, jkubota@c
spondence sh
acific Advan AN.37.2
al-Time
s in Indo
aru Mizoguc aaki Kato5 a
ntal Engineer us IPB Darm or, Indonesia
tural Science kyo-Ku 1-1-okyo, Japan
tem Enginee us IPB Darm
or, Indonesia
University, In asar, Indones
e for Human ma, Kamigam
yoto, Japan
[email protected] _tono@yaho chikyu.ac.jp
hould be add
nced Network
Paddy F
onesia
chi2, Satyan and Jumpei
ring, Bogor A maga
a
es, The Univ -1
ering, Bogor maga
a
ndonesia sia
nity and Natu mo, Kita-ku
c.id, amizo@ oo.com, wba_
dressed; Tel
k 2014 v. 37
Field M
nto. K. Sapt i Kubota5, T
Agricultural
versity of To
r Agricultura
ure
@mail.ecc.u-t _sosek_unud ga.a.u-tokyo
l.: +62-251-8
7, p. 10-19.
onitorin
tomo1, Sutoy Tetsu Ito2
l University
okyo
al University
tokyo.ac.jp,
[email protected] o.ac.jp
862-7225
ng
yo1,
y
Abstract:
Since 2010 paddy field monitoring systems have been installed in ten locations in Indonesia. Each system performs quasi real-time monitoring using a FieldRouter equipped with an in situ camera and connected to meteorological and soil data loggers. All parameters are measured and monitored at 30‐min intervals. Data and field images are daily transmitted to a remote server through Internet connection. During experiments, field monitoring systems showed good performance in monitoring and transmitting field data. Quasi real-time monitoring is more power-saving and Internet-cost-effective than real-time monitoring. However, its stability depends on the field solar power supply and Internet connection. If there are any problems with the Internet connection, power supply, or sensors, the field image and the data are lost. For minimizing problems in fields, it is best to involve local residents in maintaining the systems. We plan to develop an advanced data management system for analyzing the data with specific purposes bearing on climate change in the future works.
Keywords: monitoring system, paddy fields, system of rice intensification, FieldRouter, quasi real-time.
1. Introduction
Recently, scarcities of water resources and competition for their use have made water saving the main challenge to the sustainability of rice farming. Therefore, water saving technologies have become a priority in rice research [1]. In addition, the prospect of climate change has been affecting agricultural activities, particularly in paddy fields [2]. Adaptation and mitigation strategies in the face of climate change are a principal focus of rice research. Environmental data sets such as meteorological and soil data are needed to develop suitable strategies for addressing this issue.
Improvements in the technology for collecting such data from paddy fields in Indonesia via field monitoring has commenced since 2008 in the form of real-time monitoring [3]. However, the study was limited to a short-term experiment and exposed problems with the stability of real-time field monitoring. Its stability depends on the local electrical power supply and an Internet connection. Real-time monitoring was not suitable for Indonesia because paddy fields are commonly in open areas far from farmers' houses, rendering it difficult to find electrical sources to power field monitoring systems.
evaluate the performance of paddy field monitoring systems installed in several areas in Indonesia for quasi real-time monitoring.
2. Methods
2.1 Fields monitored
Field monitoring systems were installed in ten different paddy fields in Indonesia (Table 1). We installed the field monitoring systems gradually, starting in October 2010. The first installation was at Nusantara Organics Systems of Rice Intensification (SRI) Center (NOSC), a center for research, development, and training activities for SRI. Under SRI, reduced water input was applied in paddy fields instead of flood irrigation. The same cultivation practice was conducted in Cimanggu-Cilacap (Field 3) and Wates-Kulonprogro (Field 4).
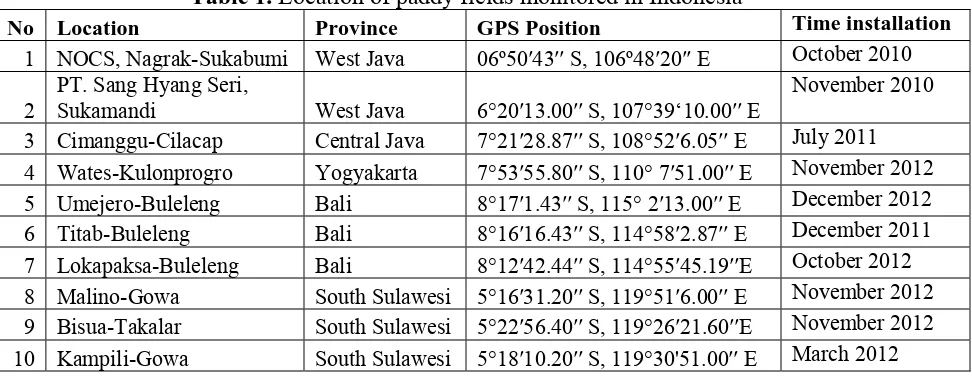
Table 1. Location of paddy fields monitored in Indonesia
No Location Province GPS Position Time installation
1 NOCS, Nagrak-Sukabumi West Java 06º50′43′′ S, 106º48′20′′ E October 2010
2
PT. Sang Hyang Seri,
Sukamandi West Java 6°20′13.00′′ S, 107°39‘10.00′′ E
November 2010
3 Cimanggu-Cilacap Central Java 7°21′28.87′′ S, 108°52′6.05′′ E July 2011 4 Wates-Kulonprogro Yogyakarta 7°53′55.80′′ S, 110° 7′51.00′′ E November 2012 5 Umejero-Buleleng Bali 8°17′1.43′′ S, 115° 2′13.00′′ E December 2012 6 Titab-Buleleng Bali 8°16′16.43′′ S, 114°58′2.87′′ E December 2011 7 Lokapaksa-Buleleng Bali 8°12′42.44′′ S, 114°55′45.19′′E October 2012 8 Malino-Gowa South Sulawesi 5°16′31.20′′ S, 119°51′6.00′′ E November 2012 9 Bisua-Takalar South Sulawesi 5°22′56.40′′ S, 119°26′21.60′′E November 2012 10 Kampili-Gowa South Sulawesi 5°18′10.20′′ S, 119°30'51.00′′ E March 2012
2.2 Conn
We deve with a su Davis V console ( temperatu Em50 lo types of measure and 30 c (GWL) a to measu
The conn connecte Sensors w were sto monitorin
nection syste
eloped a pad urveillance c
antage Pro2 (data logger)
ure, relative ogger develo
sensors: 5-soil moistur m below the and water tem ure soil matri
Figure
nection syste d to the Dav were set up ored in each ng, operating
em for field
ddy field mon camera and 2 Weather S ) and weath e humidity, w oped by Dec
-TE/EC-5, C re, soil temp
e soil surfac mperature an ix potential a
e 1. Connect
em for padd vis console b to measure h data logg g from 12:00
d monitoring
nitoring syst connected t Station (Dav er sensors. T wind speed, cagon Devic CTD, and M perature, and ce. The CTD nd was insta and was inst
tion of paddy
dy field mon by a Bluetoo
soil and me ger. The Fie 0 to 12:30 P
g
tem in Indon to meteorolo vis instrume The weather and precipi ces, Inc., U
MPS-2/MPS-d soil EC sen D sensor was alled at a 50 talled at a 30
y field moni
nitoring is sh oth connectio
eteorologica eldRouter w PM (local tim
Note:
nesia emplo ogical and s ents Corp, U
r parameters itation. As a SA. The Em -1. The 5-T nsors (5-TE) s used to me -cm depth. T 0-cm depth.
itoring system
hown in Fig on and to the al parameter was set up me) under re
eldRouter Davis console m50 Data logge Weather sensors
5TE/EC-5, b. C olar panel for F
oying a Field soil data log USA) consis s included so a soil data lo
m50 was co TE/EC-5 sen ) installed at easure the g The MPS-2/
m in Indone
gure 1. The e Em50 data rs every 30 m
to perform egulation by
e er
CTD, c. MPS-FieldRouter
dRouter equi ggers. We u
sting of a D olar radiatio ogger we use onnected to nsor was us
t depths of 5 groundwater
/MPS-1 was
sia
FieldRouter a logger by c min and the m quasi real a timer to co
2 sensors
through a did not u battery eq
3. Result
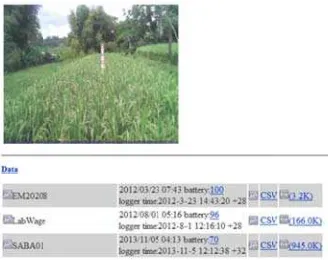
3.1 Acce
The raw monitore
ability.jp ability.jp
Buleleng
The raw located b particular
a GSM conn use electrica
quipped with
ts and Discu
ssing Data
data and da ed. For ex
p/FieldRoute p/FieldRoute
g, respectivel
Figure 2.
data for bo below the f
r software b
nection. The al power from
h a regulator
ussion
aily field im ample, fiel
r/vbox0081/ r/vbox0062/
ly (Figure 2)
Accessing d
oth meteoro field images efore further
e data is obt m farmers' h r as the main
mage can be ds monitor
/, http://x-/ for Ume ).
data paddy fi
ological and s on the we
r analysis.
tained via F houses or ot n power sour
accessed th red in Bal
-ability.jp/Fi
ejero-Bulele
ield monitor
soil param ebsites. The
FieldRouter o ther sources rce.
hrough an of li can be
ieldRouter/v
eng,
Titab-ring systems
meters are pr e raw data
official web s, but only a
fficial webs accessed t
vbox0048/, -Buleleng a
in Bali, Ind
resented gra are then co
site. This sy a solar pane
ite for each through http
and http
and Lokap
donesia
aphically an onverted fir
ystem el and
field
p://x-
3.2 Plant
A daily f the webs image ca with the NOSC, f
Fig
Although sent to th was dom cultivatio grew wel very you informati profile an
3.3 Mete
Meteorol precipitat humidity
t growth mo
field image i site it is pres alendar. On s Internet con five field ima
gure 3. Plant
h some field he server (F minated by s on at NOSC
ll to cover t ung seedling ion from fie nalysis for b
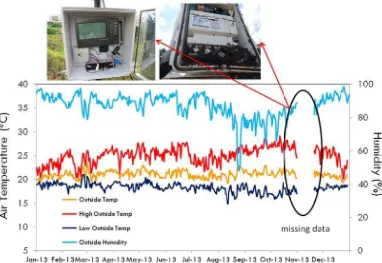
eorological m
logical param tion were m y during 201
onitoring
is sent by th sented as a s some days, t nnection duri
ages were lo
t growth mo
d images we igure 3). In oil, owing t C. In contras he entire fie gs results in eld images etter crop m
monitoring
meters, inclu monitored we
3 at
Malino-he FieldRout single image the FieldRou ing the trans st, as shown
nitored by th
ere lost, field the early st o a single p st, in the mi eld. This res
more dry m was useful management [
data
uding solar r ell by field m
-Gowa, Sou
ter through t e in which m uter fails to s smission tim n in Figure 3
he FieldRou
d images de ages, plants planting with id-season an ult suggeste matter produ for assessin [7].
radiation, air monitoring. F
th Sulawesi.
the Internet monthly ima send a field me. As an ex
.
uter in NOSC
epicting plan were barely h very youn nd late-seaso ed that use o uction than t ng plant co
r temperatur Figure 4 sho . The trend o
connection age data can image when ample, in Se
C, West-Java
nt growth w y visible and ng seedlings on growth s of a single p
three plants ondition usin
re, humidity, ows daily air of air tempe
to the serve n be viewed n there is pro eptember 20
a, Indonesia
were captured d the field im
adopted for stages, the p plant per hill
per hill [6] ng plant spe
, wind speed r temperatur erature was f
er. On plants l with . The ectral
to contra 29.2°C, were 98.6
Meteorol Bisua-Ta they wer panel wa by natura data we meteorol
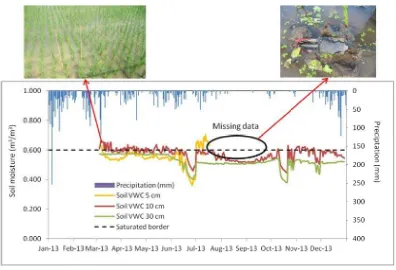
3.4 Soil m
Soil data importan monitorin relationsh
ast that of 21.1°C, and 6%, 87.2%,
Figure 4. D
logical data akalar, Kamp re lost when as insufficien
al events suc re different logical data l
monitoring
a, including nt for monit ng. Here w hip paramete
humidity. T d 14.9°C, re
and 48.0%,
aily air temp
were lost in pili-Gowa, a n the battery
nt. Furthermo ch as severe
t in each lost during 2
data
g soil moist toring water we present
ers (Figure 5
The maximu espectively.
respectively
perature and
some locati and Malino-G
of the cons ore, data we weather or a field. For 2013 as prese
ture, soil te r status in
only prec 5).
um, average The maxim y.
d humidity at
ons on certa Gowa. Altho sole was dep ere lost when
animal (inclu example at ented in Figu
emperature, the fields. ipitation an
e, and minim mum, averag
t Malino-Go
ain dates, suc ough the dat
pleted and b n the meteor
uding ant an t Malino-G ure 4.
GWL, and Soil data w nd soil-moi
mum air te ge, and mini
owa, South S
ch as at Lok ta were store backup powe rological sen nd bee) activ Gowa, there
d soil matr were collecte
isture data
mperatures imum humi
Sulawesi.
kapaksa-Bule ed in the con
er from the nsors were br vity. The tota were 5.2%
ix potential ed well by
as cause–e were dities
At Malin in the ear 5). Soil m Novembe
However occurred sensor ca as occurr Common condition
3.5 Discu
Quasi re monitorin were stor for obser moisture in the fie
Figure 5. So
no-Gowa, co rly crop seas moisture the er 2013.
r, some data at the 5 cm able was unp
red at Bisua nly, all prob ns, though hu
ussion
eal-time mon ng, based on red in the fie rving plant g data, were r elds. This ex
oil moisture
onventional r son, as indic en dropped b
a such as for m soil depth i
plugged from -Takalar, NO blems are ca
uman error m
nitoring in n experience eld data logg growth and c required as b xperiment re
and precipit
rice cultivat cated by the by the end o
r soil moistu in August 2 m the data lo OCS, Ciman aused by na may also cau
Indonesian e. Although gers and sent condition and basic inform evealed that
tation data a
tion with con soil moistur of the crop s
ure were also 013 (Figure ogger or the nggu-Cilacap atural events use the probl
paddy field this monitor t daily to the d the daily n mation to mon
quasi real-t
at Malino-Go
ntinuous flo re level abov season, occu
o lost when
ds was more ring did not e server. The numeric data nitor water s time monitor
owa, South S
ooding irriga ve the satura urring at the
n the sensors tion, data we the data logg Sang Hyang heavy rain o
e appropriat send real-tim e daily field i a, the meteor status and w
ring was mo
Sulawesi
ation was ap ation line (F end of June
s were broke ere lost whe ger was depl Seri-Sukam or extremely
te than real me data, the image was u rological and weather condi
Since 2010 the field situations have been monitored effectively by a field monitoring system that yields numeric and image data. The data were very important for improving crop management under conditions of climate change. However, the stability of current monitoring systems depends on the field solar power supply and the Internet connection. If there are any problems with the Internet connection during the data transmission time, the field image is lost. In addition, data are lost when the sensors are broken, the battery of the data logger is depleted, or the sensor cable is unplugged from the data logger.
4. Conclusions and future works
The field monitoring system showed good performance for long-term experiments. It was effective, efficient, and reliable in monitoring paddy fields in Indonesia. The actual field conditions were monitored well in term of image, numeric, and graphical data acquisition. Although this monitoring did not send real-time data, the data were stored in the field data loggers. Quasi real-time monitoring was more power-saving and Internet-cost-effective than real-time monitoring. However, some problems also occurred in the fields that caused data loss. For better maintenance and to minimize the problems, it is best to involve local people in maintaining the system. In addition, an advanced data management system should be developed in the future works by analyzing the data with specific purposes dealing with climate change.
Acknowledgments
This research was part of a research project entitled “Environmental Monitoring System on the Advancement of the System of Rice Intensification (EMSA-SRI)”collaboration with the University of Tokyo, funded by the Ministry of Education, Republic of Indonesia (2010–2012), with subsequent support from the Research Institute of Humanity and Nature (RIHN), Japan, in its collaborative project with Bogor Agricultural University (IPB) launched in 2011 and entitled “Designing Local Framework for Integrated Water Resources Management”.
References
1. Barker, R., Dawe, D., Tuong, T.P., Bhuiyan, S.I., Guerra, L.C., 2000. The outlook for water resources in the year 2020: challenges for research on water management in rice production. International Rice Commission Newsletter 49, 7-21
2. De Silva, C.S., Weatherhead, E.K., Knox, J.W., Rodriguez-Diaz, J.A., 2007. Predicting the impacts of climate change - A case study of paddy irrigation water requirements in Sri Lanka. Agr Water Manage 93, 19-29
4. Mizoguchi, M., Ito, T., Arif, C., Mitsuishi, S., Akazawa, M., 2011. Quasi real-time field network system for monitoring remote agricultural fields, SICE Annual Conference 2011, Waseda University, Tokyo, Japan, pp. 1586-1589.
5. Suarja, I.G., Thijssen, R. 2003. Traditional Water Management in Bali. LEISA Magazine, September 2003 pp.25-26. Accesses at [23May 2014]:
http://www.fao.org/prods/gap/database/gap/files/597_WATER_MGMT_BALI.PDF 6. San-oh, Y., Mano, Y., Ookawa, T., Hirasawa, T., 2004. Comparison of dry matter
production and associated characteristics between direct-sown and transplanted rice plants in a submerged paddy field and relationships to planting patterns. Field Crop Res 87, 43-58 7. Doi, R., C. Arif, B.I. Setiawan and M. Mizoguchi, 2013. Quantitative use of
luminosity-normalized grayscale images of greenness, redness and yellowness of a rice canopy derived from multi-temporally acquired digital photographs. Int. J. Agric. Biol., 15: 707-712