http://dx.doi.org/10.17503/Agrivita-2014-36-3-268-277
DROUGHT TOLERANCE OF LOCAL ROTE AND CHECK VARIETIES
OF GROUNDNUT (Arachis hypogaea L.) UNDER DRY SEASON IN TWO LOCATIONS
IN EAST NUSA TENGGARA
Yosep S. Mau*), A.S.S. Ndiwa and I G.B.A. Arsa Faculty of Agriculture, Nusa Cendana University Jl. Adisucipto Penfui Kupang, East Nusa Tenggara, Indonesia
*)
Corresponding author Phone: +62-380-881085; +62-813-92990010 E-mail: [email protected]
Received: August 7, 2014/ Accepted: October 27, 2014
ABSTRACT
Groundnut is the most important pulse crop in East Nusa Tenggara (ENT); however, the crop yield in ENT is low due to erratic climatic condition, drought stress, and low yielding ability of most cultivated genotypes. Local Rote is a well-known local groundnut variety in ENT, which is a potential superior variety and parental source due its large seed size and high yielding ability. Information on its resistance to abiotic and biotic stresses is important for its future development. Five groundnut genotypes, Local Rote and check varieties were elucidated to identify drought resistant genotypes. The study was carried out in a split-plot design with three replicates in two locations during dry season 2013. Two irrigation regimes (optimum and stress conditions) were assigned as main plot and 5 groundnut geno-types as sub-plot. Research results revealed significant effect of irrigation by genotype interaction on observed yield and yield compo-nent characters in both locations. Seed yields of most tested genotypes were below their yield potential. Local Rote yielded best over two locations (1.26 t.ha-1 seed yield). Yields of check varieties were below 1.0 t.ha-1. Local Rote was considered tolerant to drought based on STI, GMP, SSI and YL selection indices.
Keywords: drought, groundnut, local, tolerance, variety
INTRODUCTION
Groundnut (Arachis hypogaea L.) is the second most important pulse crop in Indonesia, and the most important one in East Nusa Tenggara (ENT) Province. It is an important oil seed crop as well as food and feed crop.
Groundnut kernel is rich of both oil (43-55%) and protein (25-28%) (Naeem-ud-Din et al., 2012) that renders it important for human diet as well as for the animals.
In Indonesia, ENT Province is one of the major groundnut growing areas due to its semi-arid climatic conditions that favor the crop growth and production. However, unpredictable environ-mental conditions, especially the uncertain rainfalls, and water shortage have been the major limiting factors for groundnut production in this region. Unavailability of high yielding and well adapted varieties are additional limiting factors that cause yield of this crop in this region very low. Five-year records showed that groundnut productivity in ENT Province was only about 1.01-1.06 t.ha-1 of pod yield (Department of Agriculture and Plantation, 2010), which was below the national level (1.8-2.0 t.ha-1) (Federal Statistical Bureau, 2011). These emphasize the need to develop high yielding and well adapted varieties having resistance/tolerance to biotic and abiotic stresses, especially drought that limit the crop productivity in this region.
of local germplasm of ENT Province as well as available check/released varieties.
Local Rote variety was identified to be high yielding and widely adapted to agro climatic conditions of ENT province (Ndiwa et al., 2011). However, farmer-level productivity of this local groundnut genotype is still below its yield potential due to erratic climatic condition and poor farming practices. Among these, erratic climatic condition and drought stress are the main constraints for crop production. Development of high yielding varieties having tolerance to drought stress is the best solution for this problem. One of the main goals in breeding programs is selection of the best genotypes under drought stress conditions (Richards et al., 2002).
Water deficit, commonly known as drought, can be defined as the absence of adequate moisture necessary for normal plant growth and to complete the life cycle (Zhu, 2002). A number of selection indices have been proposed to determine drought tolerance in many crop species, including stress tolerance index (STI) (Fernandez, 1992), stress susceptibility index (SSI) (Fischer and Maurer, 1978), percent yield loss (YL) (Blum, 1980), and geometric mean productivity (GMP) (Golbashy et al., 2010). Some researchers found that cultivars which had the lowest SSI values were more drought resistant than cultivars with highest SSI values (Sio-Se et al., 2006; Bahar and Yildirim, 2010). On the other hand, cultivars which had high STI values were drought tolerant and those with low STI values were drought susceptible. Golbashy et al. (2010) found that STI and GMP indices have similar ability to separate drought sensitive and tolerant genotypes, which are in line with observation by Sio Se et al. (2006). These indices, therefore, can also be employed to select high yielding and drought tolerant groundnut genotypes, specifically adapted to semi arid climatic condition of ENT province. Therefore, it is necessary to identify selection indices able to distinguish high yielding and drought tolerant groundnut cultivars in drought stress and in non stress (normal) conditions. The present study was carried out to determine yield potential of local Rote and four check/released groundnut varieties and 2) to determine drought tolerance level of the tested groundnut genotypes.
MATERIALS AND METHODS
Site Description and Research Design
This research was carried out in the farmer’s field in two locations, i.e. Naioni Village in Kupang District, West Timor and Takeme Village in Rote Ndao District, Rote Island, during dry season 2013 (June to October 2013). Research site at Kupang was located at about 260 m above sea level (asl) and that in Rote was located at about 112 m asl. Soil type of both locations was Vertisol (Grumosol: USDA). A split plot design was employed in each location, consisting of irrigation regime as the main plot and groundnut genotype as sub-plot treatments. Irrigation regime was of two levels, i.e. normal (optimum) condition (I0) and minimum/stress
condition (I1). In both stress and normal
conditions, the plants were irrigated once a day during the first one week after planting until field capacity level, followed by two days interval irrigation until flowering stage. Irrigation treat-ments were applied at the flowering stage until two weeks before harvest. In normal condition the plants were irrigated once in four days while in the stress condition, the plants were irrigated once in 10 days. Irrigations in 4 and 10 days intervals for normal and minimum/stress conditions, respectively, were based on calculated water loss through evapotranspiration employing mean Et0 values in the research
Crop Management
After land preparation, the groundnut genotypes were grown in a planting space of 50 cm x 40 cm in plots of 3 m length and 2 m width. The space between the plots was 1 m. Two seeds were planted in a planting hole, and a total of 60 seeds were planted in each plot. Field plots were subjected to normal agronomic practices except irrigation treatment that was applied at flowering stage (about one month after planting for all tested genotypes). Fertilizers were applied at sowing time with a composite fertilizer (36% P2O5, 36% N and 36% KCl) at a rate of
100 kg.ha-1).
Observation and Data Analysis
The variables observed in this experiment included days to flowering, days to harvesting, number of pod per plant, number of seed per pod, 100-seed dry weight and seed dry weight per plot. Seed dry yield per plot was used to assess drought tolerance level based on the following indices (Fischer and Maurer, 1978; Blum, 1980; Fernandez, 1992; Sio-Se et al., (potential) yield of a given genotype, respectively. Y.s and Y.p are average yields of all genotypes under stress and non-stress conditions, respectively. Data were recorded from 20 sample plants in each plot and were subjected to variance analysis appropriate for split plot design using Gentstat ver. 12 software’s. Means were compared using Duncan’s Multiple Range Test at 0.05 level of probability when F test is significant. Correlation analysis was also carried out among drought stress indices employed.
RESULTS AND DISCUSSION
Growth Component Variables
Irrigation treatment was applied about one month after planting, at which most of the
geno-types were at the flowering stage. In both locations, data analysis revealed no significant effect of genotype by irrigation interaction on days to flowering but the single factor, genotype, posed highly significant effect on the trait indicating that days to flowering were mainly controlled by genetic factor. Similarly, no signi-ficant genotype by irrigation interaction effect was observed on days to harvesting but the genotype factor alone posed significant effect on this trait in both Kupang and Rote. Two check varieties, i.e. Gajah and Kancil exhibited a shorter flowering days than other genotypes while Local Rote exhibited the longest flowering date (Table 1). The check variety, Jerapah, exhibited a shorter harvesting date in both locations but was not substantially different from that of the other three check varieties in Rote. As with the flowering dates, the harvesting dates of Local Rote were the longest in both Kupang and Rote (133.5 and 135.67 days, respectively) indicating its longer generative period, and hence, longer period of pod formation and pod filling.
Harvesting date of the four check varieties ranged between 107.5 and 109.33 days, which were about three weeks earlier than Local Rote genotype (Table 1). The longer harvesting date, and hence the longer generative period, of the local Rote genotype was due to genetic factor, where this local genotype is a semi-determinate plant type with a more and longer branching pattern. Pod formation of this local genotype was also distributed along the plant branches. The four check varieties, on the other hand, are determinate types with erect and enclosed branching and close clustered pod formation at the plant main stem.
Table 1. Days to flowering and days to harvesting of the tested groundnut genotypes under two irrigation regimes in two locations
Genotype Days to flowering
*
Days to harvesting*
Kupang Rote Kupang Rote
Local Rote 29.5 d 33.0 c 133.5 c 135.67 b
Gajah 26.2 a 26.5 a 108.3 b 109.33 a
Jerapah 27.2 bc 28.5 b 107.5 a 108.50 a
Kancil 26.3 a 26.3 a 108.2 ab 109.33 a
Bison 27.8 c 28.3 b 108.0 ab 108.67 a
Mean 27.4 28.5 113.1 114.3
Irrigation Regime
I0 113.6 b 114.53 a
I1 112.6 a 114.07 a
Remarks: *Average of stress and normal conditions. I0: normal/optimum condition, I1: stress condition. Means followed
by a common letter(s) within each column do not significantly differ using DMRT at 0.05 level of significance
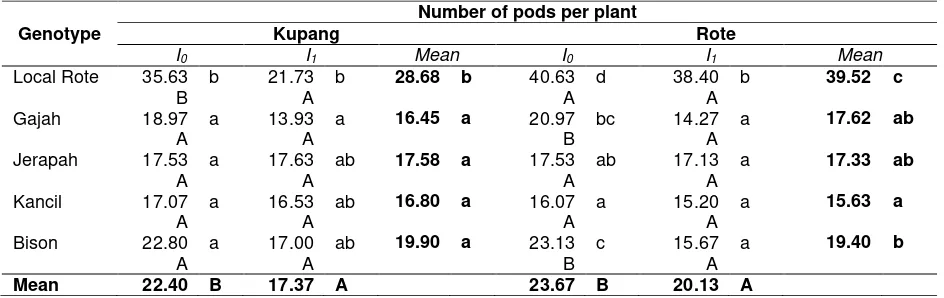
Table 2. Average number of pods per plant of the tested groundnut genotypes under two irrigation regimes in two locations
Remarks: I0: normal/optimum condition, I1: stress condition. Means followed by a common letter (s) within each column
or each row do not significantly differ using DMRT at 0.05 level of significance
Yield Component Variables
Yield component variables observed in this study included number of pods per plant, number of seeds per pod and 100-seed dry weight. ANOVAs results showed that genotype by irrigation interaction significantly affected number of pod per plant in both locations. This implies that number of pod per plant varied according to the genotype, and the magnitude of this variation/change was determined by irrigation levels applied.
Data in Table 2 revealed that the highest number of pods per plant in Kupang was exhibited by Local Rote (35.63 pods) at optimum irrigation treatment, and was significantly higher than that of the same genotype at water stress treatment (21.73 pods). In water stress treatment, Local Rote produced the highest number of pod
per plant and was significantly higher than that of Gajah but was not significantly different from other varieties. On average, Local Rote also ex-hibited a higher number of pods per plant (28.68 pods) compared to the tested check varieties under both irrigation treatments.
Similar with the research site in Kupang, Local Rote genotype also exhibited the highest number of pods per plant in both normal and stress conditions in Rote (Table 2). This genotype also produced the highest pod number on average for both normal and stress conditions. The better performance of Local Rote genotype in Rote Island indicates its good adaptability to the research location since this genotype was originated from this Island and has long been cultivated by the local farmers for many generations.
Genotype
Number of pods per plant
Kupang Rote
I0 I1 Mean I0 I1 Mean
Local Rote 35.63 b 21.73 b 28.68 b 40.63 d 38.40 b 39.52 c
B A A A
Gajah 18.97 a 13.93 a 16.45 a 20.97 bc 14.27 a 17.62 ab
A A B A
Jerapah 17.53 a 17.63 ab 17.58 a 17.53 ab 17.13 a 17.33 ab
A A A A
Kancil 17.07 a 16.53 ab 16.80 a 16.07 a 15.20 a 15.63 a
A A A A
Bison 22.80 a 17.00 ab 19.90 a 23.13 c 15.67 a 19.40 b
A A B A
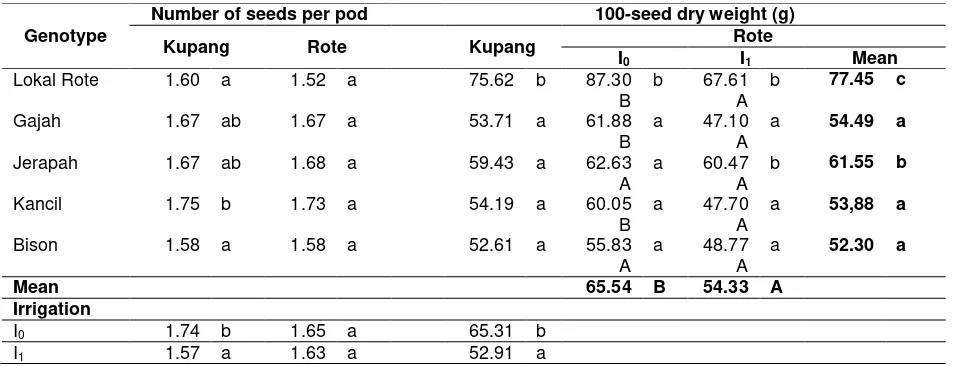
In contrast to the number of pods per plant, there was no significant genotype by irrigation interaction effect on the number of seeds per pod in both locations but the genotype and irrigation genotypes performed almost similarly in both normal and stress conditions.
As with number of seed per pod, 100-seed dry weight was not affected by interaction between irrigation by genotype in Kupang but the trait was significantly affected by interaction between the two treatments applied in Rote. Local Rote produced the highest mean 100-seed dry weight over two irrigation regimes in both Kupang (75.62 g) and Rote (77.45 g) which were much higher than that of other genotypes (Table 3) indicating its good adaptability to the research location. The higher 100-seed dry weight of Local Rote was also in line with the fact that this genotype possesses a larger seed size compared to other tested varieties. Under normal condition in Rote, Local Rote produced a much higher 100-seed dry weight in Rote (87.30 g), which was other varieties. On average, 100-seed dry weight of all genotypes provided with water stress treatment (52.91 g) was also significantly lower than that of normal irrigation (65.31 g) (Table 3).
The significant interaction effect of geno-type by irrigation treatments on number of pods per plant was due to the effect of water treat-ment, and the magnitude of this effect varied according the different response of the tested genotypes. Optimum irrigation during plant growth and development stages ensures water availability, which is essential for soil mineral and nutrition intake by the plants. This would result in a maximum photosynthate accumu-lation required for optimum plant growth and
development as well as plant production. Water stress condition, on the other hand, reduced soil nutrient intake by the plant that may inhibit photosynthesis process with the consequence of reduced plant growth and development. This was in line with Kambiranda et al. (2011) who maintained that water deficit affects thylakoid electron transport, phosphorylation, carboxylation and photosynthesis. Changes in the lipid content and composition are common in water-stressed plants and this increases membrane permeability, which causes damage and membrane disruption as well as reduction in photosynthesis. Further-more, different genetic background of the tested genotypes has led to different plant responses to the water stress condition, and hence different plant products such as number of pods produced per plant, etc. In accordance with this, Winarso (2005) stated that availability of growth factors, either in an optimum or a limited/ inadequate condition during plant growth and development, determines the plant production, and whether the plant production is within a maximum or minimum levels will depend on the plant’s genetic background that control its adaptation to the environment.
http://dx.doi.org/10.17503/Agrivita-2014-36-3-268-277
Table 3. Average number of seeds per pod and 100-seed dry weight of the tested groundnut genotypes under two irrigation regimes in two locations
Remarks: I0: normal/optimum condition, I1: stress condition. Means followed by a common letter (s) within each
column or each row do not significantly differ using DMRT at 0.05 level of significance
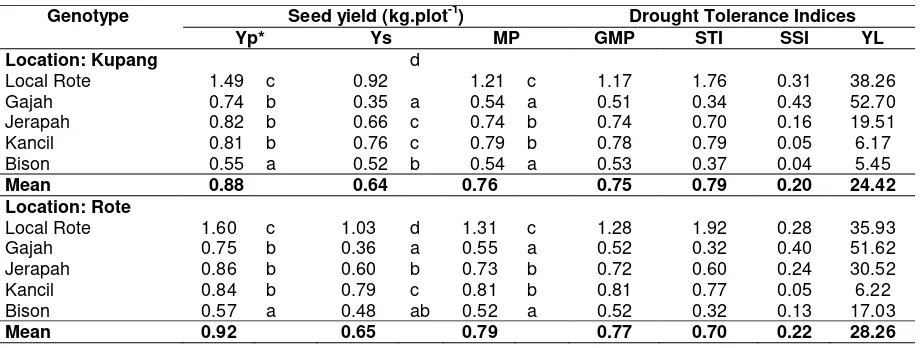
Seed Yield and Level of Tolerance to Drought Variance analysis revealed significant effect of irrigation by genotypes interaction on seed yields of tested groundnut genotypes both in Kupang and in Rote. As with irrigation by genotype interaction effect, either the main plot treatment (irrigation) or sub-plot treatment (genotype) alone also exhibited significant effect on seed yields. Average seed yields of the genotypes under normal (Yp) and stress (Ys) conditions in both locations are presented in Table 4. In Kupang, an average seed yield per plot of the tested genotypes was 0.88kg.plot-1 in normal condition and 0.64kg.plot-1 in stress condition while in Rote, the average seed yield was 0.92 kg.plot-1 in normal condition and 0.65 kg.plot-1 in water stress condition (Table 4). On average, seed yields decline was about 34% (39.7% in Kupang and 27% in Rote) in water stress condition compared to optimum condition. This decline was close to that observed by Ekanayake et al. (1990) indicating moderate drought stress index (0.3) of the trial condition. Observed yields of the four check varieties were below their yield potentials. Groundnut yield decline due to drought stress was also reported by other workers (Reddy et al., 2003; Songsri et al., 2008; Songsri et al., 2009).
In normal irrigation treatment, seed yield of Local Rote genotype was much higher than that of the four check varieties. The same situation
holds for water stress treatment (Table 4). The mean seed yields of Local Rote at both conditions at the two research sites were also higher than the check varieties. Higher seed yield of Local Rote was supported by higher yield component such as the number of pods per plant (Table 2) and 100-seed weight (Table 3), which implies that this genotype was superior over the check varieties in both yield performance as well as adaptation capacity to stress condition in the trial locations.
Drought tolerance levels of the tested genotypes were assessed based on four selection indices, i.e. stress tolerance index (STI), stress susceptibility index (SSI), percent yield loss (YL), and geometric mean productivity (GMP). Research results revealed that STI values of the genotypes ranged from 0.34 to 1.76 in Kupang and 0.32 to 1.92 in Rote (Table 3). Only the local genotype, i.e. Local Rote was consider-ed tolerant to drought basconsider-ed on its high STI value (≥1.0) while the four check varieties were considered susceptible to drought stress based on their low STI values (≤1.0). Genotypes with high STI values were considered drought tolerant while those with lower STI values were considered drought susceptible (Fischer and Maurer, 1978). The local genotype considered tolerant based on STI was also considered tolerant based on geometric mean productivity, GMP (Table 4).
Genotype
Number of seeds per pod 100-seed dry weight (g)
Kupang Rote Kupang Rote
I0 I1 Mean
Lokal Rote 1.60 a 1.52 a 75.62 b 87.30 b 67.61 b 77.45 c
B A
Gajah 1.67 ab 1.67 a 53.71 a 61.88 a 47.10 a 54.49 a
B A
Jerapah 1.67 ab 1.68 a 59.43 a 62.63 a 60.47 b 61.55 b
A A
Kancil 1.75 b 1.73 a 54.19 a 60.05 a 47.70 a 53,88 a
B A
Bison 1.58 a 1.58 a 52.61 a 55.83 a 48.77 a 52.30 a
A A
Mean 65.54 B 54.33 A
Irrigation
I0 1.74 b 1.65 a 65.31 b
Table 4. Average seed yields of groundnut genotypes under optimal (Yp) and stress (Ys) conditions, and calculated drought tolerance indices at two locations
Genotype Seed yield (kg.plot-1) Drought Tolerance Indices
Yp* Ys MP GMP STI SSI YL
Location: Kupang
Local Rote 1.49 c 0.92
d
1.21 c 1.17 1.76 0.31 38.26
Gajah 0.74 b 0.35 a 0.54 a 0.51 0.34 0.43 52.70
Jerapah 0.82 b 0.66 c 0.74 b 0.74 0.70 0.16 19.51
Kancil 0.81 b 0.76 c 0.79 b 0.78 0.79 0.05 6.17
Bison 0.55 a 0.52 b 0.54 a 0.53 0.37 0.04 5.45
Mean 0.88 0.64 0.76 0.75 0.79 0.20 24.42
Location: Rote
Local Rote 1.60 c 1.03 d 1.31 c 1.28 1.92 0.28 35.93
Gajah 0.75 b 0.36 a 0.55 a 0.52 0.32 0.40 51.62
Jerapah 0.86 b 0.60 b 0.73 b 0.72 0.60 0.24 30.52
Kancil 0.84 b 0.79 c 0.81 b 0.81 0.77 0.05 6.22
Bison 0.57 a 0.48 ab 0.52 a 0.52 0.32 0.13 17.03
Mean 0.92 0.65 0.79 0.77 0.70 0.22 28.26
Remarks: *Yp(normal/optimal condition), Ys(stress condition), MP (mean productivity), GMP (geometric mean productivity), STI (stress tolerance index), SSI (stress susceptibility index), YL (percent yield loss)
Table 5. Selected groundnut genotypes based on drought tolerance indices at two locations
Selected genotypes
Drought Tolerance Indices* Kupang Rote
Local Rote Yp Yp
Local Rote Ys Ys
Local Rote STI STI
Local Rote GMP GMP
Local Rote, Gajah, Jerapah, Kancil, Bison
SSI SSI
Bison, Kancil, Jerapah, Local Rote
YL YL
Remarks: *Yp (normal/optimal condition), Ys (stress condition), MP (mean productivity), YL (percent yield loss), STI (stress tolerance index), SSI (stress susceptibility index), GMP (geometric mean productivity)
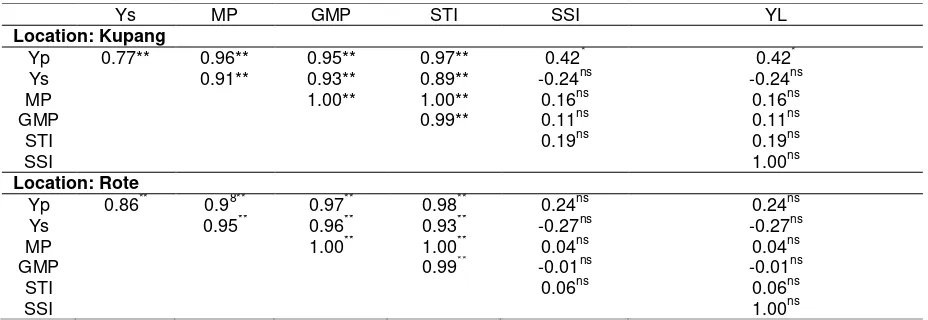
This finding is supported by highly significant correlations observed between the two selection indices (Table 5). It is interesting to note that the genotype selected based on STI and GMP (Table 5) was also the best yielding genotype in both normal and stress conditions (Table 4). This implies that STI and GMP are reliable selection indices to select for drought tolerant and high yielding genotypes in both normal and stress conditions. The results of this study were closely in line with previous works (Sio-Se et al., 2006; Golbashy et al., 2010).
http://dx.doi.org/10.17503/Agrivita-2014-36-3-268-277
Table 6. Correlations between selection indices and mean yield of groundnut genotypes under normal and stress conditions at two locations
Remarks: ** Significant at P≤0.01 level, * Significant at P≤0.05 level, ns: not significant
Positive and significant correlation between Yp and Ys with STI and GMP (Table 6) indicates that STI and GMP can be used to select for drought tolerant and high yielding genotypes in normal and stress conditions. On the contrary; negative and insignificant correlation between Ys with either SSI or YL implies that SSI and YL were able to detect drought tolerant genotypes but partly effective in selecting high yielding genotypes in stress condition.
Overall, the results of the present study revealed only one tolerant groundnut genotype, i.e, Local Rote, on the basis of four selection indices, i.e. STI, SSI, YL and GMP. This local variety was not only drought tolerant but also high yielding in both normal and stress conditions.
CONCLUSION
The present study demonstrated significant effect of drought stress on groundnut genotype’s seed yields. Local Rote genotype was found to be the best performing genotype under normal and stress conditions in both Kupang and Rote research locations. Mean seed yield per plot of this genotype over two irrigation treatments in Kupang was 1.21 kg.plot-1 (2.02 t.ha-1) and that in Rote Island was 1.31 kg.plot-1(2.18 t.ha-1). On average, seed yield over two locations was 1.26 t.ha-1. Although the four check varieties were considered drought tolerant based on SSI and YL values, these varieties; however, performed poorly under the trial conditions as indicated by their lower yields compared to their yield
potentials. Local Rote genotype was, therefore, considered and selected as the drought tolerant and high yielding variety in both normal and stress condition based on STI and GMP. These two selection indices were reliable to be employed in selection of drought tolerant and high yielding groundnut genotypes in future works.
ACKNOWLEDGEMENT
The authors would like to thank Directorate of Higher Education Degree of Indonesian Department of Education and Culture, and Rector of Universitas Nusa Cendana for the grant provided to the research team through University Priority Research Program and East Nusa Tenggara Province Department of Agriculture for in kind supports for the research carried out in Rote. Special thanks are addressed to Mr. Sami Plaituka and Mrs. Ida Bahren for the great assistances during data collection in the field.
REFERENCES
Bahar, B. and M. Yildirim, 2010. Heat and drought resistances criteria in spring bread wheat: Drought resistance parameters. Scientific Research and Essays, 5 (13): 1742-1745. (http://www.
academicjour-nals.org/article/article1380632130_Baha r%20and%20Yildirim.pdf).
Ys MP GMP STI SSI YL
Location: Kupang
Yp 0.77** 0.96** 0.95** 0.97** 0.42* 0.42*
Ys 0.91** 0.93** 0.89** -0.24ns -0.24ns
MP 1.00** 1.00** 0.16ns 0.16ns
GMP 0.99** 0.11ns 0.11ns
STI 0.19ns 0.19ns
SSI 1.00ns
Location: Rote
Yp 0.86** 0.98** 0.97** 0.98** 0.24ns 0.24ns
Ys 0.95** 0.96** 0.93** -0.27ns -0.27ns
MP 1.00** 1.00** 0.04ns 0.04ns
GMP 0.99** -0.01ns -0.01ns
STI 0.06ns 0.06ns
Blum, A. 1980. Breeding and Selection for Adaptation to Stress; Genetic Improve-ment of Adaptation. In: Turner, N. C., and P. J. Kramer (Eds.). Adaptation of plants to Water and High Termperature Stress. John Willey and Sons, Inc. New York. p. 450-452.
Department of Agriculture and Plantation, 2010. Harvest Area, Productivity and Production of Rice, Corn and Beans During 2006-2010. Department of Agri-culture and Plantation of East Nusa Tenggara Province. Kupang. (In Indonesian)
Ekanayake, I.J., P. Malagamba and D.J. Midnore, 1990. Effect of water stress on yield of sweet potatoes. In: Howeler, R. H. (Ed.). Proc. Of the Eight Symp. of the Inter. Soc. For Tropical Root Crops. CIAT. Thailand. p. 520-528.
Federal Statistical Bureau. 2011. Indonesia in Figures 2010. Indonesian Federal Statistical Bureau. Jakarta.
Fernandez, G.C.J. 1992. Effective selection criteria for assessing plant stress tolerance. In C.G. Kuo (Ed.): Adaptation of Food Crops to Temperature and Water Stress. Proceeding of an Int. Symp. AVRDC-Inst. of Botany, Taiwan. p. 257-270
Fischer, R.A. and R. Maurer. 1978. Drought resistance in spring wheat cultivar: I. Grain yield response. Australian Journal of Agriculture Research, 29: 897-912. Fischer, R.A. 1984. Physiological limitations to
producing wheat in semi-tropical and tropical environments and possible selection criteria. In: Wheats for More Tropical Environments. A Proceedings of the International Symposium, Mexico, D.F: CIMMYT. p. 209-230.
Golbashy, M., M. Ebrahimi, S.K. Khorasani and R.Choukan, 2010. Evaluation of drought tolerance of some corn (Zea mays L.) hybrids in Iran.African Journal of Agriculture Research,5(19): 2714-2719. (http://www.academicjournals.org/article/ article1380965816_Golbashy%20et%20 al.pdf).
Kambiranda, D.M., H.K.N. Vasanthaiah, R. Katam, A. Ananga, S.M. Basha and K. Naik. 2011. Impact of Drought Stress on Peanut (Arachis hypogaea L.)
Productivity and Food Safety. In Hemanth Vasanthaiah (Ed.). Plants and Environment. In Tech Publisher. (http:// www.intechopen.com/books/plants-and- environment/impact-of-drought-stress-onpeanut-arachis-hypogaea-l-productivi ty-and-food-safety). p. 249 -272
Mau, Y. S. 2011. Evaluation of drought tolerance level of sweet potato (Ipomoea batatas L.) germplasm from NTT Province, pp.370-376. In Nurbaity, A., E. Subroto, E.Y. Setyowati, F. Stanica, I.N. Bari, K. Wimmers, N. Carsono, O. Mulyani, P. Lehmousloto, P.S. Teng, S.Y. Siswanto, S. Aleksic (Eds.). Proceeding of Inter-national Conference on Sustainable Agriculture and Food Security: Challenges and Opportunities. Bandung Indonesia, 27-28 November 2011. Naeem-ud-Din, M. Tariq, M. K. Naeem, M. F.
Hassan, G. Rabbani, A. Mahmood and M.S. Iqbal, 2012. Development of Bari-2011: A High Yielding, Drought Tole-rant Variety Of Groundnut (Arachis Groundnut Variety. Research Report. Department of Agriculture and Plantation of East Nusa Tenggara Province. Kupang. (In Indonesian) Reddy, T.Y., V.R. Reddy and V. Anbumozhi,
2003. Physiological responses of peanut (Arachis hypogaea L.) to drought stress and its amelioration: a critical review. Plant Growth Regulation, 41: 75–88. (http://link.springer.com/article/10.1023/ A%3A1027353430164).
Richards R.A., G.J. Rebetzke, A.G. Condon and A.F. van Herwaarden. 2002. Breeding opportunities for increasing the efficien-cy of water use and crop yield in temperate cereals. Crop Sci. 42: 111- 121. (doi:10.2135/cropsci2002.1110). Sanjari, P.A., B.D. Masjedlou and R.T. Aliyev,
www.academicjournals.org/article/article 1380971037_Pireivatlou%20and%20Ali yev.pdf).
Sio-Se M.A., A. Ahmadi, K. Poustini and V. Mohammadi. 2006. Evaluation of drought resistance indices under various environ-mental conditions, Field Crop Res. 98: 222-229.
Songsri, P., S. Jogloy, T. Kesmala, N. Vorasoot, C. Akkasaeng, A. Patanothai and C.C. Holbrook. 2008. Responses of reproductive characters of drought resistant peanut genotypes to drought. Asian Journal of Plant Sciences, 7(5): 427–439. (http://scialert.net/qredirect. php?doi=ajps.2008.427.439&linkid=pdf).
Songsri, P., N. Vorasoot, S. Jogloy, T. Kesmala, C. Akkasaeng, A. Patanothai and C.C. Holbrook. 2009. Evaluation of yield and reproductive efficiency in peanut (Arachis hypogaea L.) under different available soil water. Asian Journal of Plant Sciences, 8(7): 465–473. (http://scialert.net/qredirect. php?doi=ajps.2009.465.473&linkid=pdf). Winarso, S. 2005. Soil Fertility. Fundamentals of
Soil Health and Quality. Gava Media Publisher. Yogyakarta. (In Indonesian). Zhu, J.K. 2002. Salt and drought stress signal