Media Trend
Berkala Kajian Ekonomi dan Studi Pembangunanhttp://journal.trunojoyo.ac.id/mediatrend
Mapping Potential Technology Appropriate Small And Medium Enterprises As
Efforts To Improve Technology Preparation Leadership In Region Of Ponorogo
Rochmat Aldy Purnomo1,2,*, Titin Eka Ardiana2,
1,2 Mahasiwa Program Doktor Ilmu Ekonomi Universitas Sebelas Maret 2 Dosen Fakultas Ekonomi Universitas Muhammadiyah Ponorogo
A B S T R A C T
Informasi Artikel
Research Objectives “Mapping the Potential of Appropriate Technology for Small and Medium Enterprises as an Effort to Improve the Capability of Technology Readiness in Ponorogo District” is to describe the profile of small and medium enterprises (SMEs), evaluate and measure the level of technological readiness ability (TK2T) of SMEs in Ponorogo District. The analytical tool used is a technometer that serves to measure the level of technological readiness capability used for the production of SMEs divided into three stages, basic (level 1 to level 3), medium (level 4 to level 6) and ready (Level 7 to With Level 9). By using teknometer is expected to provide basic information about mapping the potential needs and the use of appropriate technology (TTG) both tools, processes and production results in Ponorogo regency. SMEs in Ponorogo Regency are dominated in the field of food, handicraft and textile fields. The SME food business unit still requires major government intervention on production process issues. The majority of SMEs business unit in the field of food still use technology (tools) simple and potluck. The production process of SMEs business still neglects the hygienic side of both the production and production. The results of the evaluation and measurement of SME TK2T in Ponorogo District indicate that all samples have passed measurements at level 1 to level 3. Less than 50% pass the middle level ie level 4 to level 6, while less than 10% have passed the top level measurement , Which is level 7 to level 9. This explains that the production of SMEs in Ponorogo Regency still need government intervention both in the use of appropriate technology, as well as supporting indicators such as management, hygiene in production, human resources. Sejarah artikel:
Diterima Agustus 2017 Disetujui September 2017 Dipublikasikan Oktober 2017
Keywords:
Small Medium Enterprises, Teknometer,
Introduction Background
Characteristics of SMEs in Indonesia is to have the endurance to live and have the ability to improve its performance during the economic crisis (Rahmana, 2009). This
is due to the flexibility of SMEs in adjusting
their production process, able to develop their own capital, able to return the loan with high interest and not too involved in bureaucracy (Prasetyo, 2013).
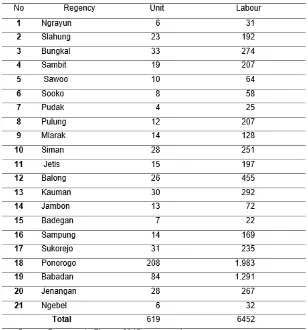
According to the Central Bureau of Statistics of Ponorogo Regency 2015, the number of formal and registered SME units in Ponorogo regency as much as 619 units and absorb 6452 workers with a production value of 734.38 billion rupiah. The business units are spread over 21 sub-districts, and can be described in Table 1 as follows:
In its development to run the pro-duction of small industries, home industries and SMEs rely heavily on the availability
of existing technology, of course with the ability and financial capacity in using the
technology. But production continues to run because it is a source of income for small industries, home industries and
SMEs with existing technology that has
not been able to penetrate markets
out-side the region or export, further impact
is less developed so that the goal to be
more prosperous to less than the maxi -mum results. Basically the use of tech-nology is not solely to be with advanced technology, but using technology-based in-novation frugal able to answer the situation.
One of the efforts in creating busi -ness climate with optimum condition and
Tabel 1.
high competitive product result is analyzed technological readiness level (TK2T). This analysis supports government programs that recognize the importance of rural de-velopment. Various forms and programs to encourage the acceleration of rural de-velopment have been undertaken by the government, but the results are still not
significant in improving the quality of life
and welfare of the community. Besides, the analysis of technological readiness level (TK2T) in line with the spirit of village law in giving birth to an advanced and inde-pendent village can not be done partially. The challenge of building a village will cer-tainly be part of the dynamics of the com-munity in guarding the change in which if the village previously only thought about its own village without much thought and synergy-coordination and communication with other villages or neighboring villages that are geographically close together.
Identification
Consistent implementation of
significant standards by means of good production to produce quality products is
the key to entry to local and global mar-kets and in line with the Master Plan for the
Acceleration of Expansion of Indonesia’s
Economic Development (MP3EI). By utilizing good production method, it is
expected that small and medium en -terprises (SMEs) can build creativity to
produce innovative products of quality
that can compete in the market, and pro-tected their intellectual property. One of the instruments that can be used in
users or potential users. Thus, the purpose
of this study is: (1) Describe the profile of
small and medium enterprises (SMEs) in Ponorogo District, (2) Evaluate and mea-sure the level of technological readiness ability (TK2T) of small and medium enter-prises (SMEs) in Ponorogo District.
Usefulness Research
The usefulness of this research, among others: (1) As reference or reference materials information about the level of readiness of basic resources science and technology measuring TK2T SMEs in Ponorogo regency especially for policy for-mulator, (2) As an input for business actors to evaluate the level of readiness of basic science and technology resources mea-suring TK2T SMEs in Ponorogo District in order to carry out the production so as to increase security guarantee for consumers and able to compete.
Literature Review
ners of the country with the level of tech-nological mastery And a limited economy. Appropriate technology means technology compatible with cultural conditions, and economic conditions and their use must be environmentally friendly.
Technological readiness
(technolo-gy readiness) can be defined as how ready
or mature a technology to be applied. The notion of “readiness” suggests a possible
difference between “ready”, “unprepared”
and “not ready” a technology “or”
techno-logical readiness level “difference to be
utilized or applied for its usefulness TK2T is basically an” indicator “ How ready or mature a technology can be applied and adopted by users / prospective users TK2T can support the assessment of the matu-rity or readiness of a particular technology and the comparison of maturity or
readi-ness between different types of technology
systematically (BPPT, 2010).
Research Methods
The analysis of technological readi-ness ability level (TK2T) for Ponorogo Regency SME is sourced from Ponorogo Central Bureau of Statistics database and synchronized with SME companion report on planning activities, coordination and de-velopment of SME Kabupaten Ponorogo for budget year 2016, conducted by Indus-try, Trade, Cooperative And SME Ponorogo Regency. From the source obtained popu-lation. SME actors are divided into several categories to facilitate the process of sur-vey of SMEs in the district Ponorogo. Re-search Location in general is Ponorogo District which consists of 21 districts.
Data collection methods obtained from primary data and secondary data. For primary data, the sampling process is done by survey, observation and interview. To get the sample is done by One stage Cluster with respondents of SME business actors in Ponorogo District. Sample size on One stage Cluster uses sample size formula as follows:
Keterangan :
n’ = Sampel untuk tahap pertama
(one-stage cluster)
n = Sample for the primary unit no = Sample assumptions d = Sampling error
t = Koefisien Kepercayaan (Coefficient of
-Confidence)
p & q = Parameters of binomial propor -tions
deff = design effect
N = Population for primary units
From the above formula then it can be determined the sample to be surveyed with the following calculation :
N = 619 business unit (primary) d = 0,064
So from the population of 619 units of sam-ple business to be surveyed as much as 123 business units using one stage cluster. As for secondary data comes from other supporting documents that can be referred legally.
Discussion
The determination of technological
field consists of five categories by looking
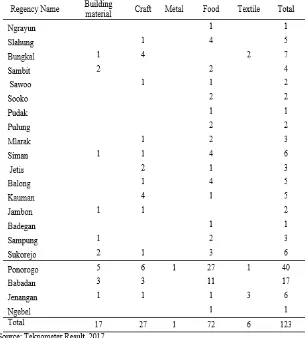
at the basic materials used and or the re-sult of the production conducted by the UMKM business unit. Five categories are building materials, in this category pro-duced products in the form of bricks, lis plafond and various matters related to building materials as the base material.
The second category is handicraft, in which there are products in the form of pillow-cases, bird cage knee, reyog, ganongan, tong and the like. The third category is food, which includes products such as onion chips, soy milk, tempe, salted egg,
hotcakes, chips and brown sugar. The next category is the fourth category is textile
and included in this category is the busi-ness unit of SMEs such as convection and the last is the category of metal, that is all units of SMEs businesses that have pro-duction with metal base materials, such as gamelan and the like.The distribution of
each village in the field of technology can
be seen in Table 2 below.
Table 2.
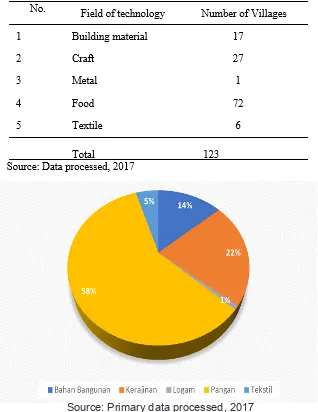
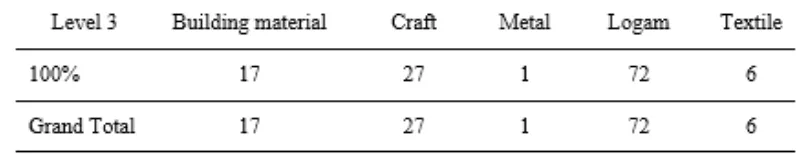
Then when viewed from the field of tech -nology it can be seen the distribution of
each field of technology used as samples in this study. For the field of technology tested most is for food, the next is the field of craft technology, building materials, tex -tiles and metals. More details can be seen in Table 3 below.
The field of food technology has the largest
sample portion of 72 samples or 58 cent, then craft of 27 samples or 22 per-cent, building materials 14 percent or 17
samples, 5 percent textile or 6 samples and 1 sample or 1 percent in the field of
metal technology .
Source: Primary data processed, 2017 Table 3.
Category of Respondents Surveyed by Field of Technology
Graph 2.
Furthermore, for each area of technology
can be explained in detail the following variance. For the field of building materials
technology, a sample of 17 business units with the details as in Table 4 below:
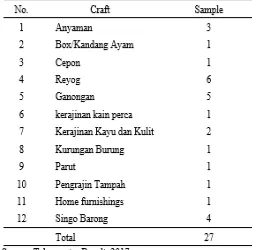
Next is the field of craft technology with a
total sample of 27 respondents from the to-tal sample surveyed can be seen in Table 5 below.
Table 4.
Field of Building Materials Technology SMEs In Ponorogo Regency
Table 5.
Then the metal technology field of 1 sam -ple can be seen in Table 6 below.
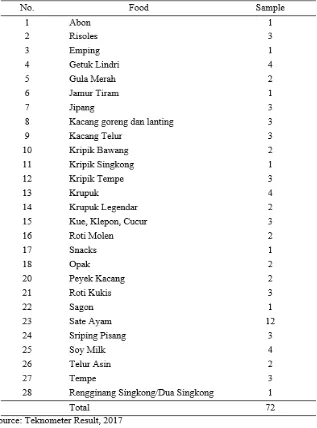
Next is the field of food technology can be
seen business units that become the sam-ple of 72 respondents in Table 7 below.
Table 6.
Field of SME Metal Technology In Ponorogo District
Table 7.
Next is the field of textile technology can
be seen business units that become the
sample of six respondents in Table 8 be -low.
Then from the survey conducted on
123 samples in the next stage is to mea -sure the survey results using TK2T.
Measurements of TK2T per level Measurement Results Level 1
In the 1st level measurement of 123 respondents all met, this shows the lowest level of technological readiness.
At this level there is no need for govern-ment intervention because the pattern in
this level is the requirement of the SME
business unit that should be implemented if it wants to warn its production. The re-sults of these measurements by
techno-logical field can be seen in Table 9 below:
Level 1 for the field of building ma -terials technology using technology that
can be sufficient in the production process,
the technology used tends to buy tools that are ready to use.
Table 8.
Bidang Teknologi Tekstil UKM di Kabupaten Ponorogo
Table 9.
results of these measurements by
techno-logical field can be seen in Table 10 below:
The equipment and systems used
in the UMKM business unit in general have
been identified, although simple. When
viewed from the literature study (theoreti-cal / empiri(theoreti-cal) technology to be developed allows to be applied. Theoretical and
em-pirical designs have been identified. Limi -tation The basic elements of SMEs busi-ness units using technology are known and can be developed. Characterization of technological components used by UMKM business units to be developed has been mastered and understood.
In terms of performance of each constituent elements of technology to be developed has been predicted. Preliminary analysis indicates that the main function
required can work well. Models and simu -lations to test the truth of the basic prin-ciple. Analytical research to test the truth of its basic principles. The technological components to be developed, separately
can work well. The equipment used must be valid and reliable. Known experimental
stages to be performed.
Measurement Results Level 3
Research and development are actively initiated although not realized by SMEs business units, but not at the level of analytical studies and laboratory studies to physically validate the analytical pre-dictions about the separate elements of
the technology. Examples such as com -ponents that have not been integrated or represented.
Analytical studies support the pre-diction of the performance of technologi-cal elements have been done by through production testing on SMEs business unit. Characteristics / nature and capacity of ba-sic system performance has been
identi-fied and predicted, but laboratory experi -ments have not yet been conducted to test the feasibility of applying the technology, usually directly conducted its own trial. The test is done with model and simulation supporting prediction ability of technologi-cal elements by UMKM business unit. The results of these measurements by
techno-logical field can be seen in Table 11 below:
Table 10.
Measurement Results Level 2
Table 11.
However, if the development of
such technology with the first step using a
mathematical model is very possible and can be simulated. Theoretically, empirical
and experiments have been known com -ponents of the technology system can work well although not yet done research in the laboratory using dummy data Technically feasible technology (analytical studies,
models / simulations, experiments).
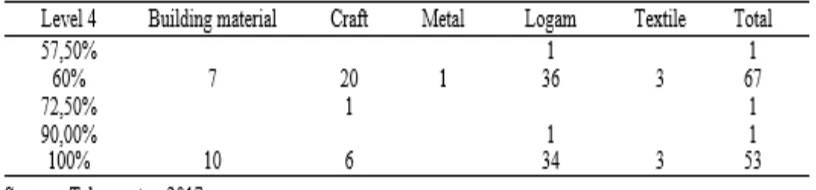
Measurement Results Level 4
The fundamental technological components are integrated to ensure that they work together. This situation still has a relatively low reliability compared with the end system. The results of these
measure-ments by technological field can be seen in
Table 12 below:
Complete laboratory test of com-ponents has been done, this test occurs because the business unit of SMEs using technology already available in the market so that the technology has been through the test phase by technology manufacturers
(tools). System requirements for apps by
user are known (adopter wish). The results
design has been completed (low fidelity).
Of the samples in this level 4 measurement, 68 samples have passed the measurement
indicators, three from the field of building materials technology, five from handicrafts, fifty-eight from food and two from textiles.
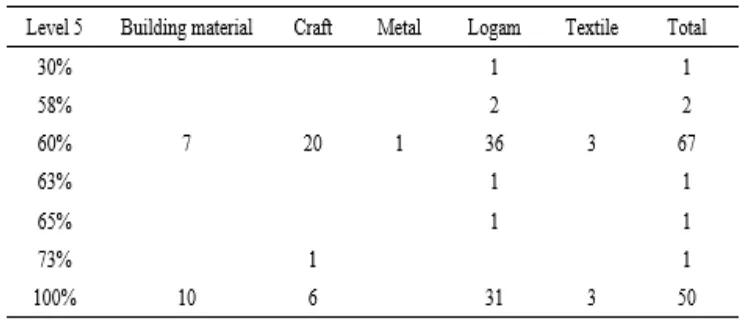
Measurement Results Level 5
The reliability of the integrated technology (breadboard technology)
in-creased significantly. The fundamental
technological components are integrated with realistic supporting elements so that
the technology can be tested in an artificial / simulated environment. Examples include
the integration of components in laborato-ries that already have high reliability (‘high
fidelity’). below:
Preparation of hardware produc-tion has been done. Market research (marketing research) and laboratory re-search to select the fabrication process.
The prototype has been made equipment
and supporting machine has been tested in the laboratory The integration of the sys-tem is completed with high accuracy (high Table 12.
Measurement Results Level 6
Research and development are ac-tively initiated. This may involve analytical studies and laboratory studies to physically validate the analytical predictions about the separate elements of the technology. The results of these measurements by
techno-logical field can be seen in Table 14 below:
The actual operating environment
conditions have been identified. Invest
-ment require-ments for equip-ment and manufacturing processes are identified M
& S for the performance of technology syst
ems in the operating environment. The manufacturing / manufacturing department approves and accepts lab test results. The prototype has been tested with high
accu-racy / lab fidelity in simulated operational
environments (which are actually outside the lab). Test results prove technically fea-sible (engineering feasibility).
Measurement Results Level 7
The prototype is approaching or in line with its operational system plan. This
situation reflects the developmental step of TKT / TRL 6, requiring demonstrations
Table 13.
Measurement Results Level 5
Table 14.
of real system prototypes in an operational environment. The results of these
mea-surements by technological field can be
seen in Table 15 below:
Tools, processes, methods and engineering
designs have been identified. The process and fabrication of equipment begins to be piloted. Test equipment and process equipment and equipment are tested in
the production environment. Draft design drawings are complete. Tools, processes, methods and engineering designs have been developed and started to be piloted. Scale scale has been completed. The es-timated cost estimate has been validated (design to cost). The fabrication process in general has been well understood. Almost all functions can run in the environment / operating conditions. Complete prototypes have been demonstrated in simulated operational environments. The system
prototype has been tested on field trials.
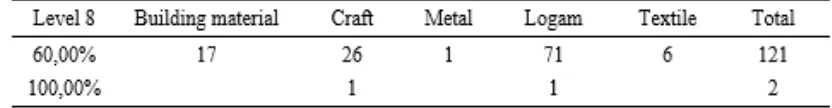
Measurement Results Level 8
Technology has proven to work
/ function in its final form and in the con
-ditions as expected. In general, this TKT reflects the end of the actual system
development.
The shape, suitability and func-tionality of components are compatible with the operating system. Machinery and
equipment have been tested in a produc -tion environment. Final chart completed. The fabrication process is pilot-tested (pi-lot-line or LRIP). The fabrication process test shows acceptable results and levels of productivity. The test of all functions is done in the simulation of the operating
environment. All materials and equipment
are available for use in production. System
qualified through test and evaluation (DT
& E completed). Ready for full scale pro-duction (full capacity). The results of these
measurements by technological field can
be seen in Table 16 below: Table 15.
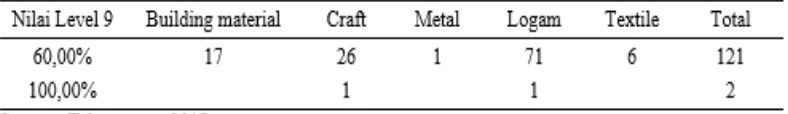
Measurement Results Level 9
Technological application
(appli-cation) of technology in its final form and
under intended conditions (planned) as in operational testing and evaluation. In general, this is the last part / aspect of the
bug fixing in the development of the actual system. Examples include for example the
utilization of the system under operational mission conditions. The results of these
measurements by technological field can
be seen in Table 17 below:
The operational concept has been perfectly applicable. Estimated technology
investments have made no significant de -sign changes. Technology has been tested on the actual conditions of productivity at a stable level all documentation has plete estimates of production prices com-pared to known technology competitors. In the measurement of TK2T to business units up to level 4 is already below 50 per-cent of the total sample of SMEs that are not eligible. From this measurement can
be explained that the average unit of SME
business is still on the use of appropriate
technology based on experience in pro
-ducing it can be seen in the field of food
technology.
Most SMEs basically have the technology used to increase their produc-tion capacity, such as the producproduc-tion
pro-cess of emping using rectangular and flat
stone, and emping-forming hammer. Such technology is not a category of appropriate technology but included in the category of community technology, the tool used is a
tool that is created or modified in such a
way that has a function to facilitate SMEs
in the production process. This community
technology exists because of the ability and capacity of people in finding solutions
to technological problems, although
sim-ple, aimed at efficiency and effectiveness
of production.
The government’s attention in im -proving the production capability of the SME business unit is still indispensable, when referring to the measurement re-sults. As an illustration of the sample sur-veyed for the production of brown sugar,
this sample is discussed because Ponorogo Regency has abundant natural resource potential and one of the dominant business units is the sugar business unit.
Conclusion
Although in the measurement of business units of SMEs have reached the basic stage but there needs to be follow-up in improving the results of its production so that in the process of measurement get a good value. Follow-up from level 1 to 3 measurements is (1) The need for
identi-fication of the type of technology applied both to raw materials, production equip -ment, production processes or production results whether in the category of commu-nity technology or appropriate technology.
These efforts can be done by establishing
partnerships with relevant stakeholders to build synergistic SME products, (2) In the form of community technology, it can still be used because the technology is part of local wisdom, which departs with the ability and capacity of SMEs in increasing production through the creation of the technology they own, (3) Appropriate tech-Table 15.
nology needed in accordance with the needs of SMEs business unit can be done in coordination with Ministry of Re-search and Development institutions and Non-Ministry, SOEs, Higher Education, so that technology can really be utilized, (4) Implement the function of “partnership implementation activities” (implementing partners) with the sharing of organizational resources, because in the measurement
there is the same technological field but
the measurement results there are better, so it is possible to transfer technology that is used with mediated and facilitated by the government.
Then some SME business unit that has passed the intermediate level between levels 4 to level 6, it is necessary
to do follow-up in order to produce maxi -mum value in the measurement that can then continue up to the last measurement level. Follow-up from level 4 to 6 measure-ments are: (1) Technical and economic considerations, whether the appropriate technology products or that have been
pro-duced by R & D can be made by fulfilling the balance / equality between the tech
-nical requirements required by economic
terms or simply by using community tech-nology already available, if the community
technology is sufficient Need to be done is
coaching on the level of supporters, such as management, post-production and hu-man resources, (2) Establish partnerships that can be categorized into two groups: (2A) Partnership implementation activi-ties (implementing partners), still needed a closer collaboration to build the synergy
Reference
Anonim. 2010. Kajian Tingkat Kesiapan Teknologi (TRL, Technology Readiness
Levels). Jakarta: Badan Pengkajian
dan Penerapan Teknologi.
. 2012. Sambutan Menteri Negara Riset Dan Teknologi pada Inovasi Frugal: Tantangan Dan Peluang Penelitian Dan Pengembangan Serta Bisnis Di Indonesia Forum Pengembangan Ilmu Pengetahuan, Teknologi, dan Inovasi
(Iptekin) Nasional Kedua. Pappiptek
LIPI. 10 Oktober 2012.
Badan Pusat Statistik. 2015. Statistik Daerah
Kecamatan Ponorogo 2015. Arsip
Dae-rah: Badan Pusat Statistik Kabupaten Ponorogo.
Bhatti, Y., dan Ventresca, M. 2011. The emerging market for frugal innovation:
fad, fashion, orfit?. Working Paper.
Dinas Industri Perdagangan Koperasi dan UKM Kabupaten Ponorogo 2016.
Pendataan Pelaku UKM Dinas Industri Perdagangan Koperasi dan UKM Kabu-paten Ponorogo Tahun Anggaran 2016.
Arsip Daerah: Tidak Dipublikasikan.
Hayati, Amelia. 2008. Pemberdayaan Kekuatan Ekonomi Perempuan
Indo-nesia Orientasi Pembauran Bangsa.
Bandung: BKBPMD Provinsi Jawa Barat.
Kaplinsky, R. 2011. Schumacher meets Schumpeter: Appropriate technology
below the radar. Research Policy vol.
Analisis Tingkat Kemampuan Kesiapan
Teknologi (TK2T). Riset Unggulan
Daerah. Kebumen. Badan Penelitian Pengembangan Provinsi Jawa Tengah.
Rahmana, A. 2009. Peranan Teknologi Informasi Dalam Peningkatan Daya
Saing Usaha Kecil dan Menengah,