Analyzing the velocity of urban dynamic over
Northeastern China using DMSP-OLS night-time lights
Yuke Zhou
Key Laboratory of Ecosystem Network Observation and Modeling, IGSNRR, CAS, Beijing, China [email protected]
Abstract: Stable night-time lights (NTL) data from the Defense Meteorological Satellite Program Operational Line-scan System (DMSP-OLS) can serve as a good proxy for anthropogenic development. Here DMSP-OLS NTL data was used to detect the urban development status in northeastern China. The spatial and temporal gradients are combined to depict the velocity of urban expanding process. This velocity index represents the instantaneous local velocity along the Earth’s surface needed to maintain constant NTL condition, and has a mean of 0.36km/yr for northeastern China. The velocity change of NTL is lower in the urban center and its near regions, and the suburbs show a relatively high value. The connecting zones between satellite cities and metropolis have also a rapid rate of NTL evolution. The dynamic process of urbanization over the study area is mainly in a manner of spreading from urban cores to edges. The rank size of the velocity for the prefectures is analyzed and a long tail distribution is found. The velocity index can provide insights for the future pattern of urban sprawl.
Night-time lights; northeastern China; velocity; urban sprawl
I. INTRODUCTION
As rapid social and economic development in China, the current urban extent will be rearranged over the campact districts with human activity. The northeastern region in China is a hotspot for both government and scholars are focusing on its economic development condition in the decades. Its economic revitalizing plan and population migration to other regions are attracting close attentions. Luminosity data from earth surface has been used as a proxy for economic statistics. Night-time light data acquired by the Defense Meteorological Satellite Program Operational Line Scan System (DMSP-OLS) instrument, available since 1992 have been applied extensively to study various urban landscape characteristics [1]. The DMSP-OLS nighttime images have been proved to be a cost-effective tool for large-scale human settlement and dynamic mapping [2]. It is still needed to detect the urban sprawl pattern combining spatial and temporal information from NTL.
The saturation and blooming effect of DMSP-OLS brightness affect its application on measurement of urban dynamic. The straight forward use of raw NTL data will overestimate the urban regions. Due to the variety of urbanization patterns, no empirical brightness threshold is widely applicable for extracting urban areas to precisely match the actual boundary of urbanized areas [3]. To summarize the speed of change in urban area, we compute the instantaneous horizontal velocity of NTL change derived from the ratio of temporal and spatial gradients of mean annual NTL value.
II. DATA AND METHOD
A. DMSP-OLS night-time lights and data processing
The night-time lights (NTL) imagery used in this paper was obtained from the U.S. National Oceanographic and Atmospheric Administration (NOAA), which is derived from the Operational Linescan System (OLS) aboard the Defense Meteorological Satellite Program (DMSP) satellites. The DMSP-OLS data is at a spatial resolution of 700m under the
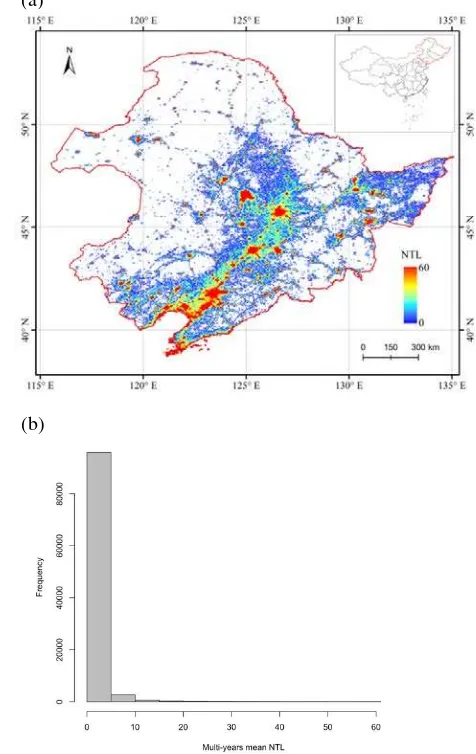
WGS84 coordinate system, covering the time range from 1992-2012. One year has one NTL image composited from multiple observations to represent the stable light for this year. More detailed information for data acquiring and processing is linked to references [4]. In the northeastern China, the NTL value ranges from 0 to 60 (Figure 1). The spatially averaged NTL value for the multi-years mean over the study region is 0.76.
The DMSP-OLS data is acquired from different sensors. And to reduce the data variation, we performed an inter-calibration for the radiance lights using the method from Elvidge et al [5]. From the literature, it is verified the calibrated NTL DN value is a quadratic function of raw DN value (Equation 1). The coefficients a, b in Equation.1 are calculated for the NTL imagery from different satellites by choosing the regions with stable radiance lights as calibration regions [3].
������������= a × ��2 + b ×��+ c (1)
Where DN is the original DN value, DNcalibrated is the
inter-calibrated DN value, and a, b, and c are coefficients.
B. NTL velocity
NTL data is commonly used in the urbanization process studies from regional to continent scale. Both spatial and temporal pattern of urban sprawl are the research key points depicted in the literature. It is a need to combine the spatial and temporal information together to characterize the urban dynamic. Here, we present an velocity index of NTL change (km/yr), derived from spatial gradient (NTL/km) and the temporal linear trend of NTL for 21 years (NTL/yr). This index is inspired by the global climate change velocity for vegetation activity [6].
���
��������=
��������������� �������� �����(2)
�� ��
�
=
������ �����
�
(3)
National Natural Science Foundation of China (2016, Grant No.41601478), National Key R&D Program (2016YFC0500103), the open fund of State Key Laboratory of Resources and Environment Information System (LREIS, 2016).
The International Archives of the Photogrammetry, Remote Sensing and Spatial Information Sciences, Volume XLII-2/W7, 2017 ISPRS Geospatial Week 2017, 18–22 September 2017, Wuhan, China
This contribution has been peer-reviewed.
(a)
(b) Where the temporal trend is derived from the slope of linear
regression between NTL time series and the corresponding years for each pixel. The pixel with trend that pass the 0.05 significant level test is used for the velocity calculation, otherwise is excluded.
The spatial gradient for each pixel in NTL image is calculated as Equation.4. We chose a template for 3*3 to calculate the gradient for the central pixel, which will be impacted by its eight neighbors.
�
(
�
,
�
) =
��
�2(
�
,
�
) +
�
�2(
�
,
�
)
(4)
Where g(i, j) is the spatial gradient for pixel with the x, y axis coordinate (i, j). dx and dy are horizontal direction and vertical direction convolution kernel, respectively, determined as following Equation.5.
dx kernel is used to detect horizontal gradient, and dy kernel is used to detect vertical gradient. The central pixel gradient is affected by its neighbors, but varying among their distances. The closer neighbor is assigned to a bigger weight. For example, in dx kernel matrix, central pixel’s horizontal neighbors have a weight of 2 or -2, and neighbors on diagonal line is weighted by 1 or -1. It is the same as the dy matrix. Following procedure computed the gradient for central pixel through NTL values multiplying horizontal and vertical kernels (Equation 4).
III. RESULTS
A. Spatial pattern of NTL trends
According to mulitple years mean of NTL, 35.7% of the area in northeastren China is litted by artificial light (around 442085 square kilometers), see Figure 1. There is a obvious megalopolis, spaning from southwestern coastal regions to the northeastern Harbin city. The eastern region also distribute some small cities (Jiamusi, Hegang, Shuangyashan., etc) to form a urban agglomeration. The north and west of the study area are mostly covered with natural vegetation. There are many small towns linked as a dash line, which is actually the road networks connecting the towns. This phenomenon is directly reflected by the NTL signal from the streetlights. From the aspect of light intensity, depicted by the histogram in Figure 1b, most of the NTL values fall in the interval 0-10, indicating the relatively low level urban development for this region. Although the NTL data value is saturated and blooming at the edge of urban, which may be overestimate the radiance light value for urban area, the spatially averaged value 0.76 and the histogram (Figure 1b) can demonstrate the small percentage of highly developed urban regions for the overall northeastern China.
With regard to the long term trend of NTL evolution, pixel level NTL temporal gradient was computed as the slope of a linear model fit through each year of the time period of interest, at the 5% significance level (Figure 2). The spatial pattern is similar to that of mulitple years mean NTL, and the main key
cities show a significant increase trend of NTL. But there are rare regions experienced a rapid urbanization process, which can be seen from the red area in Figure 2a. The histogram also show that most of the NTL trend increase ratio is between 0-1.
B. Spatial pattern of NTL velocity
Based on the spatial and temporal gradients, we calculated
the velocity of NTL for northeast China (Figure 3).
The spatially averaged velocity for northeast China is 0.36km/yr, with the standard deviation of 0.37km/yr. Compared with the spatial pattern of multi-years mean of NTL, the spatial distribution velocity cover a less area because the 5% significance level of NTL slope filter out the areas where are covered by the blooming light. The urban cores could be clearly seen as deep red points in the velocity map, surrounded by the light red or yellow color that presenting higher velocity. For velocity, the majority of the cities show a spreading pattern from higher value in city center to lower value in suburb. In contrast, there are some pixels displaying a minus value of velocity. That is caused by the decreasing slope of long term Figure 1. multi-years mean of night-time lights in northeastern
China.
The International Archives of the Photogrammetry, Remote Sensing and Spatial Information Sciences, Volume XLII-2/W7, 2017 ISPRS Geospatial Week 2017, 18–22 September 2017, Wuhan, China
This contribution has been peer-reviewed.
(a)
(b)
Figure 2. NTL temporal trend (a) and the histogram (b). trend for the NTL, indicating the normally human activity change dynamic. The NTL may be disappeared gradually owing to the economic recession, such as the close of large enterprise, population migration to other regions. It could be observed that these negative velocity regions located in the suburbs or the small cities which usually are sensitive to human activity.
From the detailed velocity map for the main urban agglomerations in study regions (Figure 5), the hollow hole in the urban core can be clearly observed, due to its insignificant trend of NTL. Shenyang agglomeration and Shuangyashan have more decreasing velocities areas than Harbin and Changchun. Harbin and Daqing are approaching to agglomerate together. And this region has more high velocities, displayed by the pink color. Changchun and Jilin, the two
biggest cities in Jilin province, do not have a direct link zone between them. Shenyang, Liaoyang and their neighborhood cities are connected to construct an urban agglomeration. Shuangyashan megalopolis is composed of several small cities, which is distributed independently.
Figure.3 the velocity for northeastern China. The velocity unit is km/yr.
C. The rank size for prefecture level velocity
1 Harbin Suihua Changchun Jiamusi Daqing Hulun Buir 7 Shuang
yashan
QiQihar Chaoyang Chifen g
Jilin Songyuan
Figure 4. The rank size distribution of prefecture level velocity and the top 12 cities.
From Figure 4, we can see that the rank size of NTL velocity at prefecture level city follow a long tail pattern distribution. This phenomenon demonstrates that several big cities control the high velocities. But the top ranked cities are not all the four famous urban areas shown in Figure 5, implying that big cities have been highly developed and harder to show more change in the NTL velocity. While the second level cities, e.g., Suihua, Jiamusi, may be developed rapider than the old big cities.
0 2000 4000 6000 8000 10000 12000 14000 16000
0 10 20 30 40
V
e
loci
ty
Prefecture rank
Prefecture Velocity SUM
The International Archives of the Photogrammetry, Remote Sensing and Spatial Information Sciences, Volume XLII-2/W7, 2017ISPRS Geospatial Week 2017, 18–22 September 2017, Wuhan, China
This contribution has been peer-reviewed.
Figure 5. the NTL velocity for main urban agglomeration . a, Harbin. b, Changchun-Jilin. c, Shenyang. d, small cities such as Shuangyashan, Qitaihe.
IV. CONCLUSION
The velocity index, which combines spatial and temporal gradients information from NTL time series, is applied to detect the human activity intense in the artificial lit area. Although there is an obvious expansion of the urban areas over the last two decades, the urban development activity in northeastern China is not very intense, representing by the low velocities of stable lights change. Relatively small velocities are required to keep pace with the rate of nighttime light change in the urban cores, due to its high and stable development status. The suburb areas are required high velocities for the rapid land cover change from natural land to built-up area. The rank size of prefecture level velocity follows a long tail distribution, indicating that several big cities account for the majority of the high velocities.
REFERENCES
[1] Henderson M, Yeh E T, Gong P, et al. Validation of urban boundaries derived from global night-time satellite imagery[J]. International Journal of Remote Sensing, 2003, 24(3): 595-609.
[2] Imhoff M L, Lawrence W T, Stutzer D C, et al. A technique for using composite DMSP/OLS “city lights” satellite data to map urban area[J]. Remote Sensing of Environment, 1997, 61(3): 361-370.
[3] Li Q, Lu L, Weng Q, et al. Monitoring urban dynamics in the southeast USA using time-series DMSP/OLS nightlight imagery[J]. Remote Sensing, 2016, 8(7): 578.
[4] Defense Meteorological Satellite Program.
https://ngdc.noaa.gov/eog/dmsp.html.
[5] Elvidge C D, BAUGH K, HOBSON V, et al. Satellite inventory of human settlements using nocturnal radiation emissions: a contribution for the global toolchest[J]. Global Change Biology, 1997, 3(5): 387-395. [6] Loarie S R, Duffy P B, Hamilton H, et al. The velocity of climate
change[J]. Nature, 2009, 462(7276): 1052-1055.
The International Archives of the Photogrammetry, Remote Sensing and Spatial Information Sciences, Volume XLII-2/W7, 2017 ISPRS Geospatial Week 2017, 18–22 September 2017, Wuhan, China
This contribution has been peer-reviewed.