Automatic Indentification System (AIS) Decode Design for Ship
Monitoring using Labview Software
Didi Istardi, Ardian Budi K.A.,a,* , Nur Sakinah Assad b , and Hendra Saputra,c
a)Mechantronics Study Program, Electrical Department, Politeknik Negeri Batam, Batam, Indonesia
b)Manufacturing of Microelectronics Study Program, Electrical Department, Politeknik Negeri Batam, Batam, Indonesia
c)Ship Design and Construction Study Program, Mechanical Engineering Department, Politeknik Negeri Batam, Batam, Indonesia
*Corresponding author: [email protected]
Paper History
Received: 15-November-2013
Received in revised form: 20-November-2013 Accepted: 22-November-2013
ABSTRACT
The AIS (Automatic Identification System) is used for monitoring ship traffic in the Singapore Strait. The AIS system is automated tracking system that was used in ship industry. The system consists of hardware that functions as AIS data receiver and AIS decode software developed with LabVIEW programming language. The system visualizes real-time coordinates of ships (longitude and latitude) to google maps. The method of decoding from AIS data onto ship data consists of 3 stages. Firstly, AIS data with char data type is converted to decimal. Secondly, decimal data is converted to binary and mirrors binary data results. Lastly, binary grouping according to ITU Recommendation M.1371 and binary grouping conversion with MSB reading to decimal are done. Results from the AIS system are: decoded MMSI, navigation status, Rate of Turn (ROT), ship speed, ship position (Longitude and Latitude), Course over Ground (COG), True Heading (HDG), Time Stamp, RAIM flag and Radio status. The accuracy of the system is 99.61%.
KEY WORDS: AIS systems, Labview, Decode, receiver,
tracking.
NOMENCLATURE
API American Petroleum Institute
Temperature Difference in and out
Thermal Expansion Anchor Length Expansion Pressure Force Friction Force
Design Compressive Strain Critical Strain
1.0 INTRODUCTION
The AIS is an automated ship tracking system and ship traffic service identification system. Vessel Traffic Services (VTC) is used to identify and send or receive information. There are two types of data received. Firstly, the data received is electronic data exchange with another ship nearby, BTS AIS, and satellite. The other is the ship transmit data directly. The ship data information that was taken from vessel, were Maritime Car Service Identity (MMSI), speed of ship (Speed over ground), ship position (longitude and latitude), Navigation Status, Course over Ground (COG), and others. The data information was recorded by AIS every 2 until 10 seconds. This duration is depending on the speed of the ship [1,2].
AIS is required by the International Maritime Organization (IMO) of the International Convention for the Safety of Life at Sea (SOLAS) that effective since 31 December 2004 for all cargo ships with Gross Tonnage (GT) more than 300 GT on international shipping, All cargo ships above 500 GT, and all passenger ships regardless of size [3]. The AIS tracks ship positions automatically. The vessel traffic service (VTS) can be identified and located ships with electronic media data exchange with other nearby vessels [4-5].
ships [6]. According to such a condition, this paper develops the AIS system for the Singapore Strait vessel monitoring system. The AIS system consists of AIS receiver, signal capture antenna, data storage system, and stored AIS message translator application. The AIS systems can be seen in Figure 1 [6,7].
Fig. 1 the AIS Data system
The design of antenna based on the research by [8,9]. There are also another method in method that was implemented by [10]. The data that was received by the AIS station can be process using different tools [11-13]. This paper was implemented this process using Labview software and hardware to monitor the ships that it is still new in this area.
The paper is organized as follows: In the next section, a brief review of decode and data mining are presented. In Section III presents design AIS system using Labview. The next section discuss about the result of the system after implementation. Finally, the conclusions are made in section V.
2.0 DECODE AND DATA MINING
2.1 Data Mining in AIS Systems
AIS data is binary code that can be extracted using ITU M.1371-2 standard. Standard NMEA uses two sentences AIVDM (Accepted Data from other vessels) and AIVDO (ship own information). In this paper use AIVDM.
The receiver data get data in the ASCII type using NMEA 0183 data format. Binary code that was contained in NMEA messages uses 6 bits or 8 bits. The ASCII format has been defined in IEC-PAS 61162-100 standard, "Maritime navigation and radio communication equipment and systems". The AIS message that use ITU and ASCII standard can be seen in Table 1:
Table 1: AIS Decode Message
Bit Length Comments
60-60 1 Position Accuracy
61-88 28 Longitude
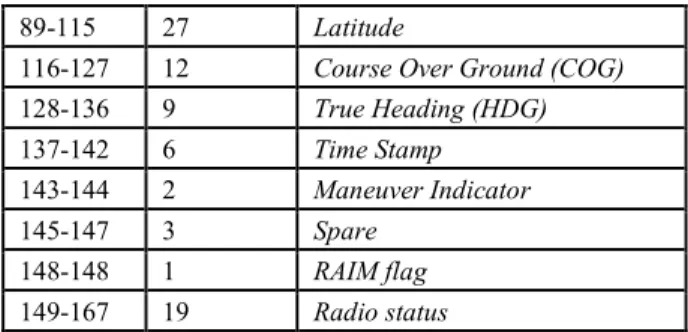
89-115 27 Latitude
116-127 12 Course Over Ground (COG)
128-136 9 True Heading (HDG)
137-142 6 Time Stamp
143-144 2 Maneuver Indicator
145-147 3 Spare
148-148 1 RAIM flag
149-167 19 Radio status
The decode process is very long with the basic conversion that must recognize the character types on the original data and binary data. The data types that was used in the decoding process are char data types as input data, ASCII data type, decimal data type, and binary data type. The decoded process can be seen in Figure 2.
Data AIS !AIVDM,1,1,,A,15?:4d001D7LE:R0fF8::89L00S;,0*59
Char to binary conversion : Char 1 => 000001 biner
5 => 000101 dll Mirror Binary Data at every char
Char 1 => 000001 => 100000 5 => 000101 =>101000
dll Combine all Binary data
101000 100000 Char 5 dan 1
Binary value classification to Ship data Message Type = bit 0-5 => 100000
Repeat Indicator = bit 6-7 => 00 dll
Binary data to decimal (MSB) conversion Message Type =100000 => 1
Repeat Indicator = 00 => 0 Data separation in 6 section
1. !AIVDM
Fig. 2 The decoded process block diagram
This step was done using The LabVIEW program that processed data from raw data. The data will be extracted in time and date that recorded into text file.
2.2 ASCII to Biner Conversion
The Char data type is converted into ASCII data. After that, the data converted into decimal with 6 bit binary. The reference char that was used in the conversion is AIVDM/AIVDO Protocol Decoding shown in Table 2.
Table 2: Char Data conversion, ASCII, Decimal, and Biner Char ASCII Decimal Bits Char ASCII Decimal Bits Char ASCII Decimal Bits
Table 3: Conversion process of Char to 6 bit Binary at on position Na viga tion Sta tus
Rate of Turn
0 351438000 0 1 Desimal
84 0
Table 3 represents the conversion of data from char to binary with decimal results.
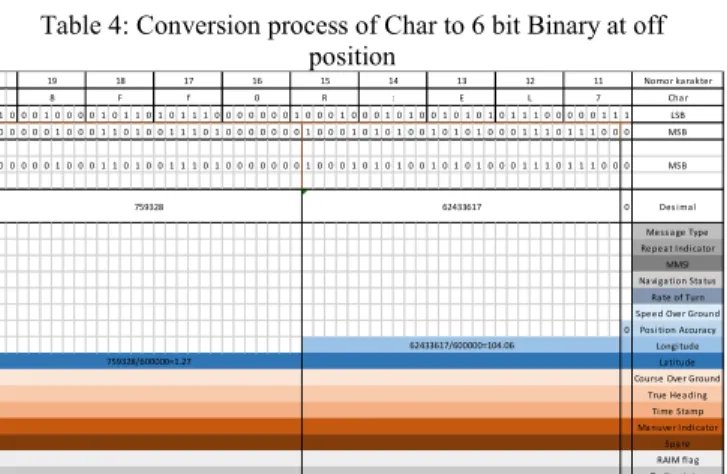
Table 4: Conversion process of Char to 6 bit Binary at off position
The Table 4 obtained the ship data Position Accuracy, Longitude, and Latitude.
Table 5: Conversion process of Char to Binary in 6 bit (result) Nomor karakter
3.0 DESIGN AIS DATA RECEIVER USING LABVIEW SOFTWARE
The design of software was follow the flow chart in Figure 2. The AIS Receiver program records data in NMEA Message 0183 data. There are two option in duration of storage data; a minute or an hour. The data was filtered based on MMSI data. The MMSI filter data was displayed in front panel display at LabVIEW.
Start
Write data AIS, data decoded and data filter
to file .txt data filter to file .txt
Make new file .txt
Write data AIS, data decoded and data
display 1 MMS data into google map
Fig. 2 Flow Chart Program LabVIEW
There are three stages to decode the raw AIS data into ship data; separating AIS Data Section encoded, dividing AIS Data per character, and converting binary into ship data.
3.1 Separating AIS Data Section Encoded
The program separate the characters by its structure using the comma "," sign. The process is shown in Figure 3.
Fig. 3 Character division of AIS Data
It can be seen that the AIS data is divided in 6 data. The result can be found in bit 5 that contains character data ("15?: 4d001D7LE: R0fF8 :: 89L00S;",).
3.2 Dividing AIS Data per Characters
the character data to binary conversion. The program can be seen in Figure 4.
Fig. 4 Decoding sub-program
3.3 Binary to Ship Data Conversion
The binary to ship data conversion is done by MSB method (reads starting from left) that can be seen in Figure 5. The conversion change bits 8 to 37.
Fig. 5 The Binary to ship data conversion in Labview
Figure 4 shows the repeat indicator that generate the value of the Type Message ship data. This sub program can convert binary to decimal data with 6 character. The character in Repeat Indicator take in address bit number 6 and 7 for ship data. The third is the MMSI data ship with a length of 30 bits starting from address bit number 8 to 37. The bit is converted to decimal number. Data number 4 is the Navigation Status starting from the 38th bit shown in Figure 6.
Fig.6 Case Structure Program Navigation Status
Navigation status is a vessel data showing the activity of the vessel, whose 38th bit to the 41st bit as shown in Figure 6. The fifth vessel data is a Rate of Turn which has an 8 bits length and starts from the 42th bit as shown In Figure 7.
Fig. 7 Case Structure Program Rate of Turn
The Rate of Turn data have 8 bits. The box in the right can control the direction of rotation the ship. The Speed over Ground (SOG) data of the ship can be seen in Figure 7.
The SOG data take 10 bits length (50 to 59).
Fig. 7 Case Structure Program Speed over Ground
The next data that was be taken from AIS is the accuracy. The accuracy only have two condition; accurate or error.This can be shown in Figure 8.
Fig. 8 Case Structure Program Accuracy
This data consist a bit only at address bit 60. The position data of the ship addresses in longitude and latitude. The programs can be seen in Figure 9.
Fig. 9 Case Structure Program longitude and latitude
Longitude and latitude is the coordinates of the ship based on the map. The longitude coordinates use address bit 61 with data length 28 bits and the latitude coordinates use bit number 89 with 27 bits data length. The next ship data is the Course over Ground that can be shown in Figure 10.
Fig. 10 Case Structure Program True Heading
the intensity of message delivery on each ship.
The next data is Maneuver Indicator shown in Figure 14. The data length are 2 bits (143-144). This data informs the condition of ship maneuver; 0 is Not Available, 1 is No special maneuver, and 2 is special maneuver.
Fig. 11 Case Structure Program Timestamp
Fig. 12 Case Structure Program Maneuver Indicator
The results of the 16 vessel data are then displayed to the LabVIEW Front Panel program so that it can be read by the user shown in Figure 13.
Fig. 13 Front Panel Decode LabVIEW
While the overall appearance of the program for AIS data storage and decoding process is shown in Figure 14.
Fig. 14 AIS data storage in SoftwareAIS Receiver
Fig. 15 Database AIS before Decode
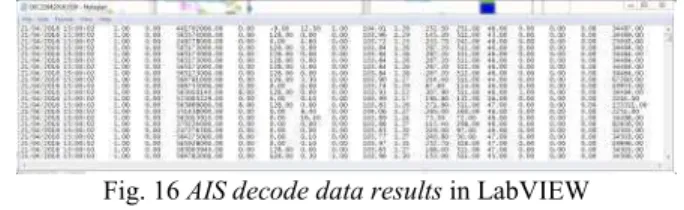
In Figure 14 and Figure 15 show an AIS software receiver, where the AIS data in NMEA Message 0183 data format and the decoded data NMEA Message 0183 in actual ship was filtered based on MMSI. This result can be shown in Figure 16.
The result data included MMSI data, navigation status, Rate of Turn (ROT), ship speed, position Ships (Longitude and Latitude), Course Over Ground (COG), True Heading (HDG), Time Stamp, RAIM flag and Radio status. The next process is plotting the data into google maps.
Fig. 16 AIS decode data results in LabVIEW
The location of the research is in Batam Island that can be seen in Figure 17.
Fig. 17 AIS decode data results in LabVIEW The red dots are the place are the AIS system that was installed.
4.0 RESULT AND DISCUSSION
Fig. 18 Decode AIS data Result (NMEA message) This coordinate test is a test of longitude and latitude of the position of the ship detected. This test compares the results of the system that was created with google maps and also marine traffic. Method of retrieval and comparison of data obtained is started from the data retrieval system in the form of data MMSI, longitude and latitude which then plot into google maps and compare to the truth or the accuracy of the data obtained then the data obtained results compared with the comparison data (coordinates) on Marne traffic. A total of 20 data were retrieved and compared with comparable marine traffic data and the results of those comparisons are shown in Table 6.
Table 6 Data comparison between real and simulation
From Table 6, the error the system can be calculated by
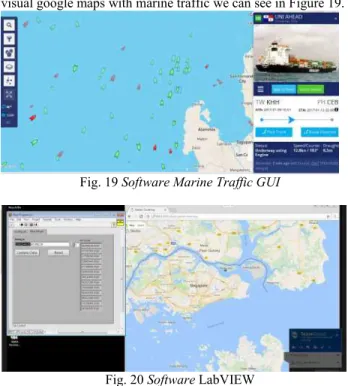
The error rate is 0.39% with so the accuracy of this research is 99.61%. Comparison of these coordinates when viewed from the visual google maps with marine traffic we can see in Figure 19.
Fig. 19 SoftwareMarine Traffic GUI
Fig. 20 Software LabVIEW
To know the point of coordination on marine traffic then the MMSI is copied to the search map section and then the data base on marine traffic reads and shows the ship's coordination with the destination MMSI so that on the left Figure will show the identity of the ship and the coordinates of the ship. In Figure 20 is a google map system for plotting vessels with the identity of MMSI, latitude and longitude. So to bring the coordinate on google maps then required the identity of the ship in the form of MMSI, latitude and longitude then the update data button to do plotting to google maps and reset to eliminate plotting on google maps in the Figure 20 right.
5.0 CONCLUSION
The AIS (NMEA message) data can be decoded using LabVIEW software into ship data such as MMSI, navigation status, Rate of Turn (ROT), ship speed, ship position (Longitude and Latitude), Course Over Ground (COG), True Heading (HDG), Time Stamp, RAIM flag and Radio status.
The AIS receiver consist vertical antenna tool as receiver frequency and mini PC as data recorder tool. The accuracy of the AIS System is 99.61% in monitoring ship in Singapore Strait.
ACKNOWLEDGEMENTS
The authors would like to convey a great appreciation to Politeknik Negeri Batam for supporting this research.
REFERENCE
[1] International Telecommunication Union, ITU-R Recommendation
automatic identification system using time division multiple access in the VHF maritime mobile band.
[2] Kojiro Hata, Kazuhiko Hasegawa, Kazuhisa Niwa, Hiroyuki
Fukuda. 2006. AIS Simulator and ITS Application.
[3] Intenational Maritime Regulataion (IMO) Resolution A.917(22).
2001. Guidelines For The Onboard Operational Use Of Shipborne Automatic Identification Systems (AIS).
[4] Harini, Sasono Wibowo.2014. Automatic Identification System
(AIS) Sebagai Alat Bantu Pendeteksi Lokasi Kapal. Jurnal Sains dan Teknologi Maritim, Volume XIII No. 02 Maret 2014.
[5] Tridoyo Kusumastanto. 2013. Pemberdayaan Sumberdaya Kelautan,
Perikanan dan Perhubungan Laut dalam Abad XXI.
[6] Hendra Saputra, Adi Maimum, Jaswar Koto, Mohammad Danil
Arifin, Estimation and Distribution of Exhaust Ship Emission from
Marine Traffic In the Straits Of Malacca and Singapore Using Automatic Identification System (AIS) Data, The 8th International Conference on Numerical Analysis in Engineering, pp. 131-142, 2015 pekanbaru, Indonesia.
[7] MB Zaman, E Kobayashi, N Wakabayashi, S Khanfir, T Pitana, A
Maimun. 2012. Fuzzy FMEA model for risk evaluation of ship collisions in the Malacca Strait: based on AIS data. Journal of Simulation 8 (1), 91-104 (2014)
[8] J. F. Vesecky, K. E. Laws and J. D. Paduan, "A system trade model
for the monitoring of coastal vessels using HF surface wave radar
and ship automatic identification systems (AIS)," 2010 IEEE
International Geoscience and Remote Sensing Symposium, Honolulu, HI, 2010, pp. 3414-3417.
[9] J. F. Vesecky, K. E. Laws and J. D. Paduan, "A system trade model
for the monitoring of coastal vessels using HF surface wave radar
and ship automatic identification systems (AIS)," 2010 IEEE
International Geoscience and Remote Sensing Symposium, Honolulu, HI, 2010, pp. 3414-3417.
[10] Z. Zhang, Y. Shao, W. Tian, Q. Wei, Y. Zhang and Q. Zhang,
"Application Potential of GF-4 Images for Dynamic Ship Monitoring," in IEEE Geoscience and Remote Sensing Letters, vol. 14, no. 6, pp. 911-915, June 2017.
[11] C. S. Yang and J. Jeong, "Integrated ship monitoring system for
realtime maritime surveillance," 2016 IEEE International
Geoscience and Remote Sensing Symposium (IGARSS), Beijing, 2016, pp. 4046-4047.
[12] D.-B. Hong C.-S. Yang "Classification of Passing Vessels Around
the Ieodo Ocean Research Station Using Automatic Identification System (AIS): November 21–30 2013",Journal of the Korean Society for Marine Environment and Energy, vol. 17 no. 4 pp. 297-305 2014.
[13] J. Hu and L. Zhang, "Research and realization of AIS ship dynamic
monitoring system based on SOA," 2011 International Conference