www.elsevier.com/locate/eja
Physiological responses of chickpea genotypes to terminal
drought in a Mediterranean-type environment
L. Leport
a,
*, N.C. Turner
a,b
, R.J. French
a,c
, M.D. Barr
a
, R. Duda
b,d
,
S.L. Davies
a,e
, D. Tennant
f
, K.H.M. Siddique
a,f
aCentre for Legumes in Mediterranean Agriculture, University of Western Australia, Nedlands, WA 6907, Australia
bCSIRO Plant Industry, Private Bag, PO, Wembley, WA 6014, Australia
cAgriculture Western Australia, PO Box 432, Merredin, WA 6415, Australia
dInstitut fu¨r Gemu¨sebau, Universita¨t Hannover, Herrenha¨userstrasse 2, D-30419 Hannover, Germany
eFaculty of Agriculture, University of Western Australia, Nedlands, WA 6907, Australia
fAgriculture Western Australia, Locked Bag No. 4, Bentley, WA 6983, Australia
Accepted 19 July 1999
Abstract
Two field experiments were carried out to investigate the effects of terminal drought on chickpea grown under water-limited conditions in the Mediterranean-climatic region of Western Australia. In the first experiment, five desi (small angular seeds) chickpeas and one kabuli ( large round seeds) chickpea were grown in the field with and without irrigation after flowering. In the second experiment, two desi and two kabuli cultivars were grown in the field with either irrigation or under a rainout shelter during pod filling. Leaf water potential (Y
l), dry matter partitioning after
pod set and yield components were measured in both experiments while growth before pod set, photosynthesis, pod water potential and leaf osmotic adjustment were measured in the first experiment only.
In the first experiment, total dry matter accumulation, water use, both in the pre- and post-podding phases, Y l
and photosynthesis did not vary among genotypes. In the rainfed plants, Y
l decreased below −3 MPa while
photosynthesis decreased to about a tenth of its maximum at the start of seed filling. Osmotic adjustment varied significantly among genotypes. Although flowering commenced from about 100 days after sowing (DAS) in both experiments, pod set was delayed until 130–135 DAS in the first experiment, but started at 107 DAS in the second experiment. Water shortage reduced seed yield by 50 to 80%, due to a reduction in seed number and seed size. Apparent redistribution of stem and leaf dry matter during pod filling varied from 0 to 60% among genotypes, and suggests that this characteristic may be important for a high harvest index and seed yield in chickpea. © 1999 Elsevier Science B.V. All rights reserved.
Keywords:Assimilate redistribution;Cicer arietinum(L.); Gas exchange; Osmotic adjustment; Water relations
* Corresponding author. Present address: Laboratoire de Physiologie et Biochimie Ve´ge´tales, Universite´ de Rennes I, 263 Avenue du Ge´ne´ral Leclerc, Campus de Beaulieu, 35042 Rennes Cedex, France.
Tel.:+33-2-99-28-61-63; fax:+33-2-99-28-69-15.
E-mail address:[email protected] (L. Leport)
1. Introduction under terminal drought, this was more intensively studied in a second experiment. In this second study two desi cultivars, Tyson and Sona, and two
Chickpea (Cicer arietinumL.) is grown across a
wide range of environments, from the subtropics kabuli cultivars, Kaniva and Bumper, were studied
to determine whether there was any variation
of India and north-eastern Australia to
Mediterranean-climatic regions around the among genotypes for assimilate redistribution.
Mediterranean basin and in southern Australia (Siddique et al., 1999). It has become an important pulse crop in Australia over the past decade. In
2. Materials and methods
subtropical areas it is sown after the summer monsoonal rains and grows on stored soil
mois-2.1. Experiment 1
ture. In Mediterranean-climatic regions it is sown in autumn or spring and grows during the cool
2.1.1. Trial design
wet months of winter and spring. In both
environ-Six chickpea (Cicer arietinum L.) genotypes,
ments chickpea crops are exposed to drought
including five desi types: cv. Tyson (121 mg during pod set and seed filling (terminal drought).
seed−1), acc. ICCV88201 (194 mg seed−1), acc.
Additionally, the crops can be exposed to low
T1587 (165 mg seed−1), acc. T1069 (182 mg
temperatures at flowering that inhibit pod set
seed−1), and acc. CTS60543 (158 mg seed−1) and
(Lawlor et al., 1998; Srinivasan et al., 1999) and
one kabuli type: cv. Kaniva (422 mg seed−1) were
high temperatures during seed filling that limit
grown in 1995 on a red brown earth (Calcic yields (Buddenhagen and Richards, 1988). While
Haploxeralf ) with a neutral surface pH (6.2 to chickpea is considered one of the most
drought-6.9) and pH increasing with depth to 8.6 tolerant of the cool season food legumes, the basis
(Thomson et al., 1997) at Merredin (31°30∞ S,
of its tolerance is unknown (Singh, 1993).
118°12∞ E), Western Australia. The trial was a
Methodologies for a better understanding of
randomized block design with four replicates of yield improvement under drought conditions have
each chickpea genotype, and with a buffer plot
been reviewed recently ( Turner, 1997). Leaf water
(chickpea, cv. Dooen) at each end of the trial. potential represents an easy measure of water
deficit and leaf gas exchange may provide a good
‘sensor’ of the stress. Production of dry matter, 2.1.2. Management
The plants were sown at a depth of 5 cm on 13 early vigour, phenological plasticity and osmotic
adjustment have been identified as some of the key May 1995 in plots 1.44 m wide (eight rows, 18 cm
apart) and 30 m long at a seeding rate that characteristics for improved yield and yield
mainte-nance under drought ( Turner, 1997). In the present gave established plant populations of 32–
37 plants m−2. All seeds were inoculated with a
study, these characteristics were studied on six
genotypes of chickpea grown on a fine-textured, commercial Group NBradyrhizobiumimmediately
before sowing. The plots received 72 kg/ha of triple
neutral-to-alkaline soil in the
Mediterranean-cli-matic region of Australia. The genotypes used superphosphate drilled with the seed at sowing.
Broad-leafed and grass weeds were controlled were a desi (small angular seeds) cultivar, Tyson,
a kabuli ( large round seeds) cultivar, Kaniva, and by conventional methods. Native budworm
(Helicoverpa spp.) was controlled using insecti-four desi advanced breeding lines, which had 14
to 30% higher yields than cv Tyson in 1994, a cides. A 5 m section at one end of each plot was
trickle irrigated commencing at flowering
season with below average rainfall (Siddique,
per-sonal communication). The aim of the study was (108 DAS ) and ending just before maturity.
Irrigation equivalent to pan evaporation occurred to identify the morphological and physiological
characteristics of chickpea that may affect yields twice weekly, corresponding to 152 mm of water
applied over a 64 day period. Minimum and maxi-in these low ramaxi-infall environments. As dry matter
solar radiation were recorded on a daily basis 2.1.5. Green area and dry matter partitioning
Plant samples (0.5 m2quadrat) from the rainfed
using an automatic weather station at the site.
end of each plot were harvested at ground level on 46, 72, 101, 115, 129, 143, 156, 171 DAS and at maturity (186 DAS for Kaniva, 178 DAS for
2.1.3. Water potential and photosynthesis
The leaf water potential (Y
l) of upper the other genotypes). Any leaf material on theground was collected and added to the sample. (unshaded ) expanded leaves and the water
poten-tial of pods (Y
p) 20 to 25 days after setting were Border rows were not harvested to avoid edgee
ffects. Plant samples were dried to constant weight
measured around midday (10:30 to 14:30 h) on
clear sunny days (photosynthetically active radia- and weighed. A 0.5 m length of crop was left
between sampling areas to minimize edge effects
tion above 1700mmol m−2s−1) at approximately
weekly intervals between 95 DAS and 174 DAS on the adjacent sampling area. A subsample of
three (129 and 143 DAS ), four (115, 156 and using the pressure chamber technique as described
previously (Leport et al., 1998). At the same time 171 DAS ), five (101 DAS ), six (46 and 72 DAS ),
and 10 uniform plants (at maturity) was also and on similar leaves to those used for
measure-ments of leaf water potential, the rate of net collected from the plot adjacent to the quadrat
cuts. These subsamples were partitioned into photosynthesis was measured with a portable, open
gas exchange system (Model LCA3, ADC, leaves, stems, flowers, and pods, and, at maturity,
seeds for dry matter determination. Green area Hoddesdon, UK ) as described previously (Leport
et al., 1998). All measurements of water potential was determined on the leaf, stem and pod
compo-nents (projected area only) using a Li-Cor LI-3100 and photosynthesis were replicated three times per
plot and per date of measurement, using a different (Li-Cor Inc., NE, USA) area meter. The green
area/shoot dry weight ratios of the sample plants
plant for each measurement.
and the dry weights of the bulk plant cuts were
used to calculate the green area index.
Instantaneous spot measurements of the fraction
2.1.4. Osmotic adjustment
At 129, 144 and 164 DAS, upper fully expanded of incident solar radiation intercepted by the
canopy near solar noon were obtained from inci-leaves were sampled and immediately frozen for
osmotic potential measurements while the closest dent photosynthetically active radiation 0.5 m
above and below the canopy with a 0.9 m long leaf on the same plant was collected in a plastic
bag for the measurement of relative water content linear quantum sensor (Li-Cor Inc., NE, USA).
At the same time that dry matter samples were ( Turner, 1981). Osmotic potential was measured
on expressed sap on the thawed samples by vapour taken, soil water content was measured at 20 cm
intervals from 10 cm to 170 cm depths in the soil pressure osmometry using Wescor ( Wescor Inc.,
Logan, UT, USA) C-52 sample chambers and by the neutron scattering technique using a Model
503DR CPN (California Nuclear Pacific, CA,
a Wescor HR-33T dew-point microvoltmeter
(Turner, 1981). The osmotic potential at full turgor USA) moisture meter.
(p
100) was calculated as: 2.1.6. Yield components
Yield components were determined on both the
p
100=pRWC
irrigated and rainfed plants at maturity. Harvest index was calculated at maturity as the ratio of
where RWC is the relative water content and p
the measured osmotic potential at that RWC. A seed dry weight to total above-ground crop dry
weight. The total number of pods (which included
single measurement ofpand RWC was made per
plot and per date of measurement. The level of all fertile and infertile pods), number of seeds
(which included all seeds above 20 mg) and seed
osmotic adjustment was estimated from the diff
er-ence in p
seeds per plant, number of seeds per pod and shelter reached physiological maturity (131 DAS ). In the block under the rainout shelter, irrigation mean seed weight were calculated. Seed and pod
number per square metre were calculated from the was stopped at pod set (107 DAS ), and thereafter
the rainout shelter was positioned automatically number of pods (or seeds) per plant and the ratio
of dry matter per unit area and per plant. over the crop during each rainfall event. Irrigation
occurred every two days, corresponding to 44 mm In the rainfed chickpeas, the start of flowering
and start of podding were recorded, corresponding of water applied over a 15 day period in the block
under the rainout shelter and to 149 mm of water
to when 50%of plants had at least one fully open
flower with visible corolla coloration, and at least applied over a 39 day period in the irrigated block
outside the rainout shelter. Rainfall was recorded one visible pod (3 mm), respectively.
on a daily basis using a manual rain gauge at the site. Minimum and maximum air temperatures
2.2. Experiment 2
were recorded on a daily basis using a data logger Testostor175 (Testo Gmbh & Co., Lenzkirch,
2.2.1. Trial design
Four chickpea genotypes, including two desi Germany).
types, cv. Tyson (121 mg seed−1), the
newly-released cultivar Sona (220 mg seed−1), a sister 2.2.3. Water potential
line of acc. ICCV88201 used in Experiment 1 Y
l was measured 107, 113, 118, 119, 120, 124,
(Section 2.1.1), and two kabuli types, cv. Kaniva 127 and 131 DAS, following the same procedure
(422 mg seed−1), and the newly-released cultivar as in Experiment 1 (Section 2.1.3).
Bumper (470 mg seed−1), obtained from a desi by
kabuli cross, were grown in 1997 in a deep yellow
2.2.4. Dry matter partitioning
sand (Quartzipsamment) with pH 6.0 to 6.5, at
Plant samples from both blocks (hereafter CSIRO Floreat Park, Perth, Western Australia.
referred to as the water stressed and irrigated The soil was spatially and vertically uniform. The
treatments) were harvested weekly at ground level crops were grown in two blocks, one of them
from beginning of pod set (107 DAS ) to maturity positioned so it could be automatically covered by
(138 DAS for the water stressed desi cultivars, a rainout shelter during rainfall events, and each
141 DAS for the water stressed Kaniva cultivar, block was fully randomized with three replicates
145 DAS for the water stressed Bumper cultivar, of each chickpea genotype.
and 159 DAS for the irrigated plants). 10 plants were collected for the first four harvests, and 20
2.2.2. Management
plants at maturity. Any leaf material on the ground The plants were sown at a depth of 5 cm on 18
was collected and added to the sample.
June 1997 in plots 3 m wide (17 rows, 16 cm apart)
Subsamples, corresponding to three plants out of
and 4 m long (size of each block 12 m×12 m) at
the 10, or six out of the 20, were partitioned into a seeding rate that gave established plant
popula-leaves, stems, pod walls and seeds for dry weight
tions of 30–38 plants m−2. All seeds were
inocu-determination. All plant samples were dried to
lated with a commercial Group NBradyrhizobium
constant weight and weighed. Dry matter per unit immediately before sowing. The plots received
area was calculated from the measured dry matter
120 kg/ha of superphosphate two weeks prior to
per plant and the measured plant density for the
sowing, and 50 kg/ha of a commercial mixed
fertil-corresponding plot.
izer (corresponding to 6.0 kg/ha of N, 2.6 kg/ha
of P, 7.1 kg/ha of K, 3.5 kg/ha of S, and 1.8 kg/ha
of Ca) six and 10 weeks after sowing. Weeds were 2.2.5. Yield components
Yield components, start of flowering and start controlled chemically. Both blocks were trickle
irrigated commencing at flowering (94 DAS ). In of podding were determined in both irrigated and
water stressed plants, following the same procedure the block outside the rainout shelter, irrigation
2.3. Statistical analysis
Means and standard errors were calculated with the SAS (SAS Institute, 1987) MEANS procedure
and tests for differences among genotypes and
treatments were performed using a one-way and a two-way ANOVA (SAS general linear model
pro-cedure). Significantly different species (P>0.05)
were identified with the LSD test. Correlations were derived using the SAS CORR SPEARMAN procedure.
3. Results
3.1. Experiment 1
3.1.1. Seasonal conditions
In 1995 at Merredin, daily maximum air
temper-atures were around 16°C from sowing to 100 DAS,
around 19°C for the next 45 days and around 25°C
from hereafter until maturity [Fig. 1(A)]. Daily Fig. 1. (A) Daily minimum (—) and maximum (…) air
temper-minimum air temperatures below 0°C were atures. (B) Daily incident solar radiation. (C ) Daily rainfall
during the growing season at Merredin, Western Australia, in
observed on five occasions near the onset of
flow-1995 (Experiment 1). The arrows denote the mean date of first
ering [Fig. 1(A)]. Until 153 DAS, daily minimum
flower (first arrow) and first pod (second arrow) in the rainfed
air temperatures were never above 10°C for more
chickpeas. The gaps between 25 and 45 DAS (A and B), and
than two consecutive days and then after 153 DAS between 59 and 87 DAS (B) correspond to missing data.
rose to above 13°C. Daily total solar radiation
was around 10 MJ m−2 at sowing and increased
steadily to a maximum of 28 MJ m−2at 183 DAS rainfall on 159 DAS. The midday pod water
poten-tial (Y
p) was always 0.2 to 0.4 MPa above Yl,
[Fig. 1(B)]. Including 60 mm just before sowing,
growing season rainfall (May–November) was except in rainfed plants after the rainfall event on
159 DAS whenY
landYpwere similar (Fig. 2).
313 mm [Fig. 1(C )], 86 mm more than the
long-term average. Before pod set commenced 275 mm The mean photosynthetic rate of the irrigated
plants, except at 151 and 167 DAS, ranged from fell, but plants received only 38 mm during pod
development, including 28 mm on 159 DAS. 21 to 27mmol m−2s−1 in all genotypes ( Fig. 2.).
The decrease of the rate of net photosynthesis in irrigated plants at 151 and 167 DAS coincided
3.1.2. Water potential and photosynthesis
For both irrigated and rainfed plants, no consis- with very windy conditions during measurement.
In the rainfed plants, the rate of net
photosyn-tently significant differences were observed among
genotypes in either midday leaf water potential or thesis decreased rapidly to values of 2 to
2.5mmol m−2s−1after 124 DAS. The decrease in
midday pod water potential ( Fig. 2). In the
irri-gated plants the midday leaf water potential (Y
l) photosynthetic rate coincided with the initiationof pod set. In the rainfed plants, the recovery in
was between −0.5 and −1.0 MPa before pod
development and between −1.0 and −1.9 MPa Y
lafter rainfall on 159 DAS had no effect on the
rate of leaf photosynthesis. By 159 DAS, only 13%
after pod initiation, while in the rainfed plantsY
l
decreased to −3.6 MPa after pod initiation and of the leaves were still green in the rainfed Tyson,
20 to 26% in the other rainfed desi chickpea, and
Fig. 3. Change with time of the calculated leaf osmotic potential at full turgor (p
100) in six irrigated (open symbols) and six rainfed (closed symbols) chickpea genotypes grown in the field at Merredin, Western Australia, in 1995 ( Experiment 1). Bars= ±one standard error of the mean (n=4) when larger than the symbol.
Fig. 2. Change with time in the midday leaf net photosynthetic
108 DAS for the four other genotypes. The first
rate, leaf and pod water potential of six irrigated (open symbols)
and six rainfed (closed symbols) chickpea genotypes grown in pods were observed four weeks later, on 130 DAS
the field at Merredin, Western Australia, in 1995 ( Experiment in all desi genotypes including the cold tolerant 1). The six genotypes are separated into two groups (A and B) selection CTS60543, and 135 DAS in the kabuli for clarity. The arrows denote the date of first pod in the rainfed
genotype (Fig. 2). The above-ground total dry
chickpeas. Bars=±one standard error of the mean when larger
matter in the irrigated plants at maturity was
than the symbol.
about 1000 g m−2 and only significantly lower in
Tyson than in the other genotypes ( Table 1); in the rainfed chickpeas the dry matter was about 60
38%in the rainfed Kaniva. By 174 DAS, all leaves
were senescent in the rainfed desi plants, while 9% to 70%of that in the irrigated plants ( Table 1). In
the rainfed plots, all genotypes achieved their of leaves were still green in the rainfed Kaniva.
maximum dry weight at 143 DAS, and then
decreased by 10 to 30%in the four desi genotypes
3.1.3. Osmotic adjustment
Osmotic adjustment, in those genotypes in [Fig. 4(A)]. Dry matter was significantly higher in
Kaniva than in the desi genotypes at 72 and which it occurred, was maximal at 145 DAS
(Fig. 3) by which time leaf photosynthesis was 101 DAS, but after 143 DAS it decreased markedly
so that there was no significant difference at
already low ( Fig. 2). No osmotic adjustment was
observed in the kabuli chickpea Kaniva or in the maturity.
In addition to the loss of total dry matter there desi chickpea T1069. Osmotic adjustment was
largest in CTS60543 (1.3 MPa), and intermediate was also some apparent redistribution of dry
matter during pod filling. Table 2 shows the (0.4 to 0.9 MPa) in Tyson, T1587 and ICCV88201.
decrease of stem plus leaf dry matter between maximum accumulation and maturity for the
3.1.4. Crop growth
Flowering commenced on 100 DAS for rainfed plots. During seed filling there was a
Table 1
Above-ground dry matter (g m−2), seed yield (g m−2), harvest index, pod (PN ) and seed numbers (SN ), and seed weights (SW ) at maturity of six genotypes of chickpea grown under irrigated and rainfed conditions at Merredin, Western Australia, in 1995 ( Experiment 1)a
Tyson ICCV88201 T1587 T1069 CTS60543 Kaniva
Irrigated
Dry matter 819b 1056a 1049a 1010a 1033a 980ab
Seed yield 351bc 369abc 428a 384ab 405ab 303c
HI 0.43a 0.35bc 0.41ab 0.38bc 0.39b 0.31d
PN (m−2) 2211ab 1854ab 2203ab 1802b 2233a 943c
SN (m−2) 2933a 2183abc 2555abc 2129a 2830ab 787bc
SN (pod−1) 1.3a 1.2bc 1.2c 1.2bc 1.3ab 0.8d
SW (mg) 129e 195b 176c 194bc 155d 416a
Rainfed
Dry matter 522a 613a 585a 639a 607a 659a
Seed yield 204ab 194ab 200ab 221a 209ab 163b
HI 0.39a 0.32b 0.34b 0.35ab 0.34b 0.25c
PN (m−2) 1549a 1158bc 1238abc 1135c 1453ab 523d
SN (m−2) 1918a 1230c 1381bc 1224c 1726ab 496d
SN (pod−1) 1.2a 1.1c 1.1bc 1.1c 1.2ab 0.9d
SW (mg) 102d 158b 142bc 145b 123cd 317a
aA separate ANOVA was performed for each parameter and for irrigated and rainfed plants. Values with the same letter within a row are not significantly different (P>0.05).
genotypes from 27%in ICCV88201 to almost 60% 3.1.6. Yield components
Under irrigated conditions, the highest seed in Tyson, with no significant reduction in Kaniva.
yield was observed in T1587 while Kaniva had the In the rainfed plots, the green area index
lowest yield ( Table 1). The harvest index (HI ) in reached a maximum earlier than the maximum dry
the irrigated Kaniva was significantly lower than matter [Fig. 4(B)]. The maximum green area index
in the desi genotypes. In the rainfed chickpeas, was around 5.0 in Kaniva, 4.6 in CTS60543 and
seed yields were about half (range 42–53%) of the
about 4.0 in the other desi chickpeas. The higher
yields in the irrigated plants. In the rainfed plants, leaf area in Kaniva was reflected in a greater
HI was lowest in Kaniva and highest in Tyson. interception of incident photosynthetically-active
In the irrigated plants, Kaniva had a signifi-radiation (PAR) at 72 to 115 DAS [Fig. 4(C )].
cantly lower number of pods per unit area than From 115 to 143 DAS the proportion of PAR
the desi chickpeas ( Table 1). In the rainfed plots,
intercepted by plants was greater than 85% in all
all genotypes had 27 to 45%fewer pods per square
genotypes.
metre compared to the irrigated plots. The desi
chickpeas had 20 to 30% of double-seeded pods
(1.2 to 1.3 seeds per pod), while Kaniva had 10
3.1.5. Water use
There was little variation among the genotypes to 20%empty pods (0.8 to 0.9 seeds per pod ) and
these were not affected by the terminal drought.
in total water use, in water use before pod initiation
and in water use after podding ( Table 3). The The largest seeds occurred in Kaniva and the
smallest seeds occurred in Tyson, which had seeds profile of water use with depth did not show any
significant differences among genotypes; 90% of only one third the size of those in Kaniva, in both
irrigated and rainfed conditions ( Table 1). The the water was extracted from the upper 80 cm of
Table 3
Total, pre- and post-podding water use (mm) for six chickpea genotypes grown under rainfed conditions in the field at Merredin, Western Australia, in 1995 ( Experiment 1)a
Genotype Water use
aA separate ANOVA was performed for each measurement of water use. Values with the same letter within a column are not significantly different (P>0.05).
expense of seed numbers which were reduced in genotypes with large seeds. Despite the water shortage during seed filling, the weight per seed
was only reduced by 19 to 25% in all genotypes
(Table 1).
Fig. 4. Change with time in (A) above-ground dry matter, (B) green area index, and (C ) interception of photosynthetically
active radiation in six rainfed chickpea genotypes grown in the 3.2. Experiment 2 field at Merredin, Western Australia, in 1995 ( Experiment 1).
The data points for Tyson and Kaniva are joined for clarity.
In 1997, the daily minimum and maximum air
The arrows denote the mean date of first flower (first arrow)
temperatures in Perth were 7 to 10°C warmer than
and first pod (second arrow) in the rainfed chickpeas. Bars=
±one standard error of the mean (n=4) when larger than those recorded in 1995 at Merredin. The total
the symbol. amount of rainfall from sowing date to maturity
was 337 mm, including 309 mm before pod set. In
Table 2 addition crops received 51 mm through irrigation
Reduction in leaf plus stem dry matter during seed filling as a before pod set. After pod set commenced, the fully fraction of maximum dry weight for six chickpea genotypes
irrigated plants received 126 mm of water,
includ-grown under rainfed conditions in the field at Merredin,
ing 98 mm through irrigation and 28 mm of rainfall
Western Australia, in 1995 ( Experiment 1)a
(i.e. total rainfall and irrigation=486 mm). The
Genotype Dleaf+stem dry matter (%of maximum) plants under the rainout shelter did not receive
any irrigation or rainfall after pod set (i.e. total
Tyson 58c
rainfall and irrigation=360 mm).
ICCV88201 27b
T1587 36b TheY
lof both the irrigated and water stressed
T1069 36b plants was similar to those obtained in Experiment
CTS60543 38b
1, with no significant differences among genotypes.
Kaniva 4a
Values of Y
l were between −0.6 and −0.8 MPa
during pod development in the irrigated plants
aValues with the same letter are not significantly different
(P>0.05). and decreased rapidly between 107 and 118 DAS
to values of −2.8 to −3.1 MPa in the stressed
plants (data not shown). ICCV88201 and T1069 which were half the size of
the kabuli seeds, in both irrigated and rainfed Flowering commenced at almost the same time
Table 4
Above-ground dry matter (g m−2), seed yield (g m−2), and har-vest index (HI ) at maturity of four cultivars of chickpea grown under irrigated and water stressed conditions at Perth, Western Australia, in 1997 ( Experiment 2)a
Tyson Sona Kaniva Bumper
Irrigated
Dry matter 496a 494a 561a 524a
Seed yield 233a 184a 113b 71c
HI 0.47a 0.37a 0.20b 0.14b
Water stressed
Dry matter 159b 241ab 259ab 327a
Seed yield 50b 69a 26c 30c
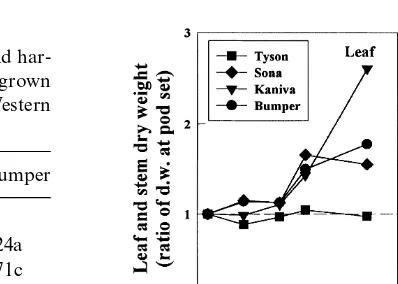
Fig. 5. Change with time in the leaf and stem dry weight (ratio
HI 0.31a 0.29a 0.10b 0.09b
of dry weight at the day of measurement versus dry weight at aA separate ANOVA was performed for each parameter and pod set) in four water stressed chickpea cultivars grown at for irrigated and rainfed plants. Values with the same letter Perth, Western Australia, in 1997 ( Experiment 2).
within a row are not significantly different (P>0.05).
began setting around 30 days earlier (102 to size characteristics in the irrigated plants were
similar to those observed in the rainfed plots in 106 DAS ). Dry matter partitioning was measured
only from beginning of pod set (107 DAS ) until Experiment 1 (data not shown).
maturity. Dry matter production was approxi-mately half that in Experiment 1 in both the
irrigated and water stressed plants ( Table 4). There 4. Discussion
were no significant differences among the four
genotypes in the maximum amount of dry matter One major limitation of chickpea in the cool
Mediterranean climate of the south-western
in the irrigated plants. The maximum dry matter
produced in the water stressed plants was about Australian cropping zone is its inability to avoid
terminal drought by flowering earlier and setting half that in the irrigated and was significantly
lower in Tyson and significantly higher in Bumper pods at low temperatures. At Merredin, in 1995
we observed some variation among the genotypes ( Table 4). In the irrigated plants, the stem and
pod dry matter of all genotypes and the leaf dry in the time to flowering, especially in CTS60543.
This putatively cold tolerant line (Lawlor et al., matter of the kabuli lines increased in all genotypes
until maturity at 159 DAS, the leaf dry matter in 1998) started flowering one week before Tyson,
but did not set pods earlier than the other geno-the desi lines did not change significantly after
126 DAS (data not shown). In the water stressed types. Possibly the day temperatures below 15°C
observed during the four weeks after flowering in plants, there was no variation in stem and leaf dry
matter during pod development in Tyson com- 1995 were too cold for pod set in any genotype
(Savithri et al., 1980; Srinivasan et al., 1999). By pared with the start of pod set, a slight increase in
Sona and Bumper stem dry matter, and more contrast, in Perth, where the minimum and
maxi-mum air temperatures were warmer, there was consistent increase in Kaniva (Fig. 5).
In the irrigated plots in Experiment 2, the seed minimal delay between flowering and pod set in
all four cultivars. yields of all four cultivars were lower than those
in the rainfed plots of Experiment 1, while the HI When no water deficit occurred, the average
rate of net leaf photosynthesis was high and only in Tyson and in Sona were slightly higher than in
irrigated Tyson and ICCV88201 (a sister line of small differences were observed among the six
genotypes. The values observed were consistent Sona) of Experiment 1, respectively ( Table 4). The
et al., 1982; Leport et al., 1998). With the develop- Pate, 1977), and the pod wall is assumed to play a significant role in the reassimilation of respired ment of water deficits, the rate of photosynthesis
in the rainfed treatment decreased linearly CO
2( Flinn et al., 1977). While leaf photosynthesis
decreased with the decrease ofY
l, we do not know
with Y
l at a mean rate of about
6mmol m−2s−1MPa−1 in all six genotypes whether the pod wall was able to recycle respired
CO
2as Ypdecreased.
(Fig. 6). This differs from the response reported
previously for chickpea in which photosynthesis Osmotic adjustment has been reported in
chick-pea when subjected to drought (Morgan et al.,
decreased markedly at aY
lof−0.8 to−0.9 MPa
(Leport et al., 1998). The reason for the difference 1991; Ruggiero et al., 1991; Leport et al., 1998).
Our data indicated that there was considerable in response between seasons is not clear, but may
reflect the more gradual development of water genetic variation from 0 to 1.3 MPa in osmotic
adjustment among the six chickpea genotypes, but deficits in 1995. Nevertheless, while 1995 was a
season with above average rainfall, leaf photosyn- that it only occurred at low values of leaf water
potential and when the rates of photosynthesis
thesis had decreased to 10% of its maximum rate
(i.e. 2.5 to 2mmol m−2s−1) in all genotypes by the were already low (at 145 DAS ). Thus, in contrast
to other results on cool season pulses (Subbarao time that seed filling began, as in chickpea in 1994
which was a season with below average rainfall. et al., 1995), osmotic adjustment was not
associ-ated with the maintenance of high levels of leaf
The higher water potential in the pods (Y
p)
than in the leaves (Y
l), may be associated with the photosynthetic activity, but it may have helped tomaintain the low but positive rates of leaf photo-position of the pod in the shade of the leaves, and
also to the lower density of stomata on the pods. synthesis at low water potential.
In a comparison across a wide range of pulses We were not able to measure any significant carbon
dioxide exchange in pods in either the rainfed or growing under water-limited conditions, Thomson
and Siddique (1997), Thomson et al. (1997), irrigated plants (data not shown). The gas
exchange of the pod is not considered to be a Leport et al. (1998) and Siddique et al. (1999)
showed that seed yield was correlated with early significant source of assimilate for seed
develop-ment in chickpea (Saxena and Sheldrake, 1980; dry matter production. This has led Siddique et al.
(1993) to suggest that the seed yield of pulses may Sheoran et al., 1987). However, in field pea, CO
2
respired by the seeds is released inside the pod, be increased in low rainfall areas of Western
Australia by selecting species with high dry matter where its concentration is very high (Atkins and
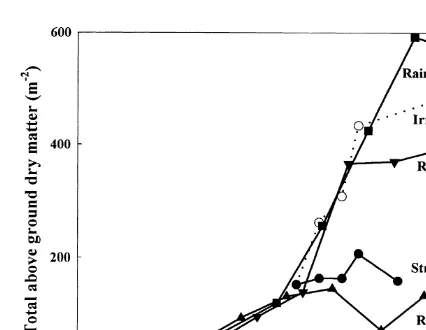
production. In the two experiments in this study the amount of dry matter produced was influenced by the timing of the onset of water deficits. When the data for desi chickpea collected over several sites and seasons were compared, it is clear that the initial rate of dry matter production was similar in all cases (Fig. 7), but the maximum amount of dry matter produced was determined by the com-mencement of water shortage. As chickpea has an indeterminate growth habit, the initiation of a water deficit induced by low rainfall or termination of irrigation not only determines the maximum dry matter production, but also the number of pods and seeds that are set. It is therefore not surprising that the number of pods or seeds per
Fig. 6. Relationship between midday leaf net photosynthetic
unit area is correlated with the total dry matter
rate and midday leaf water potential in six chickpea genotypes
(r2=0.83 for pod number, r2=0.92 for seed
grown in the field at Merredin, Western Australia, in 1995
chickpea, as demonstrated by Davies et al. (1999). Wery et al. (1993) has suggested that the transloca-tion of reserves in chickpeas is already very high and higher than in faba bean, lentil and field pea. However, the data on dry matter partitioning during seed filling in this study shows that the apparent redistribution of reserves in chickpea is
highly variable (0–60%) and suggests that
redistri-bution of assimilates is a characteristic that may be improved through breeding and selection. In the desi chickpea Tyson, preliminary data indicated that the decrease in the stem dry weight corres-ponded to a drastic decrease in storage
carbohy-drates from 30 to 3% of stem dry weight, (Itani,
personal communication). It is clear that our data
Fig. 7. Change with time in the above-ground dry matter in
on dry matter partitioning does not take into
chickpea grown at Perth under fully irrigated and water stressed
account the variations of the synthesis of structural
conditions in 1997 ( Experiment 2, cv. Tyson), and in the field
biomass versus remobilisation. Indeed, in the
at Merredin under rainfed conditions in 1995 ( Experiment 1,
cv. Tyson), in 1994 (Leport et al., 1998, cv. T1587) and in 1993 second experiment where the stress occurred much ( Thomson et al., 1997, cv. T1587). more rapidly than in the first, it was not possible
to show any remobilisation while variations in dry matter seems to show a greater ability to maintain
water deficits (r2=0.70 for pod number, r2=0.85
for seed number,P<0.01). structural biomass production in the kabuli
chick-pea Kaniva than in the desi type Tyson. However, high dry matter production does not
necessarily translate into high seed yields, when Nevertheless, the comparison of dry matter in the
second experiment still classified the genotypes in
we compare different genotypes. In 1995, Kaniva
produced the highest dry matter, but had a signifi- the same way as in the first experiment. Indeed,
the introduction of desi characteristics into cantly lower seed yield than the desi genotypes
under rainfed conditions ( Table 1). Our data indi- Bumper (a kabuli by desi cross) may be responsible
for the greater ability to redirect its photosynthe-cate that in addition to dry matter accumulation
before the commencement of pod set, partitioning tised products toward the seeds rather than into
the vegetative part in this cultivar than in Kaniva into seeds and the ability of the plants to
redistrib-ute reserves from stems and/or leaves are likely to and may indicate the potential for improving the
assimilate redistribution in kabuli chickpea.
be necessary for high yield. While changes in dry
matter alone do not definitively indicate redistribu- Further, as the redistribution is likely an important
component of seed yield in chickpea, harvest index tion of assimilates, the data in the first experiment
suggest that dry matter was redistributed during should be strongly associated with seed yield. In
both experiments, our data indicated that HI was seed filling from above-ground vegetative plant
parts in the desi chickpeas. By contrast, the kabuli closely correlated with seed yield (r2=0.87,
P<0.01) and with the apparent redistribution of
chickpeas had the highest maximum above-ground
dry matter in both Merredin and Perth, but were dry matter from leaves and stems in the rainfed
plots in 1995 (r2=0.98,P<0.01). the genotypes with the lowest apparent
redistribu-tion of dry matter from the leaves and stems and Fig. 7 highlights a problem with evaluating
drought resistance in indeterminate species. In the lowest yields. In the desi types that showed an
apparent redistribution of up to 60%of dry matter, determinate cereals, drought resistance is evaluated
as yield under drought compared to potential yield the decrease in dry matter was almost equal from
leaves and stems (data not shown). Redistribution obtained under adequately watered conditions. In
when plants in the water-limited plot reach physio- tions. Verification of this using labelled carbon is warranted.
logical maturity. In Experiment 2, the irrigation was stopped in the irrigated treatment when the water stressed plants were at physiological
matu-rity at 130 DAS. This was when water shortage Acknowledgements
started in the field at Merredin in Experiment 1.
As a consequence, dry matter production, seed We thank J.S. Malden, for dry matter sampling
yield and yield components in the irrigated plants and collection of weather data, C.A. Toynes and
in Experiment 2 were very similar to those found I.F. LeCoultre, L. Maiolo and L. French, for
under rainfed conditions in Experiment 1. assistance with the measurements at the field site,
However, the water stressed plants had markedly and L. Young for the day-to-day running of the
reduced total above-ground dry matter, seed experiment. We are grateful to Dr. B.D. Thomson
number, seed yield and harvest index, giving a for his helpful advice on the conduct of the
experi-relative yield under drought [expressed as a percen- ment at Merredin, Dr. R.J.N. Emery for his help
tage of yield potential ( Fischer and Maurer, 1978)] with statistical analyses, and Drs. M. Dracup and
of about 60% in 1995, 20–30% in 1994 and 1997, S.P. Loss for their useful comments on the
manu-but only 14%in 1994 and 1997 if the 1995 irrigated script. This research was supported by the
plants were used to give the yield potential. Thus Cooperative Research Centre for Legumes in
in indeterminate species such as chickpea it is Mediterranean Agriculture.
difficult to compare the drought resistance across
sites and seasons, as its evaluation may simply reflect the length of time that irrigation is
main-References
tained in the plots used to determine potential yield.
Atkins, C.A., Pate, J.S., 1977. An IRGA technique to measure CO
2content of small volumes of gas from the internal atmo-spheres of plant organs. Photosynthetica 11, 214–216. Buddenhagen, I.W., Richards, R.A., 1988. Breeding
cool-season food legumes for improved performance in stress
5. Conclusions
environments. In: Summerfield, R.J. ( Ed.), World Crops: Cool Season Food Legumes. Kluwer, Dordrecht, pp. 81–95.
There were no consistent differences in water
Davies, S.L., Turner, N.C., Siddique, K.H.M., Plummer, J.A.,
potential and leaf photosynthesis among the geno- Leport, L., 1999. Seed growth of desi and kabuli chickpea
types of chickpea exposed to terminal drought. At (Cicer arietinum L.) in a short-season Mediterranean-type
environment. Aust. J. Exp. Agric. 39, 181–188.
Merredin, none of the six genotypes studied were
Fischer, R.A., Maurer, R., 1978. Drought resistance in spring
able to avoid drought by early pod development.
wheat cultivars. I. Grain yield responses. Aust. J. Agric.
Although some genotypes flowered earlier than
Res. 29, 897–912.
others, all genotypes began pod set at the same Flinn, A.M., Atkins, C.A., Pate, J.S., 1977. Significance of
time due to the failure of flowers to set pods in photosynthetic and respiratory exchanges in the carbon
economy of the developing pea fruit. Plant Physiol. 60,
the cool spring temperatures. As a consequence,
412–418.
at Merredin, where cold temperatures did not
Lawlor, H.J., Siddique, K.H.M., Sedgley, R.H., Thurling, N.,
allow early pod set, there was only a poor
correla-1998. Improvement of cold tolerance and insect resistance
tion between high seed yield and early growth or in chickpea (Cicer arietinumL.) and the use of AFLPs for
maximum dry matter production in the chickpea the identification of molecular markers for these traits. Acta
Hort. 461, 185–192.
genotypes studied. However, our data show that
Leport, L., Turner, N.C., French, R.J., Tennant, D., Thomson,
a high HI is necessary for a high yield and that
B.D., Siddique, K.H.M., 1998. Water relations,
gas-partitioning and redistribution of dry matter from
exchange, and growth of cool-season grain legumes in a
stems and leaves is apparently one of the main Mediterranean-type environment. Eur. J. Agron. 9,
characteristics resulting in high seed yield in chick- 295–303.
Morgan, J.M., Rodrı´guez-Maribona, B., Knights, E.J., 1991.
condi-Adaptation to water-deficit in chickpea breeding lines by Singh, K.B., 1993. Problems and prospects of stress resistance breeding in chickpea. In: Singh, K.B., Saxena, M.C. (Eds.), osmoregulation: relationship to grain-yields in the field.
Field Crops Res. 27, 61–70. Breeding for Stress Tolerance in Cool-Season Food Legumes. Wiley, Chichester, pp. 17–35.
Ruggiero, C., De Falco, E., Pardo, A., De Falco, E., 1991.
Variation of leaf water potential and osmotic adjustment of Srinivasan, A., Saxena, N.P., Johansen, C., 1999. Cold toler-ance during early reproduction growth of chickpea (Cicer
three chickpea (Cicer arietinumL.) cultivars sown in winter
and spring. Riv. di Agron. 25, 539–545. arietinumL.): genetic variation in gamete development and function. Field Crops Res. 60, 209–222.
SAS Institute, 1987. SAS User’s Guide: Statistical Version. 6th
edn., SAS Institute Publishing, Cary. Subbarao, G.B., Johansen, C., Slinkard, A.E., Rao, R.C.N., Saxena, N.P., Chauhan, Y.S., 1995. Strategies for improving Savithri, K.S., Ganapathy, P.S., Sinha, S.K., 1980. Sensitivity
to low temperature in pollen germination and fruit-set in drought resistance in grain legumes. Crit. Rev. Plant Sci. 14, 469–523.
Cicer arietinumL.. J. Exp. Bot. 31, 475–481.
Saxena, N.P., Sheldrake, A.R., 1980. Effects of pod exposure Thomson, B.D., Siddique, K.H.M., 1997. Grain legume species in low rainfall Mediterranean-type environments. II. on yield of chickpeas (Cicer arietinum). Field Crops Res.
3, 189–191. Canopy development, radiation interception and dry matter production. Field Crops Res. 54, 189–199.
Sheoran, I.S., Singal, H.R., Singh, R., 1987. Photosynthetic
characteristics of chickpea (Cicer arietinum L.) pod wall Thomson, B.D., Siddique, K.H.M., Barr, M.D., Wilson, J.M., 1997. Grain legume species in low rainfall Mediterranean-during seed development. Ind. J. Exp. Biol. 25, 843–847.
Siddique, K.H.M., Walton, G.H., Seymour, M., 1993. A com- type environments. I. Phenology and seed yield. Field Crops Res. 54, 173–187.
parison of seed yields of winter grain legumes in Western
Australia. Aust. J. Exp. Agric. 33, 915–922. Turner, N.C., 1981. Techniques and experimental approaches for the measurement of plant water status. Plant Soil 58, Siddique, K.H.M., Brinsmead, R.B., Knight, R., Knights, E.J.,
Paull, J.G., Rose, I.A., 1999. Adaptation of chickpea (Cicer 339–366.
Turner, N.C., 1997. Further progress in crop water relations.
arietinumL.) and faba bean (Vicia fabaL.) to Australia. In:
Knight, R. ( Ed.), Cool-season Food Legumes. Kluwer, Ade- Adv. Agron. 58, 293–338.
Wery, J., Turc, O., Lecoeur, J., 1993. Mechanisms of resistance laide, in press
Singh, D.P., Rawson, H.M., Turner, N.C., 1982. Effect of radia- to cold, heat and drought in cool-season legumes, with special reference to chickpea and pea. In: Singh, K.B., tion, temperature and humidity on photosynthesis,