DEVELOPMENTS IN MONITORING RANGELANDS USING REMOTELY-SENSED
CROSS-FENCE COMPARISONS
Adam D. Kilpatrick a*, Stephen C. Warren-Smith b, John L. Read a, Megan M. Lewis a, Bertram Ostendorf a
a School of Earth and Environmental Sciences, The University of Adelaide, Adelaide, SA 5005, Australia -
(adam.kilpatrick, megan.lewis, bertram.ostendorf, john.read)@adelaide.edu.au
b Institute of Photonics and Advanced Sensing, The University of Adelaide. Adelaide, SA 5005, Australia – [email protected]
*Corresponding author
Commission VIII, WG VIII/8
KEY WORDS: Agriculture; Environment; Land Use; GIS; Landsat; Land Cover; Monitoring
ABSTRACT:
This paper presents a new method for the use of earth-observation images to assess relative land condition over broad regions, using a cross-fence comparison methodology. It controls for natural spatial and temporal variables (e.g. rainfall, temperature soils, ecosystem) so that we can objectively monitor rangelands and other areas for the effects of management. The method has been tested with small and large scale theoretical models, as well as a case study in South Australian rangelands. This method can also be applied in other systems and experiments such as field trials of crop varieties as a robust spatial statistic.
METHODS
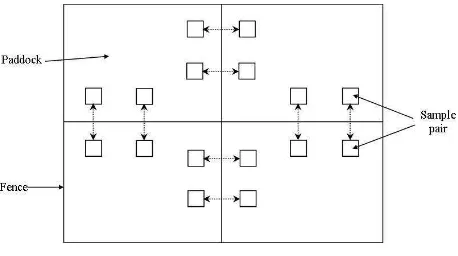
Cross-fence sample pairs are often used in field ecology to control spatio-temporal variation allowing a direct comparison of grazing pressures. In our method, we extract a very large number of cross-fence pairs of pixels from a vegetation index (or land cover) raster (figure 1). The average ratio of vegetation cover from this cross-fence pair is determined for each fenceline in a system, and this cross-fence ratio is used to generate an equation for the value of each paddock. The resulting series of homogenous linear equations is solved in order to rank each paddock objectively.
Figure 1. Cross-fence sampling layout
RESULTS
We have tested this methodology successfully using small and large model simulations, showing that it reproduces expected
rankings in those scenarios, and that weighting factors have their desired influence if applied. Our theoretical models show that the expected land-cover rankings are accurately predicted for large systems of paddocks and that grazing gradients as a result of the piosphere effect have an influence on paddock rankings. We have applied this monitoring methodology to Landsat TM images 6 years apart in a region of pastoral and mining leases in arid South Australia: changes in land condition rank over time conform to those expected as a result of documented changes in management over the study period, as per expectations documented in various published ecological
studies of the region.
CONCLUSIONS
This methodology is a significant breakthrough in the analysis of remotely sensed data in order to monitor fenced rangelands. It has the potential to be applied as the mainstay monitoring methodology to detect both good management and management leading to overgrazing in millions of square kilometres of rangelands in Australia and internationally. Its key attribute is its ability to rank paddocks against each other, allowing comparisons with paddocks of known management to inform decision making. Following on from this research, several new avenues are being explored, including spatial models of the effects of wind and distance to water on grazing distribution of animals in rangelands, methods of defining appropriate scales of experimental design in cross-fence studies, methods to automate the detection of fencelines and pseudo-fences from imagery and the potential to apply this type of analysis to other scenarios, such as in field trials of crops using field data.
International Archives of the Photogrammetry, Remote Sensing and Spatial Information Sciences, Volume XXXIX-B8, 2012 XXII ISPRS Congress, 25 August – 01 September 2012, Melbourne, Australia
ACKNOWLEDGEMENTS
The authors would like to thank Michael “Penguin” Sawyer for
helping to write the python script. The Pastoral Board of South
Australia provided fenceline data for the state of South
Australia. Hawthorn Beyer is thanked for his timely response in
building a tool suitable for cross-fence sampling. The lead
author is supported by an Australian Postgraduate Award
scholarship, and has received top-up scholarships from the
South Australian Arid Lands NRM Board and the South
Australian Pastoral Board (Department of Environment and
Natural Resources).
SELECTED BIBLIOGRAPHY
Kilpatrick, A.D., Warren-Smith, S.C., Read, J.L., Lewis, M.M., Ostendorf, B. (2011). Cross-fence comparisons: theory for spatially comprehensive, controlled variable assessment of treatment effects in managed landscapes. Ecol Informatics. 6, 170-176. DOI: 10.1016/j.ecoinf.2010.10.001
International Archives of the Photogrammetry, Remote Sensing and Spatial Information Sciences, Volume XXXIX-B8, 2012 XXII ISPRS Congress, 25 August – 01 September 2012, Melbourne, Australia