In-vivo fish sorting by computer vision
B. Zion
a,*, A. Shklyar
a, I. Karplus
baInstitute of Agricultural Engineering,Agricultural Research Organization,the Volcani Center, PO Box6,Bet Dagan50250,Israel
bDepartment of Aquaculture,Agricultural Research Organization,the Volcani Center,PO Box6, Bet Dagan50250,Israel
Received 21 June 1999; accepted 6 December 1999
Abstract
An image-processing algorithm, applied to images of common carp (Cyprinus carpio), St. Peter’s fish (Oreochromis sp.) and grey mullet (Mugil cephalus), successfully discriminated among the species. Fish images were acquired while they were swimming in an aquarium with their side to the camera. The algorithm was based on the method of moment-invariants (MI) coupled with geometrical considerations and was, therefore, insensitive to fish size, two-dimensional orientation and location in the camera’s field of view. One hundred and forty three images (47 grey mullet, 43 St. Peter’s fish and 53 carp images) were acquired and divided into two sets: 20 grey mullet, 20 St. Peter’s fish and 20 carp images in one set and the rest of the images in the other set. Each of these two sets was used as a training set for selection of feature thresholds, which were then applied to the other set as a test case (two-fold cross-validation test). Fish species identification reached 100, 91 and 91% for grey mullet, carp and St. Peter’s fish, respectively. To the best of our knowledge this is the first report on successful discrimination among fish species in vivo. We also report the results of a preliminary experiment, conducted to test the capability of fish to be trained to swim through a narrow Plexiglas channel which could be part of a sorting system, and through which fish images could possibly be acquired. © 2000 Elsevier Science B.V. All rights reserved.
Keywords:Computer vision; Fish species; In vivo
www.elsevier.nl/locate/aqua-online
* Corresponding author. Tel.: +972-3-9683450; fax:+972-3-9604704. E-mail address:[email protected] (B. Zion)
1. Background
The polyculture of several fish species that feed on different natural resources is an important management technique, particularly in extensive (big water reservoirs) and semi-intensive (ponds of a few acres) freshwater culture systems, where it promotes the efficient utilization of the production potential of the pond (Lin, 1982; Chang, 1987; Milstein, 1992). Synergistic interactions among fish species are based on two interrelated processes, namely, the increase of available food resources and the improvement of environmental conditions (Milstein, 1992). The advantages of fish polyculture are manifested in higher growth rates and yields in polyculture than in monoculture (Yashouv, 1971; Hepher et al., 1989). However, fish polyculture also has drawbacks, related to the fact that all fish must be treated in the same manner, without any special management, specific to each species (e.g., differential harvesting according to size, tolerance of low temperatures or to match market demand).
For optimal marketing it is necessary to sort harvested fish according to species and size. A common practice (called ‘pond decimation’ or pond thinning) is to harvest, at specified intervals during the season, fish which are ready for marketing, usually the larger fish of one of the species. Pond decimation increases overall fish production by reducing the population density, and reduces growth disturbance caused by competitive interaction between big and small fish. It is done by restricting the fish to a small part of the pond with fishing nets and lifting them onto a sorting table by means of vacuum pumps. A number of workers stand beside the sorting table and manually collect the fish which are ready for marketing, while the other fish slide back into the pond from a height of a few meters. This is a labor-intensive and expensive operation and it is harmful to the fish. At the end of the growing season, the pond is harvested and the fish are manually sorted by species and sized prior to marketing.
To date, growers do not have means for selective fish harvesting which would enable them to harvest fish of specific species and size according to market demand. The global goal of the present study is to try to develop means and methods for continuous, automatic, underwater selective harvesting of live fish.
Zion et al. (1999) reported results of an image processing algorithm, based on the application of the method of moment-invariants (Hu, 1962) to images of common carp (Cyprinus carpio), St. Peter’s fish (Oreochromis sp.) and grey mullet (Mugil
cephalus), commonly grown together, to discriminate among the three species and
identification was based on shape analysis and since surface texture and color were irrelevant, background lighting could be used to improve the contrast between the fish image and background and thus improve image segmentation.
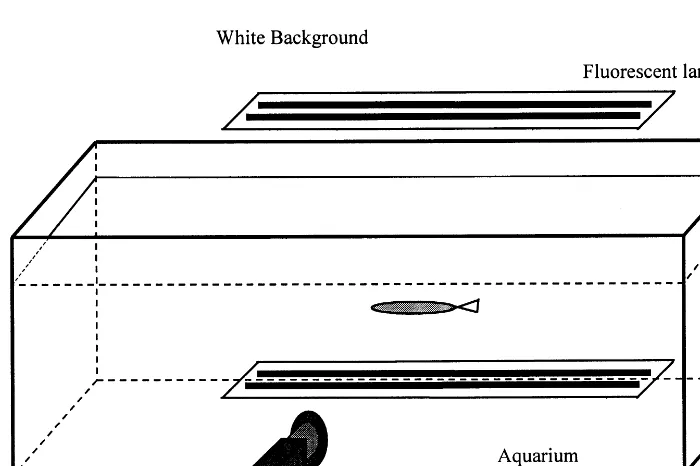
Following that work it was decided to test the ability of the method to identify the three species while the fish were alive. Rather than inserting a camera into the water in a waterproof casing, fish were placed in an aquarium and their images were taken by a CCD camera mounted outside.
In a possible practical application fish will have to be ‘delivered’ into the field of view of the inspection system (a video camera and lighting system in the present case), preferably one at a time and side-on to the camera. Fish have been effectively trained to approach feeders from long distances in both marine (Fujiya et al., 1980) and freshwater environments (Abbott, 1972; Levin and Levin, 1994) in response to acoustic signals.
Sorting of large fish populations on the basis of fish performance depends upon the large-scale transfer of information from trained to naive fish, since only a small fraction of the population can be effectively trained. Rapid transfer of information from trained to naive fish, based on imitation and social facilitation in mixed schools of trained and naive fish has been demonstrated for various training tasks (Hale, 1956; Fujiya et al., 1980; Suboski and Templeton, 1989). In the case of
Pagrus major, for example, which were trained in the laboratory to approach
feeders and released in the ocean for sea ranching, trained fish were frequently accompanied by naive specimens when captured (Fujiya et al., 1980).
In addition to the development and testing of the computer vision part, a preliminary experiment was conducted to test the ability of fish to be trained to swim through a narrow Plexiglas channel. Such a channel could be a part of a sorting system, through which fish images could possibly be acquired.
2. Materials and methods
2.1.Species recognition
Carp (Cyprinus carpio), St. Peter’s fish (Oreochromissp.) and grey mullet (Mugil
cephalus) were harvested from a local commercial fish farm and transported to the
laboratory in containers. Fish mass ranges were 90 – 675 g, 80 – 210 g, and 15 – 70 g for carp, St. Peter’s fish and grey mullet, respectively. The fish were kept in a plastic container (approximately 500 l) and moved in small groups (between three and six fish) to a glass aquarium (150 cm long, 30 cm wide and 50 cm deep; 8 mm glass thickness) for an imaging session.
The fish were allowed to swim freely in the aquarium and were viewed on a video monitor. When a fish was in the camera’s field of view, with its side to the camera and without other fish in the foreground or background, its image was grabbed. When enough images had been taken, the fish were replaced by other fish for a new imaging session. Since the laboratory was not equipped with means for holding each group of fish separately, they were returned to the plastic container with some chance of the same fish being imaged again. Approximately ten fish of each of the three species were used in each imaging session of the experiment. More than a single image of each fish was taken. Images which were grabbed while the fish were not side-on to the camera or which included other fish in the foreground or background were discarded. This was done because the aquarium in which fish were swimming was large and the fish could have been in any possible orientation while being imaged. In a future sorting system fish will have to be manipulated to swim through a narrow channel, with their side to the camera so that their typical shape could be viewed.
The 143 acquired images (47 grey mullet, 43 St. Peter’s fish and 53 carp) were divided into two sets: 20 grey mullet, 20 St. Peter’s fish and 20 carp images in one set and the rest of the images in the other set. Each of these two sets was used as a training set for selection of feature thresholds which were then applied to the other set for testing the performance in species recognition (two-fold cross-valida-tion test). The average of the errors made by the classificacross-valida-tion procedure in
classifying the two test sets is an indication of the ability of the procedure to identify the three fish species.
Only the green band of the colour images was used by the image processing algorithm since there was no need for colour information and because it was observed that the green band produced better contrast between the fish images and the background than the other two bands. Henceforth, this will be referred to as a grey-scale image. Shape analysis procedures were applied to the binary fish images constructed from the grey-scale images, by applying a background thresholding and labeling algorithm, as described below.
Assuming that fish images should always be fully within the camera field of view, a background sample of the first and last rows and columns (constructing the ‘frame’ of the image) was used for adaptive determination of the background threshold level for each image. Since image background was nonuniform, a background grey level matrix was generated and used instead of a simple threshold value. The means and standard deviations of the grey values of each of the two rows and two columns of the background frame were calculated and indexed as ‘left’, ‘right’, ‘up’ and ‘down’. A representative grey level for each of those sides was calculated by subtracting (since the background grey level was higher than that of the fish) a fraction of the standard deviation from the corresponding mean (e.g. TH(left)=Mean(left)−K*Stdev(left), where TH is the representative value and K
is an empirical factor). The ‘left’ and ‘right’ representative values were used for calculation of the horizontal distribution of the background grey level by simple linear interpolation. Similarly, the ‘up’ and ‘down’ representative values were used for calculation of the vertical distribution of the background grey level. The value of background pixel (i,j) was calculated by averaging the two values calculated by the horizontal and vertical interpolations for that pixel. The size of the background matrix matched the size of the image and the values of its elements were used as background threshold values for the corresponding image pixels.Kwas initially set to 0, the background matrix was calculated and a standard labeling algorithm was applied to the image. If the number of image segments (labels) was greater thanN
(Nwas experimentally determined), K was increased (to decrease the background threshold values), the background matrix was recalculated and the labeling al-gorithm was reapplied. This iterative procedure was terminated when the number of segments was less than or equal toN. At that stage, the largest image segment was considered to be the fish and the other segments were eliminated. A cropped binary image, which was expected to contain only the fish image, was thus generated. The segmentation algorithm could be expressed as following:
compute grey scale average (AV) and standard deviation (SD) of first and last
columns and rows (l for left, r for right, u for up and d for down):
AVl, SD1, AVr, SDr, AVu, SDu, AVd, SDd
set N, the target number of binary image segments for K=0:0.1:2,
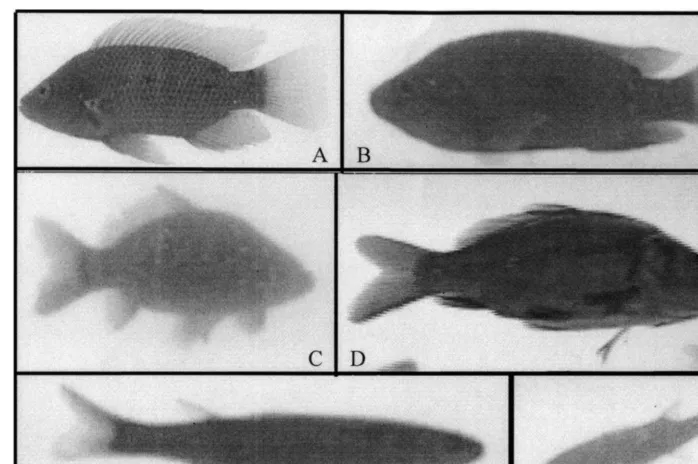
Fig. 2. Typical shapes of St. Peter’s fish (A,B); carp (C,D); and grey mullet (E,F), while swimming in the aquarium.
THl=AVl−K*SD1 THr=AVr−K*SDr THu=AVu−K*SDu THd=AVd−K*SDd
compute a background threshold matrix B(i,j) whose dimensions (N,M) are
the same to the original image:
B(i,j)=0.5*
(THr−THl)*jN +
(THu−THd)*i
M
n
apply threshold values to original image pixels and create a binary image: apply labeling algorithm to binary image and count no. of segments, ns if ns0N,
– select the largest segment as the fish image and delete other segments – stop
else end
could change drastically. It was also noted that with live fish in water, the fish tail clearly shows its characteristic shape (in contrast to dead fish, whose tails are sometimes bent or closed). It was, therefore, decided to use the shape of the whole fish for discrimination between grey mullet and the other two species, and to analyze the shapes of the tails of carp and St. Peter’s fish to differentiate between these two species. Note that the tails of grey mullet are similar in shape to those of carp, therefore, it was impossible to base species identification solely on tail shape. Since fish come in different sizes and may approach the imaging system at different orientation angles, it was decided to use moment-invariants (MI) as the shape features. Identification of grey mullet was based on the MI of the whole fish. Discrimination between carp and St. Peter’s fish was based on the MI of the tails. In a live-fish sorting application images will be grabbed while the fish swim through a transparent channel in front of the camera, in a known direction. In this case the orientation of the fish will obviously be head first. In the present work, however, fish were swimming freely in the aquarium and approached the field of view from varying directions, so that the location of the tail was unpredictable. To overcome this problem, the fish angle was determined as described by Jain (1989) and its length was calculated. The two ends of the fish image were cropped (10% of fish length on both head and tail ends), the MI of each end was calculated, and the larger of the two values identified the tail (Zion et al., 1999).
Once the tail of a fish was identified, two features were calculated and used (separately) by the classification procedure. The first feature was the square-root of the sum of squares [Ft=sqrt(f1t2+f2t2)] of the two MI of the tail end. Higher
order MIs, calculated from the third-order moments, were two orders of magnitude smaller than the MIs calculated from the second-order moments. They also showed no significant difference between the species and therefore did not contribute to the classification process. The second feature was involved with modeling the shape of the tail of a St. Peter’s fish as a rectangle whose aspect ratio (width/length) was the same as that of the tail segment which was extracted from the image (Fig. 3). Using the expressions for moment-invariants (Hu, 1962), the analytical expressions for the first two MIs (f1 andf2) of a rectangle whose length is ‘a’ and width ‘b’ are:
It was expected that the MI of a tail of a St. Peter’s fish would be close to that of a rectangle, whereas the MI of a tail of a carp was expected to be greater. Therefore, the percentage of deviation (df) of the MI of a given tail (ft) from the
MI of a rectangle (fr) with the same aspect ratio was calculated (df=(fr−ft)/
fr100) and used as a classification feature. The aspect ratio was determined by
counting the number of rows and columns within which the extracted tail segment was included.
The complete species recognition procedure was set as follows:
Calculate whole-body MI value (f1) from first order moments If f1\TH1 (TH1 is the threshold value for grey mullet)
Else
crop 10% of fish length on both head and tail ends (indexed h and t) calculate MI value for head and tail (f1h, f2h,f1tand f2t)
identify tail side by [Ft=sqrt(f1t2+f2t2)]\[Fh=sqrt(f1h2+f2h2)]
If Ft B TH2 (Ft is the feature being tested and TH2 is its threshold value)
– identify as a St. Peter’s fish
Else
– identify as carp
END
2.2.Fish handling and training
A preliminary study of the ability of fish to be trained to move, upon command, through an elongated narrow and transparent channel was conducted. The channel simulated a part of our future device for sorting live fish.
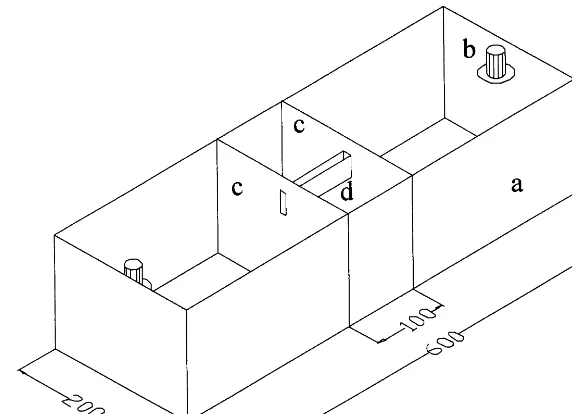
Ten red Oreochromis niloticus (mass range of 200 – 300 g) were used. The fish were maintained in a large rectangular concrete pool (6×1.5×2 m) and fed ad libitum on a diet of 35% protein feed pellets. Two manually operated feeding devices were installed at the two opposite sides of the pool (Fig. 4a), each comprising a white submerged feeding platform (30 cm diameter) at a depth of 25 cm. A blue lamp (50 W) inside a submerged transparent plastic cylinder (Fig. 4b) was positioned 10 cm above the outer edge of each feeding platform. The two lamps were connected to an electronic blinker whose frequency was approximately 2 Hz.
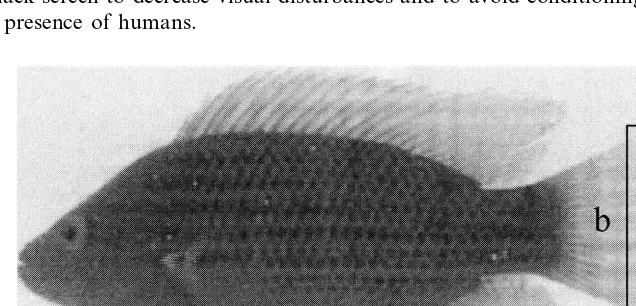
Feed pellets were placed manually at the centre of the feeding platforms, with the aid of a 2 m long PVC pipe (2 cm diameter). The entire pool was surrounded by a black screen to decrease visual disturbances and to avoid conditioning the fish to the presence of humans.
Fig. 4. Schematic of the fish pond in which fish training experiments were conducted. (a) Concrete pool; (b) feeding station with blinking light; (c) partitions; (d) Plexiglas channel.
The training of the fish was carried out in three phases. During the first phase fish were trained to move to the feeding platforms in response to a visual signal. Each training session lasted 1 min. Food was placed on one platform at a time, and a blinking blue light was operated above that platform for 20 s prior to food placing, for 30 s during feeding and 10 s after feeding.
Four training sessions were carried out every day. The total amount of food provided was 1% of the fish biomass, and no food was given outside the training sessions.
During the second phase, fish were trained to approach the feeding platforms by passing through a small opening in a mesh partition. The pool was divided into two equal sections by two identical affixed wire partitions each of which had a small (20×20 cm) opening. The openings of the two partitions coincided so that they formed a single passage which fish could use to move from one section of the pool to the other. During the third phase training continued with the two partitions (Fig. 4c) moved away from each other and connected by a 100 cm-long transparent Plexiglas channel, through their 20×20 cm rectangular openings (Fig. 4d).
3. Results and discussion
3.1.Species recognition
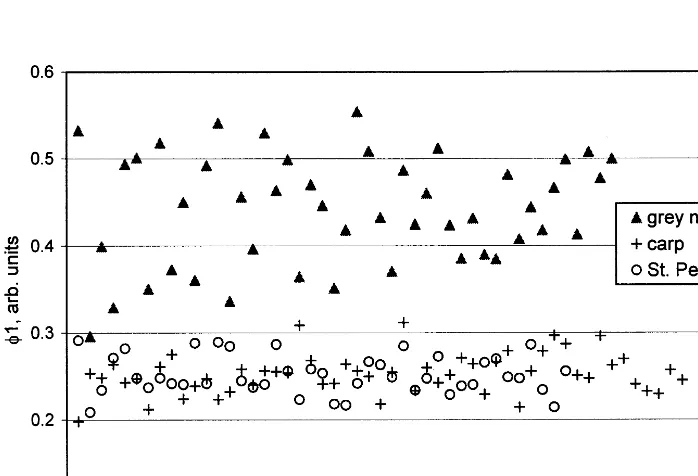
species. In the single case in which the MI of a grey mullet was unexpectedly low, its image included a dark shadow which may have been the result of a sudden movement of the fish at the instant when its image was grabbed. This shadow was not detected by the algorithm as a background; the fish appeared wider than normal in its binary image and its MI was reduced. The MI values of the grey mullet were in general smaller than those calculated for dead fish in our previous work (Zion et al., 1999). This could be due to the fact that the grey mullet used in the present study were much smaller (average mass, 40 g) than those used in the previous one (average mass, 485 g) and perhaps their elongated shape had not fully developed. The MIs of carp and St. Peter’s fish have completely overlapping ranges of values, because the fish sometimes open their fins and other times keep them close to their body, greatly varying the shapes of their silhouettes. The boundary (threshold value) between the grey mullet cluster and those of the other two species was set to the average plus two standard deviations of the MI values of carp and St. Peter’s fish.
All grey mullet of one test set and 19 out of 20 of the other set were correctly classified. The average classification error for grey mullet was 2%.
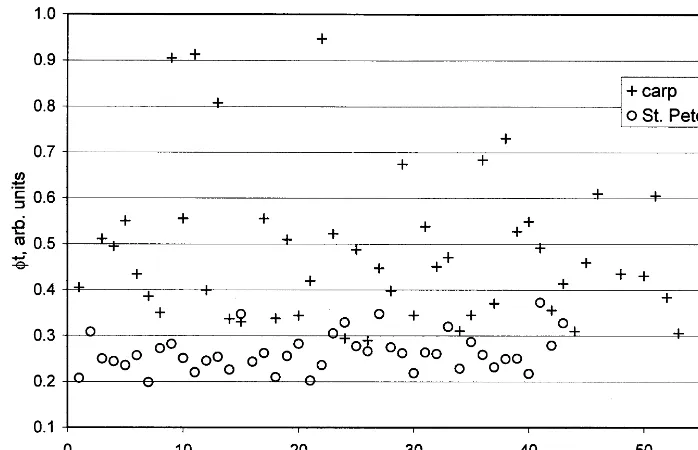
Fig. 6. Distribution of moment-invariants (Ft=sqrt(f1t2+f2t2)) of the tail ends (10% of fish length) of
carp and St. Peter’s fish. A few MI above 1.0 are omitted in order to illustrate the region of interest.
As explained above, the two ends of fish images which were not identified as grey mullet were extracted by determining the total fish length and ‘segmenting out’ 10% of that length from each end. The MIs of both ends were calculated and the larger one was used by the classification procedure. Though carp have a very typical tail shape, their MI values vary significantly between tails which were widely open when their images were acquired and those which were less open. The more widely a tail was open, the higher its MI value. The ‘openness’ of St. Peter’s fish tails had less effect on their MI values and it was, therefore, decided to set the boundary between the MI values of the tails of the two species to the average of the MI value for the St. Peter’s fish tails plus two standard deviations.
Fig. 6 shows a scattergram ofFt of the tail segments whose lengths were 10% of
the fish lengths. Use of the threshold values calculated forFt, enabled 79 and 91%
of carp and St. Peter’s fish, respectively, to be correctly identified (average errors of the two test sets).
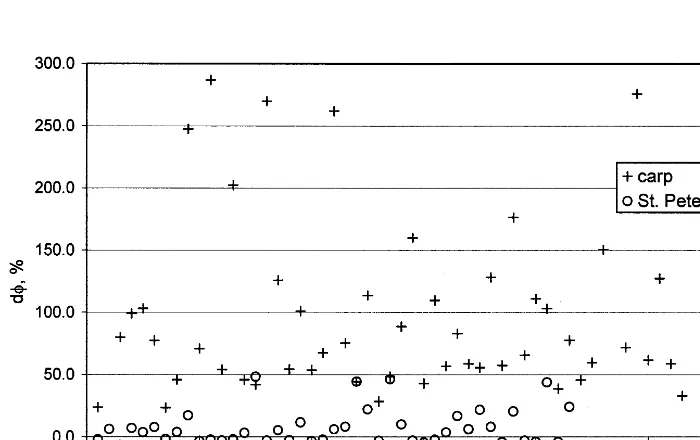
Fig. 7 shows a scattergram ofdf (the percentage deviation of the MI of a given tail from the MI of a rectangle with the same aspect ratio). Use of the threshold values calculated for df, enabled 91% of both carp and St. Peter’s fish to be correctly identified (average errors of the two test sets).
Usingdfas the feature for classification proved to be better thanFt. Though the
the tail was at the time the image was acquired). By comparing tail MI value to that of a rectangle, which is much closer in shape to the tail of St. Peter’s fish than that of carp, the difference between those tail shapes was enhanced.
Some of the errors may be attributed to the fact that parts of the fins and tails semi-transparent and if the background light is too strong the contrast between the fish image and the background may be good but parts of the tail may be lost in the segmentation process. In future experiments it is intended to vary the light intensity in order to determine the best lighting conditions, which generate good contrast between the fish and the background and yet keep the semi-transparent fins dark enough to be included in the segmented object. In one case, the tail of a St. Peter’s fish was damaged and therefore lost its typical shape. In another case, a St. Peter’s fish image was acquired, in which the tail looked like a carp’s tail, possibly because of a backward motion.
3.2.Fish handling and training
Fish training results are presented here in a general descriptive way, since the experiment was carried out without replicates, merely testing and demonstrating the feasibility of manipulating a group of fish in a manner that renders them suitable for sorting by a computer vision system. During the first phase of
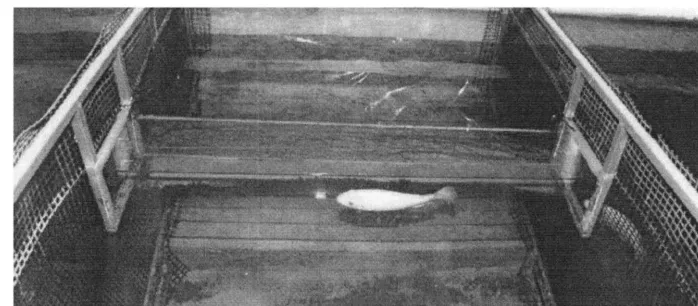
Fig. 8. Actual view of a fish swimming from one side of the pool to the other, through a narrow transparent (Plexiglas) channel mounted between the two mesh partitions. Another fish is entering the channel from the right.
training, the fish rapidly learned to associate the blinking blue light with food; after 4 days of training, they would move towards the feeding tables as soon as the blinking started before any pellets were provided.
During the second phase, as soon as the light signal was given the fish at-tempted to approach the feeder. Some succeeded immediately and all learned within 3 days to use the rectangular opening (20×20 cm) to reach the feeding platforms.
During the third phase, it took a few days for the fish to learn to use the narrow passage effectively to move from one section of the pool to the other; the tunnel was then gradually narrowed from 20×20 cm to 20×5 cm to allow the fish to swim only in single file and restrict their distance from a sensing device (e.g. a CCD camera mounted at the side) to a very narrow range (Fig. 8). The fish learnt to negotiate the narrow channel within 7 days.
4. Summary and conclusions
In-vivo identification of fish species regardless of size and two-dimensional orientation was successfully performed by means of image shape analysis based on moment-invariants.
Since live fish sometimes open their fins widely and at other times keep them tightly close to their body, thus affecting their silhouette shape, it was necessary to use shape analysis of the tail ends in order to differentiate between St. Peter’s fish and carp. Seventy-nine and 91% of carp and St. Peter’s fish, respectively, were correctly classified by means of the moment-invariants of their tails. Classification performance was improved by using the percentage of deviation of the MI of a given tail from that of a rectangle within which the tail could be enclosed. Ninety-one percent of both carp and St. Peter’s fish were correctly classified by means of this shape feature.
Since texture features played no part in species identification procedures, grey-scale details of the fish body were unimportant. Therefore, background lighting could be used to enhance image contrast for better fish image segmentation. However, parts of the fins and tails of the fish are semi-transparent and if the contrast between the fish image and the background is not clear they may be lost in the segmentation process. It is, therefore, necessary to set the background lighting intensity strong enough to produce good contrast between the fish and the background and yet not so strong that the semi-transparent fins look dark enough to be fully picked out by the segmentation procedure.
It was qualitatively shown that fish could be manipulated to swim through a narrow transparent channel in a way which renders them suitable for sorting by means of computer vision.
Acknowledgements
Contribution from the Agricultural Research Organization, the Volcani Center, Bet Dagan, Israel. No. 732/99, 1999 series.
References
Abbott, R.R., 1972. Induced aggregation of pond-reared rainbow trout (Salmo gairdneri) through acoustic conditioning. Trans. Am. Fish. Soc. 101, 35 – 43.
Chang, W.Y.B., 1987. Fish culture in China. Fisheries 12, 11 – 15.
Fujiya, M., Sakaguchi, S., Fukuhara, O., 1980. Training of fishes applied to ranching of red-sea bream in Japan. In: Bardach, J.E., Magnuson, J.J., May, R.C., Reinhart, J.M. (Eds.), Fish Behavior and its Use in the Capture and Culture of Fishes. ICLARM, Manila, pp. 200 – 209.
Hale, E.B., 1956. Social facilitation and forebrain-function in maze performance of green sunfish (Lepomis cyanellus). Physiol. Zool. 29, 93 – 102.
Hepher, B., Milstein, A., Leventer, H., Teltsch, B., 1989. The effect of fish density and species combination on growth and utilization of natural food in ponds. Aquacult. Fish. Manag. 20, 59 – 71. Hu, M., 1962. Visual pattern recognition by moment invariants. IRE Trans. Inf. Theory IT-8, 179 – 187. Jain, A.K., 1989. Fundamentals of Digital Image Processing. Prentice Hall, Englewood Cliffs, NJ. Levin, L.E., Levin, A.F., 1994. Conditioning as an aid to fish harvest. Aquacul. Eng. 13, 201 – 210. Lin, H.R., 1982. Polycultural system of freshwater fish in China. Can. J. Fish. Aqu. Sci. 39, 143 – 150. Milstein, A., 1992. Ecological aspects of fish species interactions in polyculture ponds. Hydrobiologica
Suboski, M.D., Templeton, J.J., 1989. Life skills training for hatchery fish: social learning and survival. Fish. Res. 7, 343 – 352.
Yashouv, A., 1971. Interaction between the common carp (Cyprinus carpio) and the silver carp (Hypophthalmichthys molitrix) in fish ponds. Bamidgeh 23, 85 – 92.
Zion, B., Shklyar, A., Karplus, I., 1999. Sorting fish by computer vision. Comp. Elect. Agri. 23, 175 – 187.