UTILIZATION OF LANDSAT DATA FOR WATER QUALITY OBSERVATION IN
SMALL INLAND WATER BODIES
M. Pásler, J. Komárková
Dept. of System Engineering and Informatics, Faculty of Economics and Public Administration, University of Pardubice, Studentská 95, Pardubice, Czech Republic – [email protected], [email protected]
Commission VIII, WG VIII/4
KEY WORDS: Landsat, cloud cover, temporal resolution, data gap, water quality
ABSTRACT:
Many studies deal with water quality evaluation using remotely sensed data. In the field of remote sensing, there have been proposed several procedures how to observe selected parameters of water quality and conditions. The majority of works use methods and procedures based on satellite data but they usually do not deal with suitability and practicability of the satellite data. This paper provides summary of determinants and limitations of satellite data utilization for water quality evaluation. Cloud cover and its influence on size of visible water surfaces is the most deeply evaluated determinants. Temporal resolution, spatial resolution and some other technical factors are discussed as next determinants. The case study demonstrates evaluation of the determinants for Landsat 7 and Landsat 8 data (level 1) and for area of small ponds in part of Pardubice region in the Czech Republic. It clearly demonstrates several limitations of Landsat data for evaluation of selected parameters of water quality and changes of small water bodies.
1. INTRODUCTION
Observing of water quality in inland water bodies such as lakes or ponds has a significant impact on the quality of human life. There are several ways how to observe and measure water quality parameters. From the fields that remote sensing deal with, observing of water quality is one of the most significant use. There are many applications as well as scientific works finding correlation between remotely sensed data and characteristics of water quality. The works differ according to used devices, explored characteristics, used spectra and types of observed water bodies.
Today, there are several satellite systems available which provide various remote sensing data. The majority of research studies is based on multispectral data from Landsat images. The first works dealing with this issue come from 70´s where Landsat started its mission. Work of Bukata (Bukata, Harris, Bruton, 1974) is one of the earliest works where still Landsat 1 data are used. The boom of the related works comes from 80´s with start of Lansat 5. Landsat 5 Thematic Mapper (L5 TM) is used in many works from then until the end of the mission. There are works of Wang (Wang et.al., 2006) and Guan (Guan, Li, Booty, 2011) operating with L5 TM multispectral data monitoring water quality in specific areas. In the case of Wang it is Reelfoot Lake in Tennessee. Guan in his case study monitored water clarity of Lake Simcoe in Canada. There are built models based on correlation between in-situ data and multispectral images. As well as other authors, Guan and Wang find high correlation suitable for determining the parameters on base of remotely sensed data. Further there are works using Landsat 7 ETM+ and Landsat 8 OLI and TIRS sensors bringing better spectral and spatial resolution. Most of them also deal with chlorophyll as the observed parameter. The works usually propose models with coefficient of determination higher than 0.8 like in case of Torbick (Torbick et.al., 2008) modelling chlorophyll-α concentration in West Lake in China.
The most observed indicator of water quality is chlorophyll-α (chlorophyll alpha) mostly due to high correlation of models and his relation with other indicators and pollutants. Chlorophyll-α is a type of chlorophyll which is predominant in red and green algae and other organic based water pollutants. The reflectance model of chlorophyll-α is subject of researches such as (Carder, 1991) and it´s crucial for observing based on remote sensing. There are other water quality parameters observed by remote sensing such as phytoplankton, dissolved organic matter, total organic carbon chemical oxygen demand and biochemical oxygen demand like in (Wang, 2004). For all the parameters there can be found high correlation between in-situ data and the satellite data.
Modern trend in remote sensing is to observe water quality using alternative carriers like UAVs. In (Zang, 2012) the research is focused especially on using UAVs in monitoring of water pollution. There are other ways how to observe water quality by remote sensing which differs by possibilities as well as limitations like spatial and temporal resolution or costs.
The paper is focused on suitability of remote sensing data for water quality observation in a real situation. There are many papers describing utilization of remote sensing data for water quality observation available. Papers usually describe data processing, models proposals and obtained results in a form of case studies focused on a particular water body. They usually do not evaluate a practical suitability and availability of Landsat data for real problems solution. Particular studies based on Landsat data are described in the next chapter. Then, a set of parameters for evaluation of Landsat data suitability is proposed. Finally, a case study for Landsat 7 and 8 is provided. The case study is based on the proposed set of parameters.
2. UTILIZATION OF LANDSAT DATA FOR WATER QUALITY OBSERVATION
Detecting of chlorophyll and other water quality determinants (transparency, temperature, …) based on remote sensing brings some limitations mentioned across related papers. In 1977 there were mapped chlorophyll-α concentration, Secchi disk depth and water surface temperature in Lake Iseo in Italy (Giardino, 2001). There were used Landsat 5 TM data, in-situ measurements and synchronized precise atmospheric measurements for further corrections and modelling. It leaded to models with determination coefficients 0.99 for chlorophyll and 0.85 for Secchi disk depth. However, the models were built on relatively small number of measurements acquired during just one overpass of the satellite and very good weather conditions. The need of atmospheric conditions consideration was proposed by Giordano’s work.
In (Lillesand, 1983), there is suggested that there are several determinants of a quality of such models like clouds, haze, wind, poor image data, small lake size or shallow lake depth. They all are in some way causing changes in spectral behaviour of clear water surface or make impossible its evaluation.
An extensive research was done at University of Minnesota by mapping water clarity of Minnesota’s 10,000 lakes during 20 years (Olmanson, 2002). There is clearly mentioned the importance of imagery without cloud cover, cloud shadows or haze. There were clipped areas covered with clouds from the images and checked for haze by visually inspecting using the (RGB) band combination 1, 6, 6 for Landsat TM. Further there were proposed estimate of percentage of clear water areas. However, the long term nature of the research and size of the area allowed discarding unsuitable images. No complex statistic related to cloud cover was proposed. (Nelson, 2003) dealt with a large number of days with high cloud cover that resulted in few available cloud free scenes. There was measured and modeled water clarity in lakes in the lower peninsula of Michigan during July and August 2001. In (Kloiber, 2002) there were reduced the number of images suitable for analysis by criterion that only images with less than 10% cloud cover are suitable for analysis. Amount of images was significantly reduced but the number of the rest of images was still high enough for Kloiber.
It implies that the importance of clear images growths with a shortening of terms for observations and with decreasing size of study areas. Remote sensing approach is more appropriate than in-situ measurements in case of many smaller water bodies spread over a large area. In this case importance of clear images increases as well.
3. LANDSAT CHARACTERISTICS DETERMINING ITS UTILIZATION FOR WATER QUALITY OBSERVATION
There are some significant characteristics determining utilization of Landsat data for water quality observation. All the facts related to Landsat satellites come from official USGS web page (USGS, 2016). One of them is a temporal resolution. It determines how often a value of a parameter can be taken. Low temporal resolution may be suitable for long term analysis but it is not suitable in the case of an unexpected necessity for the given date and time. In present there are two operating Landsat satellites: Landsat 7 and Landsat 8. They are operating on sun-synchronous orbits. Both are overpassing the same area every 16 days with 8-day offset from each other. Further, there is an
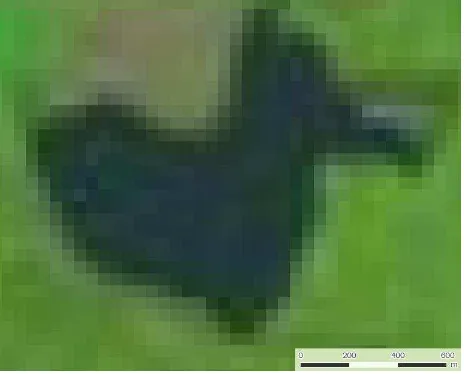
overlap between images so some areas are scanned more than once in 16 days by a particular satellite. A location of every single image taken by Landsat satellites is specified by Worldwide Reference System-2 (WRS-2) using paths and rows. The satellites are scanning surface and the images follow each other from row to row. It means that only overlap between paths can increase number of images of a specific area in 16 days. These facts show that standard temporal resolution is not a suitable characteristics of Landsat data in the case of water quality observation. A real time resolution must be specified according to the area of interested and according to the chosen set of satellites. Time distribution of images may be temporally irregular inside the overlapping areas, e.g. there can be gap 4, 5 or any other number of days. Maximum and average gap between images constitute a suitable parameter for replacement of standard temporal resolution. The parameter of maximum and average gaps between images provides higher information value then standard temporal resolution of Landsat data and it offers possibility of comparison with irregular observations. Another parameter determining the utilization of Landsat data is spatial resolution. ETM+ scanner on board of Landsat 7 as well as OLI scanner on board of Landsat 8 has 30 meters resolution per pixel. The resolution is the same for all of bands of spectra used for water quality observation. Approximate scene size is 170 km north-south by 183 km east-west. The spatial resolution in real situation means approximately 400 pixels per pond of size of 40 ha in the case of ideal conditions. In Figure 1 there can be seen detail of Pohránovský pond with single pixels.
Figure 1. Detail of Pohránovský pond in Landsat 8 image
In Landsat images, there are many influences impairing ideal conditions. It leads to significantly lower number of usable pixels. The papers usually mention problems with clouds, cloud shadows, haze and other various problems. Clouds are the most significant ones from them. The cloud cover is calculated by means of the Automatic Cloud Cover Assessment (ACCA) algorithm for every Landsat image. The percentage of cloud cover is available in metadata for all images. Many of Landsat images have very high cloud cover reaching almost100 %. There are cases where one half of an image is covered completely while the rest of image is clear; i.e., the 50 % of cloud cover of image completely covers the whole area of interest or the area of interest is not covered by clouds at all. So, the precise calculations for the area of interest are needed. Cloud cover assessment is not enough detailed and exact factor for determination of applicable pixels even if it is calculated
precisely. There are the other various factors which should be calculated separately using different methods. One of the most significant are gaps (black bands) in Landsat 7 images. They are present in the pictures since May 31, 2003 when Scan Line Corrector (SLC) of ETM+ failed. An estimated 22 % of any given scene is lost because of the SLC failure.
The above described characteristics can influence each other. For example, the percentage of cloud cover over the water bodies can change the parameter of maximum gap between usable images. With regard to that, there can be calculated the maximum temporal gap for different levels of cloud cover and different time periods.
A different approach for detecting usable parts of water bodies (clear pixels) in the images can be more appropriate as a result of previously described issues. The results should be related to the described characteristics.
4. USED DATA AND METHODS
Landsat 7 and Landsat 8 Level 1 and LandsatLook data are used for the case study. Determination of paths and rows (WRS-2) is necessary for identification of suitable images for an area of interest. There is WRS-2 Path/Row to Latitude/Longitude Converter on USGS web site (USGS, 2016a) to find path and row coordinates of a specific area. The converter finds only nearest canter of an image and gives its path and row coordinates. The overlapping images have to be checked whether there is the area of interest located too. There is Landsat acquisition calendar on USGS site for determining frequency of acquisition for specific paths and its potential mutual time offset.
For determining the percentage of clear water surface on every image it is necessary to remove pixels with clouds, cloud shadows, haze, missing pixels (in case of Landsat 7) and other undesirable factors. Removing all of them one by one seems to be not the most suitable method. In the case of many influencing factors, it seems to be more suitable the following method: the clear water pixels are identified and picked up while the rest is removed. There are known methods how to separate water from land for instance using Modified Normalized Difference Water Index (MNDWI). In this work there were used maximum likelihood classification. For the classification process as well as for further processing ESRI ArcGIS 10.2 for Desktop with Spatial Analyst was used. There were collected samplings of clear water and a signature file was created as an input to the classification. This had to be done separately for Landsat 7 and Landsat 8 images. There were built a model in ArcMap which of inputs are the signature file, a Landsat image and shapefile of the chosen water bodies from the area of interest. The model in ArcMap ModelBuilder can be seen on Figure 2.
Figure 2. Model in ArcGis ModelBuilder to determinate percentage of clear water pixels
There is iterated through all the chosen Landsat images in geodatabase (more than 200 images, see the next chapter), clear water surface is classified based on the signature, the output of classification is vectorised and it is intersected with the reference layer to determinate the percentage of clear water compared to reference layer. Finally, the result is exported to MS Excel. The output of this process was visually checked for all the analysed images. The process is done over LandsatLook images with geographic reference. LandsatLook images are full resolution files derived from Landsat Level 1 data products. The images are compressed to create an image optimized for visual interpretation. For Landsat 8 OLI bands 6, 5, 4 (RGB) are used and for Landsat 7 ETM+ bands 5, 4, 3 (RGB) are used. The LandsatLook images are not recommended for image analyses (USGS, 2016b). Water surface is very specific easily identifiable and interpretable type of surface even in LandsatLook images. In described method this data is used as well as the model as a very fast method with minimal data size demand (tens of megabytes in this case compared with hundreds of megabytes in case of Level 1 products). The data and the method in general are valuable enough with respect to mentioned advantages. The method is primarily designed to improve unsuitable characteristic of cloud cover over whole image given in metadata to the image.
The percentage of clear observable water surface on an image is influencing the mentioned temporal characteristics. An absence of suitable images increases the temporal gap between usable images which means gap between potential measurements of water quality parameters. The influence of the temporal characteristics is clear in case of 0 % of clear water surface. The situation in other cases is not so clear because a precise limit for suitable percentage of clear water surface is not done and it can be affected by many factors. Evaluating of the parameters for various values is given with regard to those facts.
5. CASE STUDY
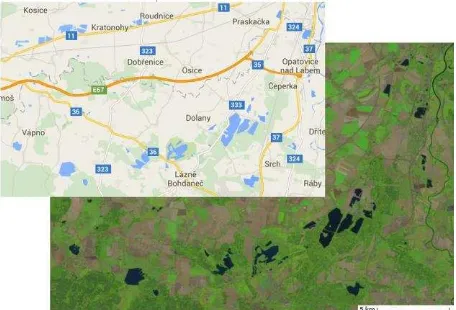
For the case study there is chosen an area with smaller water bodies – ponds and small lakes created by mining of sand. The area of interest covers water bodies located nearby city of Pardubice located in central part of the Czech Republic. Total water area is approximately 5 km2 and it is spread over a region with an area of 150 km2. For the study there were chosen 6 water bodies, 19 separate polygons with area from 0.05 km2 to 0.8 km2 and total area of 4.5 km2 of water surface. The water bodies are mainly designed for fish breeding and for outdoor swimming and recreation purpose. The water bodies are spread in area which extends inside one Landsat path/row location. The area contents of 190/25 and 191/25 images due to horizontal overlap between paths. This is same for Landsat 8 as well as for Landsat 7. The water bodies are shown in Landsat 8 image and in map (Figure 4).
Figure 4. Landsat 8 image of the chosen water bodies
According to Landsat 8 acquisition calendar path 190 is acquisitioned in the 1st day of its 16-day cycle and path 191 is acquisitioned in the 8th day of the cycle. According to Landsat 7 acquisition calendar path 190 is acquisitioned in the 9th day of its 16-day cycle and path 191 is acquisitioned in the 16th day of the cycle. This distribution means 6 days without an image followed by 2 days with images. In the two days the order of paths is switching. It means that the maximum temporal gap between images is 6 days and average gap in 16 days period is 4 days. It is determined without considering influence of 2015. It means 236 images, 59 images for every of the paths and both satellites. After visual supervision the values smaller than 2 % were considered as an error of measurement and reset to calculated for the water bodies. The average percentage of clear water was evaluated as 25.331 % for Landsat 8 images and 14.655 % for Landsat 7 images. The difference between the values is caused by presence of the gaps on Landsat 7 images. In the Landsat 8 images there is no significant difference between 190 and 191 paths (the difference is less than 2 %). There were expected more significant difference between the path in case of Landsat 7 images due to different position of the area in the images. However, the difference is less than 3 % which indicates smaller influence of the gaps according to position in the image in compare with the influence of other factors, especially clouds. The longest gap in data is from 5th October 2015 to 15th November 2015 which means 40 days without data caused by 11 images without clear water surface in streak. Maximum temporal gap in the measurement is then 40 days and average temporal gap is 10.54 days. It means that the maximal gap is increased 6.6 times and average gap is increased 2.6 times due to considering influence of percentage of clear water surface. From all 236 images only 90 are not completely covered by cloud and other influences which represents 38 % total.
As there was mentioned the limit of utilization of the images can be set variously. There are the parameters evaluated for different levels of the lowest accepted percentage of clear water surface. It is summarized in Table 1.
Lowest accepted
Table 1. Real time gap according to acceptable percentage of clear water surface
The values in Table 1 are evaluated for all 236 images. The parameters could be evaluated for shorter time period (for instance months). The parameters are very various due to nature of the problem.
6. CONCLUSION
There have been created many models based on Landsat multispectral data for water quality evaluation. The aim of this paper is not to create or evaluate these models, but to exanimate suitability of the Landsat data used for the models and the observing.
There are proposed parameters that better reflect real suitability of the images with respect to temporal resolution, spatial resolution and other determinants of the suitability. There is discussed significance of influence of cloud cover and its distribution over the image. Further, there is discussed the influence of haze, cloud shadows and the black gaps in Landsat 7 images. A suitable way of evaluation of real temporal possibilities of suitability of Landsat 7 and Landsat 8 images is proposed. The real temporal resolution is evaluated in form of maximal and average temporal gap in data. The influence of percentage of clear water surface (without clouds, shadows, gaps etc.) is proposed as a part of the mentioned temporal clear water surface smaller than 2% was considered as zero. The total average percentage of clear water was evaluated as 20 %. are 146 unusable images from the total number of 236 images. It represents 62 % completely unusable images.
The study shows real potential of Landsat images in problem of water quality monitoring with focus on real temporal resolution. It shows very significant influence of cloud cover and the other influencers on the temporal resolution and so it shows the limitation for a periodical observing of the water bodies.
REFERENCES
Bukata, R. P., G. P. Harris , J. E. Bruton, 1974. The detection of suspended solids and chlorophyll-a utilizing digital multispectral ERTS-1 data. In: 2nd Can. Symp. Remote Sensing, pp. 552–564.
Carder K. L., S. K. Hawes, K. A. Baker, R. C. Smith, R. G. Steward, B. G. Mitchell, 1991. Reflectance model for quantifying chlorophyll-a in the presence of productivity degradation products. In: Journal of Geophysical research, 96(11), pp. 20599–20611.
Giardino C., M. Pepe, P.A. Brivio, P. Ghezzi, E. Zilioli, 2001. Detecting chlorophyll, Secchi disk depth and surface temperature in a sub-alpine lake using Landsat imagery. In:
Science of The Total Environment 268(1-3), pp: 19-29.
Guan X., J. Li, W. G. Booty, 2011. Monitoring Lake Simcoe Water Clarity Using Landsat-5 TM Images. In: Water
Resources Management, 25(8), pp. 2015-2033.
Kloiber S. M., P. L. Brezonik, L. G. Olmanson, M. E. Bauer, 2002. A procedure for regional lake water clarity assessment using Landsat multispectral data. In: Remote Sensing of
Environment, 82 (1), pp: 38-47.
Lillesand T. M., W. L. Johnson, R. L. Deuell, O. M. Lindstrom, D. E. Meisner, 1983. Use of Landsat data to predict the trophic state of Minnesota lakes. In: Photogrammetric Engineering and
Remote Sensing, 49, pp: 219-229
Nelson A. C., P. A. Soranno, K. S. Cheruvelil, S. A. Batzli, D. L. Skole, 2003. Regional assessment of lake water clarity using satellite remote sensing. In: Journal of Limnology, 62(1), pp: 27-32.
Olmanson L. G., M. E. Bauer, P. L. Brezonik, 2002. Use of Landsat imagery to develop a water quality atlas of Minnesota’s 10,000 lakes. In: ISPRS FIEOS 2002 Conference Proceedings.
Torbick N., F. Hu, J. Zhang, J. Qi, H. Zhang, B. Becker, 2008. Mapping chlorophyll-a concentrations in West Lake, China using Landsat 7 ETM+. In: Journal of Great Lakes Research, 34(3), pp. 559-565.
USGS, 2016a. http://landsat.usgs.gov/ (17 Apr. 2016)
USGS, 2016b. LandsatLook.
http://landsat.usgs.gov/LandsatLookImages.php (17 Apr. 2016)
Wang Y., H. Xia, J. Fu, G. Sheng, 2004. Water quality change in reservoirs of Shenzhen, China: detection using LANDSAT/TM data. In: Science of The Total Environment, 328(1-3), pp. 195–206.
Wang F., L. Han, H.T. Kung, R. B. Van Arsdale, 2006. Applications of Landsat‐5 TM imagery in assessing and mapping water quality in Reelfoot Lake, Tennessee. In:
International Journal of Remote Sensing, 27(23), pp.
5269-5283.
Zang W., J. Zang, Y. Lin, Wang, H. Tao, 2012. Investigating small-scale water pollution with UAV Remote Sensing Technology. World Automation Congress 2012, pp. 1-3