AN ACCURACY ASSESSMENT OF AUTOMATED PHOTOGRAMMETRIC
TECHNIQUES FOR 3D MODELING OF COMPLEX INTERIORS
Athanasios Georgantas1,2, Mathieu Br´edif1, Marc Pierrot-Desseilligny1,2
1
IGN, MATIS, 73 Avenue de Paris 94160, Saint-Mand´e, France; Universit´e Paris-Est [email protected]
2
Universit´e Paris Descartes, CRIP5-SIP Lab, 45 rue de Saints P`eres, 75006, Paris, France
Commission III/1
KEY WORDS: Close Range Photogrammetry, Bundle Adjustment, 3D Modelling, Automation, Accuracy, Open Source
ABSTRACT:
This paper presents a comparison of automatic photogrammetric techniques to terrestrial laser scanning for 3D modelling of complex interior spaces. We try to evaluate the automated photogrammetric techniques not only in terms of their geometric quality compared to laser scanning but also in terms of cost in money, acquisition and computational time. To this purpose we chose as test site a modern building’s stairway. APERO/MICMAC ( cIGN )which is an Open Source photogrammetric software was used for the production of the 3D photogrammetric point cloud which was compared to the one acquired by a Leica Scanstation 2 laser scanner. After performing various qualitative and quantitative controls we present the advantages and disadvantages of each 3D modelling method applied in a complex interior of a modern building.
1 INTRODUCTION
Three dimensional models have become an essential tool for ex-perts in various domains. They are used in urban and environ-mental planning, in cultural heritage documentation, in build-ing and infrastructure inspection, in industrial measurement and reverse engineering applications, in film industry and in video games and virtual reality applications. Various methods are used in order to produce these models such as photogrammetry, laser scanning and traditional surveying.
Terrestrial laser scanners (TLS) have been widely used since their introduction in the production of such models. Their geometrical accuracy and automation which was outperforming the classic close range photogrammetric techniques made them very popu-lar in various applications such as cultural heritage documenta-tion and building inspecdocumenta-tion.
However multi-image matching which was introduced well be-fore (Gruen and Baltsavias, 1998) the appearance of laser scan-ners has become a very active research topic in both the pho-togrammetric and computer vision communities. Even though the two communities have been working almost independently till the year 2000 (Forstner, 2009) this quickly changed as it be-came clear that the combination of the techniques used by both communities could lead to serious advances in the automation of the close range photogrammetric procedures. The introduction of tools like SIFT (Lowe, 1999) or MSER (Matas et al., 2002) that can reliably extract dense features from overlapping images, the automatic orientation of large blocks of images using only tie points (Snavely et al., 2008) and the dense matching of oriented images with the use of multi-correlation techniques and optimiza-tion techniques (Furukawa and Ponce, 2010) have contributed a lot to this direction. However it is not only the automation of the algorithmic process that helped photogrammetry to become once again attractive for 3D modelling. The advances in digital cameras that led to the production of low cost high quality off the shelf cameras was another important aspect that helped pho-togrammetry to re-establish herself as a competent player in the field of accurate 3D modelling.
Nowadays both TLS and photogrammetry can be used for the
production of 3D models even though they both present certain advantages and disadvantages. On the one hand TLS offers high automation on the procedure of acquiring dense 3D models of high geometric accuracy but the costs of acquiring a laser scanner and the software needed to manipulate the scanner and the cap-tured data remains still very high. Another disadvantage of the TLS is that the terrain acquisitions are usually time consuming and the RGB information acquired is usually of low quality for di-rect texturing. On the other hand even though detailed 3D capture through photogrammetry is highly computational and ambigu-ous, it presents certain advantages compared to laser scanning such as its lower cost, its flexibility, its rapid acquisition times on the field and the direct production of textured point clouds by us-ing directly the RGB information from the acquisition’s images. Nevertheless the geometric accuracy is strongly dependent by the objects texture, the calibration of the camera, the use of control points, the resolution of the images used and the network geom-etry. So the question on which of the two methods offers the best results in terms of different criteria still remains open.
In this paper we are presenting an accuracy assessment of 3D point clouds of complex interiors produced with a fully auto-mated open source photogrammetric software developed within the IGN (French Mapping Agency). We are also interested in defining the error sources in the different phases of a photogram-metric acquisition and the reliability of a photogramphotogram-metric acqui-sition in terms of field and office time compared to those with a laser scanner. We have chosen as test site a building’s stair-way. The stairway dataset was acquired with a Canon 5D Mark II and a 8mm fish-eye lens. In order to be able to compare the metric quality of our photogrammetric point cloud we have used a Leica Scanstation2 laser scanner which provided us with a 3D point cloud of known measurement uncertainty that were used as a reference.
2 RELATED WORK
vari-ous publications comparing the two different acquisition systems. A thorough comparison of airborne laser scanning (ALS) and tra-ditional manual photogrammetry for the generation of DSM and DTM models is presented in (Baltsavias, 1999). The author un-derlines that laser scanning has a lot of advantages in terms of density of measurements, automation and rapidity compared to traditional manual photogrammetry but nevertheless the two tech-nologies are complimentary to each other since the one can out-perform the other in certain tasks. In (Beraldin, 2004) the author is also examining this complementarity between laser scanning and photogrammetry and addresses the problem of data fusion and multi sensor imaging systems and their practical applications. He also presents a short review of the basic theory, the limitations and the theoretical accuracies acquired by both laser scanning systems and close range photogrammetry. In (El-Hakim et al., 2008) the integration of Image Based Modelling (IBM) and laser scanning techniques are also examined. In this paper laser scan-ning is mixed with photogrammetry and aerial photogrammetry with photo acquired by a balloon in order to model the Erectheion in Athens. The challenges presented to both laser scanning and photogrammetry by the marble surfaces due to their reflectance and texture problems are underlined in these publications. TLS techniques have been widely adopted for cultural heritage documentation and therefore many papers have tried to investi-gate the advantages and disadvantages of TLS and manual close range photogrammetry (Kadobayashi et al., 2004), (Alshawabkeh and Haala, 2004) (Boehler and Marbs, 2004), and (Grussenmeyer et al., 2008). The general conclusion is that due to the complexity of the scenes and of the materials used the choice of the method is heavily correlated to the scene that has to be modelled and hence a combination of the two methods could be interesting in various cases.
The advances in automation of photogrammetric procedures by the adoption of the computer vision techniques and the introduc-tion of commercial and open source automatic or semi-automatic software have led to significant advances in the use of IBM in different applications. (Seitz et al., 2006) present a quantitative comparison of various multi-stereo view (MVS) image based re-construction algorithms for modelling small objects in indoor en-vironments. The image datasets were compared to datasets ac-quired with the use of a laser stripe scanner which provided very high accuracy. The authors conclude that all the algorithms per-form well offering accuracies very close to the ones of the laser scanner. (Strecha et al., 2008) also present an evaluation of image based reconstruction algorithms with TLS systems. This evalu-ation concerns datasets of large objects acquired in outdoor con-ditions. The authors conclude that (Furukawa and Ponce, 2010) provide the best results. Nevertheless they point out that for large scale outdoor scenes the multi-view algorithms still lack in ac-curacy compared to laser scanning. In (Remondino et al., July 2008) a photogrammetric software for image matching and IBM is presented. An evaluation of the technique is also provided with a comparison of the photogrammetric software results for various scenes with those of a phase shift laser scanner and a triangulation scanner. The authors conclude that the new techniques adopted by the photogrammetric community can lead to the production of image based models with geometrical properties compared to the ones produced by laser scanners with the advantage of portability and lower cost.
The comparison that is presented in this paper aims to evaluate 3D models of the interior of a complex, low textured modern building produced by a totally automatic photogrammetric open source software and a TLS. We evaluate not only the accuracy of the two models but also the time spent on field and office in order to acquire them.
3 METHODOLOGY DESCRIPTION
The camera used for capturing the images is a Canon EOS 5D Mark II coupled with a 8mm Samyang fisheye lens. The cam-era’s sensor is a full frame 21 megapixel CMOS sensor which corresponds to a sensor pixel size of 6.4µm. The Samyang fish-eye lens is a low cost fishfish-eye lens made for APS-S sized sensors which means that only 70% of the diagonal of the camera’s sensor is used. The Samyang lens is one of the cheapest fisheye lenses in the market and provides 180◦circular fisheye images to full
frame sensors. It is made of 10 optical elements, one of which is aspherical, grouped in 7 groups. For the laser scanner cam-paign we have used a Leica Scanstation 2. The Scanstation 2 is a Time Of Flight laser scanner which offers at 50m a single mea-surement position accuracy of 6mm, distance accuracy of 4mm, horizontal angle accuracy of 60µrad and vertical angle accuracy of 60µrad. The modeled surface precision offered by the scanner is 2mm which guarantees that the noise levels in the cloud points are low. For the laser point clouds alignment and registration the Cyclone ( cLeica) software was used. For the scan registration black and white Leica targets where used on the field. For the image derived point cloud the APERO/MICMAC ( cIGN) Open Source software (APERO/MICMAC, 2012) was used. The soft-ware functionalities will be further analysed in the next section. The two cloud points where compared using the CloudCompare Open Source software (CloudCompare, 2012) ( cEDF R& D). The software offers various tools for the direct comparison of the distances between different cloud points or/and meshes of the same scene.
3.1 Data acquisition
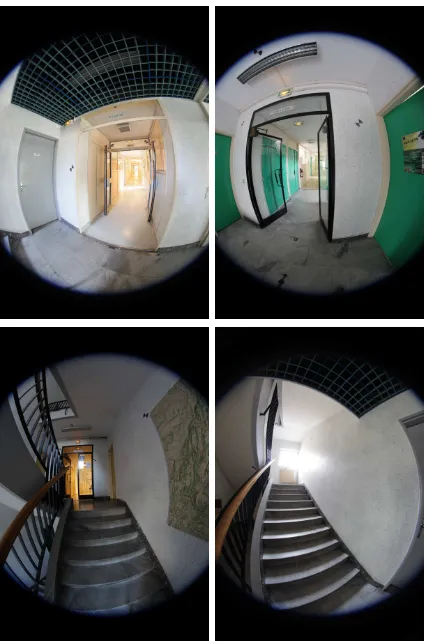
The stairway dataset was chosen for our experimentations be-cause it has several distinct characteristics that interest us. Firstly it is inside a modern building which means that is not very rich in texture and thus making it a rather challenging environment for the extraction of SIFT points and for the generation of dense point clouds from images. Secondly being part of a modern build-ing its surfaces are rather vertical and planar allowbuild-ing us to detect easily the deviations in the geometries of its surfaces. Finally the rather complex geometry of a modern building stairway is an added challenge for the stability of the camera network and the bundle adjustment of the photos. Our stairway is a typical U-shaped stairway with full landings in the middle and black metal handrails. The stairwell spans in 4 floors and is 12 meters high. In order to be able to capture our scene with the less photos pos-sible we had to use a lens that would permit us to have photos with a large field of view in the confined space of a stairway. The 8mm fishey lens that was used allowed us to acquire photos with a global view of the scene (Figure 1) and thus with textured zones in every image, which is essential for the SIFT algorithm. It also permitted us to have a sufficient overlap between more than two images in order to be able to effectively perform the multi-image matching. One photo was taken on each of the steps and about 8 photos were taken on each of its landings. In total we have ac-quired 111 photos in RAW format. The total acquisition time was of about 1 hour. At the same time we have also acquired a dataset of 15 images for the lens calibration.
Figure 1: Stairway fish-eye images
3.2 APERO/MICMAC
The IGN has decided in 2007 to deliver as Open Source several software that have been developed within the Matis laboratory. One of these is the APERO/MICMAC suite. The APERO is a software that computes orientation of images and MICMAC a software that calculates depth maps of oriented images and can deliver them as dense point clouds. The MICMAC software was initially used in aerial images but nowadays is also adapted to the needs of close range and terrestrial photogrammetry.
The main difference of the APERO/MICMAC from software de-veloped within the Computer Vision community like Bundler-PMVS (Furukawa and Ponce, 2010) or Samantha (Gherardi et al., 2011) is the introduction of photogrammetric rigidity in the equa-tions. Furthermore the camera calibration model used is more so-phisticated and allows the calibration of fish-eye lenses, an option which is not proposed to our knowledge by other Open Source software. It also allows the self-calibration during the bundle ad-justment steps. However the user of APERO/MICMAC must be aware that this software does not trade precision to the flexibil-ity of creating 3D models from unordered images. Therefore the user should follow the rules of photogrammetric acquisition in order to get the optimal results.
The 3D modelization process is done in three steps. In the first step tie points are computed between the images. A modified for large images version of sift++ (Vedaldi, 2010) is used by de-fault but the user could use any other detector for the extraction of tie points within the APERO/MICMAC pipeline. The user has the possibillity to select between computing tie points for all pair of images or define the number of images that overlap, in linear datasets, thus accelerating the computation time. The user may choose to provide calibration data for its camera or a self-calibration may be performed during the bundle adjustment
procedure. Several calibration models are proposed by APERO:
• Distortion free model
• Radial distortion polynomial model
• Radial distortion with decentric (fraser)
• Ebner’s and Brown’s model
• Polynomial models from degree 3 to 7
• Fish-eye models for diagonal and spherical fish-eyes
The two models used for fish-eye lenses are made by a combi-nation of theoretical equidistant model and a polynomial distor-tion. The polynomial model has 14 degrees of freedom 1 for focal length, 2 for principal point, 2 for distortion center, 3 coefficients of radial distortion, 2 decentric parameters and 2 affine parame-ters.The main difference is that for a diagonal fish-eye the model considers that the useful area in an image is within the 95% of its diagonal whereas for a spherical fish-eye this percentage is 52%. The second step is the computation of the orientations by the AP-ERO. The relative orientation is calculated from the tie points and if it is needed the relative orientation can be converted to absolute orientation with the use of control points or GPS/INS data. In order to calculate an initial solution an image is selected ei-ther by the user or by APERO which sets the coordinate system. The next image for orientation is chosen based on certain criteria such as the number of common tie points and their distribution in the images. APERO uses the essential matrix coupled with RANSAC and if there are enough tie points the space resection with RANSAC. The best solution is chosen at the end of the pro-cedure. A bundle adjustment of the oriented images is performed in regular intervals in order to avoid the solution’s divergence. The bundle adjustment follows the classical procedure presented in (Triggs et al., 2000). An estimation of the ground point is cal-culated by bundle intersection of all images it is seen and a mini-mization term, which is the sum of the retroprojection in the im-ages of the ground point, is then added. The term is linearised and is added to a global quadratic form that has to be minimized. The system is then solved using the Cholesky decomposition method. The MICMAC software and the generation of 3D point clouds through multi-scale and multi-resolution matching are extensively described in (Pierrot-Deseilligny and Paparoditis, 2006)
3.3 Data Treatment
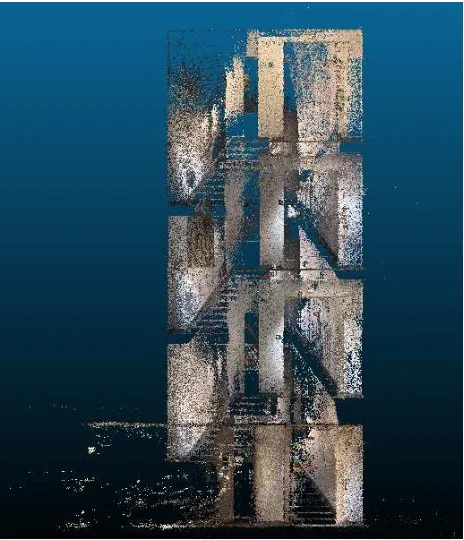
The TLS scans were treated using the Leica software of Cyclone. The black and white targets and the spheres that were acquired during the TLS acquisitions where used to register the different scans in one global scan of the whole stairway. The windows and everything that was outside the stairwell was excluded from the global scan in order to be able to effectively compare the TLS dataset to the IBM dataset. The use of targets and spheres for the registration of the scans meant that the process was automated and very fast compensating partially the long on-site acquisition times(Figure 2).
Figure 2: TLS point cloud
only 6 images before and after her. After the tie point generation we proceeded to the bundle adjustment of the images.The RMS of the bundle adjustment was 0.7 pixels. The scale can be in-troduced by measuring two points of known distance that can be seen in two images. The duration of orientation procedure on a Intel 2.83GHz Core2 Quad machine with 4Gb of RAM was 10 hours. It has to be noted that the extraction of tie points is the most time consuming part of the APERO but since it is coded as a multi threading procedure it can be accelerated on multi-core machines.
The next step after the orientation of the images was the recon-struction of the scene using MICMAC in order to produce sparse and dense cloud points of the stairway. We have the option within the software of quickly generating sparse point clouds which can be very useful to describe our global scene when a dense point cloud of the scene is not demanded and to verify that the bundle adjustment result is coherent with the reality. The sparse point cloud with the camera positions produced by IBM and the TLS point cloud of the stairway can be seen on Figures 2 and 3. We can see that IBM failed to produce a large number of points in the non-textured white area of the ceilings leaving the model open.
4 RESULTS
The two point clouds were registered using the ICP algorithm in order to be evaluated within the CloudCompare software ( cEDF R& D). The CloudCompare is an open source 3D point cloud and mesh processing and comparing software. The software offers various distance measurements between two point clouds or two meshes or a point cloud and a mesh. In our case we are inter-ested in the distance between two point clouds. In this case the software calculates a local model for the reference point cloud in order to offer a more local and global precision on the distance calculations between the two point clouds. Various models are proposed for this local model calculation and we have opted for the approach of the height function which offers the best preci-sion among the different models proposed. This method initialy projects the points on a plane calculated with least squares. Then a more accurate locally modelled plane is calculated with the use
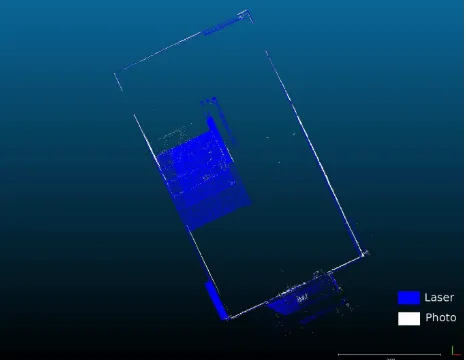
Figure 3: IBM sparse point cloud
of a height function of
z=ax+by+cx2+dy2+exy (1)
More information about CloudCompare and the models proposed by the software can be found in (Girardeau-Montaut et al., 2005) and (CloudCompare, 2012)
The mean distance between the sparse point cloud and the TLS point cloud was 3 cm with a sigma of 7 cm. The maximum dis-tance observed was 26 cm (Figure 4). For the dense point cloud the mean computed distance was 6 cm with a sigma of 6 cm. The maximum calculated distance was 29 cm.(Figure 5).
Qualitative tests have also been performed in order to better
un-Figure 4: Distance comparison between the sparse IBM point cloud and the TLS point cloud
Figure 5: Distance comparison between a part of the IBM dense point cloud with the TLS point cloud
and vertical sections of the TLS and the IBM point clouds have been made. As it can be seen in Figure 6 it is clear that the main geometry problem of the sparse point cloud is on the Z axis of our IBM mode where there is a systematic difference between the TLS point cloud and the IBM point cloud. This difference could be due to the fact that the IBM point cloud is very sparse on the ceiling and therefore the point cloud is ill-referenced on the Z axis. On the other hand the X and Y axis, as it can be seen on Figure 7, don’t suffer from significant geometry problems we can therefore assume that the results would have been signifi-cantly better if the ceiling was sufficiently textured.In Figure 5 we can also notice that during the dense point cloud generation MICMAC was not able to sufficiently compensate the distortions of the fish-eye lens and therefore the differences between the TLS point cloud and the dense point cloud seem to follow, much less extensively, the pattern of distortion of the fish-eye lens which could be attributed to the poor quality of the optics used for the construction of the low cost fish-eye lens that was used in our acquisition.
Figure 6: Horizontal section of IBM generated point cloud and TLS point cloud)
Figure 7: Vertical section of IBM generated point cloud and TLS point cloud)
5 CONCLUSIONS AND FUTURE WORK
We have presented a comparison of TLS and of a fully automatic photogrammetric work-flow IBM. We should note that we have not compared the IBM results of our software with results of other commercial or open source software such as Bundler-PMVS due to the fact that to our knowledge these software don’t offer the op-tion of calibrating fish-eye lenses on which we have solely been based for capturing our complex interior scene. However this choice was essential to our purpose since it allowed us to capture our scene using the fewer possible images with big overlaps and thus to a)accelerate the photogrammetric process and b)establish that the algorithm would be able to converge to a satisfactory re-sult. The overall result of our approach may not reach the geo-metric precision of a laser scanner, since it is heavily constrained by the lack of texture that characterizes most of the modern build-ings, however it still offers an interesting solution to TLS. In fact the use of IBM in our case trades part of the TLS accuracy for lower cost since the IBM dataset can be captured with any of the shelf dSLR camera equipped with a low cost fish-eye lens and an open source software instead of using an expensive laser scanner and its proprietary software. Another advantage of the IBM mod-elling solution compared to the TLS is the significantly faster ac-quisition of the images for the model generation, which could be essential for applications that demand quick and low cost mod-elling of complex interior spaces with low texture instead of a very accurate 3D model. Another advantage of the IBM mod-elling is its portability since a dSLR camera -or any other digital camera- and a tripod can be easily transported by a single per-son whereas TLS tend to be heavy and bulky thus making their transportation a difficult and sometimes complicated and expen-sive task. Another advantage of the IBM method compared to the TLS used in our experimentations is that it directly provides a high quality textured by the R,G,B information of the images whereas the texture in the TLS model is of inferior quality due to the significantly lower resolution of its camera.
manual measurement of control points in the images and their use in the bundle adjustment could provide us with better and more robust results in terms of geometric precision even though this would add a time consuming amount of manual work.
The advances that computer vision has brought to the photogram-metric work flow have allowed the use of IBM even in complex low textured scenes. The results of the automatic IBM method may be inferior to the ones of the TLS in terms of geometric ac-curacy but IBM, thanks to its scalability, low cost and on the field rapidity, remains an interesting solution to TLS. This confirms the fact that between IBM and TLS there is no single method for modelling one scene and that parameters such as the nature of the scene, the materials of the scene and the expected geometric accuracy should always be considered when choosing an acquisi-tion method especially nowadays that IBM open source software are available.
REFERENCES
Alshawabkeh, Y. and Haala, N., 2004. Integration of digital photogrammetry and laser scanning for heritage documentation. In: XXth International Society for Photogrammetry and Remote Sensing Congress, Comission V, Istanbul, Turkey, pp. 424–429.
APERO/MICMAC, 2012.http://www.micmac.ign.fr/.
Baltsavias, E., 1999. A comparison between photogrammetry and laser scanning. ISPRS Journal of Photogrammetry and Re-mote Sensing 54, pp. 83–94.
Beraldin, J.-A., 2004. Intergration of laser scanning and close range photogrammetry - the last decade and beyond. In: XXth International Society for Photogrammetry and Remote Sensing Congress, Comission VII, Istanbul, Turkey, pp. 972–983.
Boehler, W. and Marbs, A., 2004. 3d scanning and photogram-metry for heritage recording: a comparison. In: Proceedings of the 12th International Conference on Geoinformatics, University of Gavle, Sweden, pp. 291–298.
CloudCompare, 2012.http://www.danielgm.net/cc/.
El-Hakim, S., Beraldin, J.-A., Picard, M. and Cournoyer, L., 2008. Surface reconstruction of large complex structures from mixed range data the erechtheion experience,. In: The XXI Congress of the International Society for Photogrammetry and Remote Sensing, ISPRS, Beijing, China.
Forstner, W., 2009. Computer vision and remote sensing-lessons learned. In: Act of 52th photogrammetric week Computer Vision and Remote Sensing-Lessons Learned, Stuttgart, pp. 241–249.
Furukawa, Y. and Ponce, J., 2010. Accurate, dense, and robust multi-view stereopsis. IEEE Trans. on Pattern Analysis and Ma-chine Intelligence 32(8), pp. 1362–1376.
Gherardi, R., Toldo, R., Garro, V. and Fusiello, A., 2011. Auto-matic camera orientation and structure recovery with samantha. In: International Archives of Photogrammetry, Remote Sensing and Spatial Information Sciences, ISPRS International Workshop 3D-ARCH, on CD-ROM, Trento, Italy.
Girardeau-Montaut, D., Roux, M., Marc, R. and Thibault, G., 2005. Change detection on points cloud data acquired with a ground laser scanner. In: ISPRS Workshop Laser Scanning 2005, Enschede, the Netherlands.
Gruen, A. and Baltsavias, E., 1998. Geometrically constrained multiphoto matching. PERS (54(5)), pp. 633–641.
Grussenmeyer, P., Landes, T., Voegtle, T. and Ringle, K., 2008. Comparison methods of terrestrial laser scanning, photogramme-try and tacheomephotogramme-try data for recording of cultural heritage build-ings. In: The International Archives of the Photogrammetry, Re-mote Sensing and Spatial Information Sciences, Vol. XXXVII Part B5, pp. 213–218.
Kadobayashi, R., Kochi, R., Otani, N. and Furukawa, R., 2004. Comparison and evaluation of laser scanning and photogramme-try and their combined use for digita recording of cultural her-itage. In: International Archives of Photogrammetry, Remote Sensing and Spatial Information Sciences, Vol. 35(5), pp. 401– 406.
Lowe, D., 1999. Object recognition from local scale-invariant features. In: Proc. of the International Conference on Computer Vision, Corfu, Vol. 2, ICCV, Corfu, Greece, pp. 1150–1157.
Matas, J., Chum, O., Urban, M. and Pajdla, T., 2002. Robust wide baseline stereo from maximally stable extremal regions. In: Proceedings of the British Machine Vision Conference, 2002, BMVC, Cardiff, UK.
Pierrot-Deseilligny, M. and Paparoditis, N., 2006. A multires-olution and optimization-based image matching approach: An application to surface reconstruction from spot5-hrs stereo im-agery. In: Proc. of the ISPRS Conference Topographic Mapping From Space (With Special Emphasis on Small Satellites), ISPRS, Ankara, Turkey.
Remondino, F., El-Hakim, S., Gruen, A. and Zhang, L., July 2008. Turning images into 3-d models. IEEE Signal Process-ing Magazine pp. 55–64.
Seitz, S., Curless, B., Diebel, J., Scharstein, D. and Szeliski, R., 2006. A comparison and evaluation of multi-view stereo recon-struction algorithms. In: CVPR, pp. 519–528.
Snavely, N., Seitz, S. and Szeliski, R., 2008. Modelling the world from internet photo collections. International Journal of Com-puter Vision 80(2), pp. 189–210.
Strecha, C., Von Hansen, W., L., V. G., Fua, P. and Thoennessen, U., 2008. On benchmarking camera calibration and multi-view stereo for high resolution imagery. In: CVPR, IEEE Computer Society, Anchorage, Alaska, USA.
Triggs, B., McLauchlan, P., Hartley, R. and Fitzgibbon, A., 2000. Bundle adjustment - a modern synthesis. Lecture Notes in Com-puter Science 1883, pp. 298–372.
Vedaldi, 2010. http://www.vlfeat.org/~vedaldi/code/