LAMPIRAN A
HASIL UJI MUTU FISIK GRANUL
Pengujian Replikasi Formula
LAMPIRAN B
HASIL UJI KEKERASAN TABLET LEPAS LAMBAT IBUPROFEN
Replikasi I No
Kekerasan tablet formula
1 2 3 4
No Kekerasan tablet formula
Replikasi III No
Kekerasan tablet formula
1 2 3 4
1 17,8 17,5 17,1 17,6
2 17,2 17,5 17,0 17,6
3 17,3 17,9 17,7 17,5
4 17,1 18,1 17,6 17,9
5 18,3 18,1 18,1 17,1
6 17,1 18,1 17,1 18,1
7 18,1 17,8 17,3 17,2
8 18,2 18,3 17,5 17,6
9 17,1 18,4 17,4 17,1
10 17,5 17,9 17,8 17,3
Rata-rata 17,57 17,96 17,46 17,5
LAMPIRAN C
HASIL UJI KERAPUHAN TABLET LEPAS LAMBAT IBUPROFEN
LAMPIRAN D
HASIL PENETAPAN KADAR TABLET LEPAS LAMBAT
IBUPROFEN
LAMPIRAN E
CONTOH PERHITUNGAN
Contoh perhitungan sudut diam:
Formula 1:
Contoh perhitungan indeks kompresibilitas:
Contoh perhitungan akurasi & presisi:
Absorbansi = 0,724 y = = 6,6523.10-3 + 1,7867. 10-3 x. Csampel = 401,49 ppm
Cteoritis = 400,9 ppm
% Contoh perhitungan AUC pada disolusi:
Rumus =
(
1)
(
1)
Contoh perhitungan %DE360:Luas = 360
×
rata-rata penetapan kadar×
dosis = 360×99,95%×400= (124966,05 / 143928)
×
100% = 86,83%Contoh perhitungan %obat terlarut:
Formula 1
Contoh perhitungan konversi dari bentuk level menjadi bentuk
LAMPIRAN F
HASIL UJI DISOLUSI TABLET LEPAS LAMBAT IBUPROFEN FORMULA 1
Replikasi t (menit)
LAMPIRAN G
HASIL UJI DISOLUSI TABLET LEPAS LAMBAT IBUPROFEN FORMULA 2
Replikasi t (menit)
LAMPIRAN H
HASIL UJI DISOLUSI TABLET LEPAS LAMBAT IBUPROFEN FORMULA 3
Replikasi t (menit)
LAMPIRAN I
HASIL UJI DISOLUSI TABLET LEPAS LAMBAT IBUPROFEN FORMULA 4
Replikasi t (menit)
Replikasi 3
Konsentrasi Absorbansi x2 y2 xy
5,255 0,027 27,61503 0,000729 0,141885 10,51 0,075 110,4601 0,005625 0,78825 21,02 0,095 441,8404 0,009025 1,9969 31,53 0,128 994,1409 0,016384 4,03584 42,04 0,140 1767,362 0,0196 5,8856
51,5 0,082 2652,25 0,006724 4,223 103,0 0,179 10609 0,032041 18,437 206,0 0,352 42436 0,123904 72,512 309,0 0,497 95481 0,247009 153,573 412,0 0,671 169744 0,450241 276,452 515,0 0,871 265225 0,758641 448,565 618,0 1,101 381924 1,212201 680,418
Σ ΣΣ
Σ X2 ΣΣΣΣ XY ΣΣ YΣΣ 2 N Ssi RDF
Replikasi 1 1007470 1815,782 3,276069 12 3,274267 11 Replikasi 2 1036436 2026,992 3,99086 12 3,988904 11 Replikasi 3 971412.7 1667,028 2,882124 12 2,880408 11
3015319 5509,803 10,14905 10,14358
SSC = 10.14723
F = 0.005932 < F tabel 0,05 (2,35) = 3,27
LAMPIRAN K
HASIL UJI STATISTIK KEKERASAN TABLET LEPAS LAMBAT
IBUPROFEN
Anova: Single Factor
SUMMARY
Groups Count Sum Average Variance
Column 1 3 53,09 17,70 0,19 Column 2 3 53,89 17,96 0,00 Column 3 3 52,63 17,54 0,14 Column 4 3 52,6 17,53 0,03
ANOVA
Source of
Variation SS df MS F P-value F crit
Between
Groups 0,36 3 0,12 1,36 0,32 4,07 Within
Groups 0,71 8 0,09
Total 1,07 11
Karena F hitung = 1,36 < F tabel 0,05 (3,11) = 3,59; maka H0 diterima dan tidak
LAMPIRAN L
HASIL UJI STATISTIK KERAPUHAN TABLET LEPAS LAMBAT
IBUPROFEN
Anova: Single Factor
SUMMARY
Groups Count Sum Average Variance
Column 1 3 0,50 0,16 1,26E-05 Column 2 3 0,49 0,16 2,49E-05 Column 3 3 0,49 0,16 1,7E-07 Column 4 3 0,49 0,16 5,45E-06
ANOVA
Source of
Variation SS df MS F P-value F crit
Between
Groups 3,32E-05 3 1,11E-05 1,03 0,43 4,07 Within
Groups 8,62E-05 8 1,08E-05
Total 0,000119 11
Karena F hitung = 1,03 < F tabel 0,05 (3,11) = 3,59; maka H0 diterima dan tidak
LAMPIRAN M
HASIL UJI STATISTIK PENETAPAN KADAR TABLET LEPAS
LAMBAT IBUPROFEN
Anova: Single Factor
SUMMARY
Groups Count Sum Average Variance
Column 1 3 299,86 99,95 0,03 Column 2 3 300,83 100,28 0,70 Column 3 3 301,38 100,46 0,18 Column 4 3 302,93 100,98 0,98
ANOVA Source of
Variation SS df MS F P-value F crit
Between
Groups 1,65 3 0,55 1,17 0,38 4,07 Within
Groups 3,77 8 0,47
Total 5,42 11
Karena F hitung = 1,17 < F tabel 0,05 (3,11) = 3,59; maka H0 diterima dan tidak
LAMPIRAN N
HASIL UJI STATISTIK %DE360
Anova: Single Factor
SUMMARY
Groups Count Sum Average Variance
Column 1 3 259,97 86,66 0,06 Column 2 3 115,89 38,63 35,30 Column 3 3 37,37 12,46 3,55 Column 4 3 26,05 8,68 0,45
ANOVA Source of
Variation SS df MS F P-value
F crit Between
Groups 11616,09 3 3872,03 393,51 5,04E-09 4,07 Within
Groups 78,72 8 9,84
Total 11694,81 11
Karena F hitung = 393,51 > F tabel 0,05 (3,11) = 3,59; maka H0 ditolak dan ada
FA FB FC FD
Mean 86,67 38,63 12,46 8,68 FA 86,67 0 -48,03 * -74,2 * -77,97 * FB 38,63 0 -26,17 * -29,95 *
FC 12,46 0 -3,77
FD 8,68 0
Keterangan:
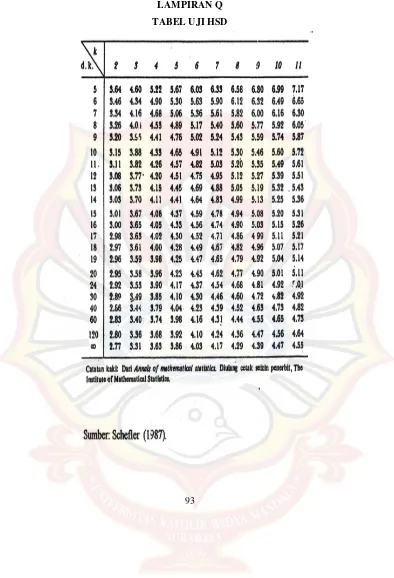
Nilai HSD = 6.336436
LAMPIRAN O
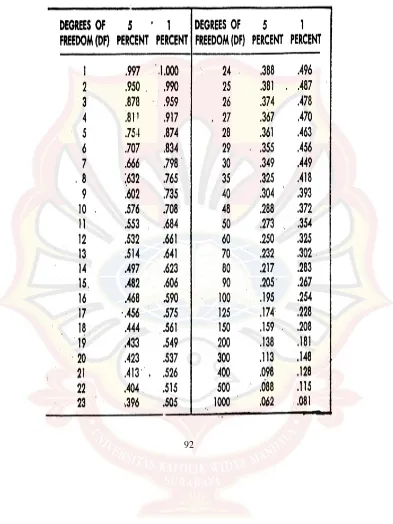
LAMPIRAN P
LAMPIRAN Q
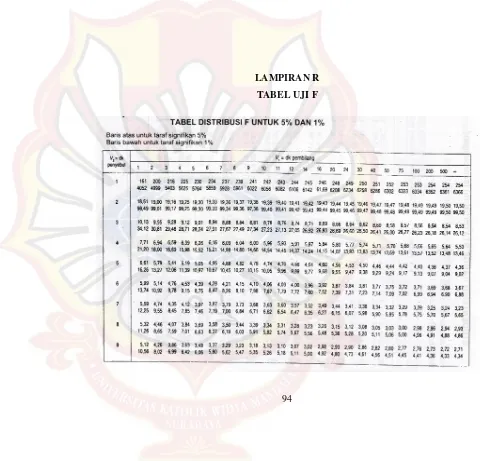
LAMPIRAN R
LAMPIRAN S
ANOVA PERSEN OBAT LARUT 3 JAM
Use your mouse to right click on individual cells for definitions.
Response 1 Persen obat larut 3 jam
ANOVA for selected factorial model
Analysis of variance table [Partial sum of squares - Type III]
Sum of Mean F p-value
Source Squares df Square Value Prob > F
Model 12661.08 3 4220.359 207.3621 < 0.0001 significant A-AKont. Matriks 9161.555 1 9161.555 450.1416 < 0.0001
B-Konst. PVP 2025.661 1 2025.661 99.52831 < 0.0001 AB 1473.862 1 1473.862 72.41635 < 0.0001 Pure Error 162.8209 8 20.35261
Cor Total 12823.9 11
Values of "Prob > F" less than 0.0500 indicate model terms are significant. In this case A, B, AB are significant model terms.
Values greater than 0.1000 indicate the model terms are not significant.
If there are many insignificant model terms (not counting those required to support hierarchy), model reduction may improve your model.
Std. Dev. 4.511387 R-Squared 0.987303
Mean 38.6375 Adj R-Squared 0.982542
C.V. % 11.67619 Pred R-Squared 0.971432 PRESS 366.347 Adeq Precision 31.19293
The "Pred R-Squared" of 0.9714 is in reasonable agreement with the "Adj R-Squared" of 0.9825.
Coefficient Standard 95% CI 95% CI
Factor Estimate df Error Low High VIF
Intercept 38.6375 1 1.302325 35.63433 41.64067 A-AKont. Matriks -27.6308 1 1.302325 -30.634 -24.6277 1
B-Konst. PVP -12.9925 1 1.302325 -15.9957 -9.98933 1
AB 11.0825 1 1.302325 8.079333 14.08567 1
Final Equation in Terms of Coded Factors:
Persen obat larut 3 jam = 38.6375
-27.6308 * A -12.9925 * B
11.0825 * A * B
Final Equation in Terms of Actual Factors:
Persen obat larut 3 jam = 38.6375
The Diagnostics Case Statistics Report has been moved to the Diagnostics Node. In the Diagnostics Node, Select Case Statistics from the View Menu.
Proceed to Diagnostic Plots (the next icon in progression). Be sure to look at the: 1) Normal probability plot of the studentized residuals to check for normality of residuals.
2) Studentized residuals versus predicted values to check for constant error. 3) Externally Studentized Residuals to look for outliers, i.e., influential values.
4) Box-Cox plot for power transformations.
LAMPIRAN T
ANOVA PERSEN OBAT LARUT 6 JAM
Use your mouse to right click on individual cells for definitions. Response 2 Persen obat larut 6 jam ANOVA for selected factorial model
Analysis of variance table [Partial sum of squares - Type III]
Sum of Mean F p-value
Source Squares df Square Value Prob > F
Model 10976.31 3 3658.769 229.1577 < 0.0001 significant A-AKont.
Matriks 8769.613 1 8769.613 549.2626 < 0.0001 B-Konst. PVP 1360.644 1 1360.644 85.2205 < 0.0001 AB 846.0481 1 846.0481 52.99009 < 0.0001 Pure Error 127.7293 8 15.96616
Cor Total 11104.03 11
Values of "Prob > F" less than 0.0500 indicate model terms are significant. In this case A, B, AB are significant model terms.
Values greater than 0.1000 indicate the model terms are not significant.
If there are many insignificant model terms (not counting those required to support hierarchy), model reduction may improve your model.
Std. Dev. 3.995768 R-Squared 0.988497
Mean 43.12833
Adj
R-Squared 0.984183
C.V. % 9.264832
Pred
R-Squared 0.974118
PRESS 287.3909
Adeq
Precision 32.66785
The "Pred R-Squared" of 0.9741 is in reasonable agreement with the "Adj R-Squared" of 0.9842.
Coefficient Standard 95% CI 95% CI
Factor Estimate df Error Low High VIF
Intercept 43.12833 1 1.153479 40.46841
45.7882 6 A-AKont.
Matriks -27.0333 1 1.153479 -29.6933 -24.3734 1 B-Konst. PVP -10.6483 1 1.153479 -13.3083 -7.98841 1
AB 8.396667 1 1.153479 5.73674
11.0565
9 1
Final Equation in Terms of Coded Factors:
Persen obat larut 6
jam =
43.12833 -27.0333 * A -10.6483 * B 8.396667
Final Equation in Terms of Actual Factors:
Persen obat larut 6
jam =
43.12833
-27.0333 * AKont. Matriks -10.6483 * Konst. PVP
8.396667 * AKont. Matriks * Konst. PVP
The Diagnostics Case Statistics Report has been moved to the Diagnostics Node. In the Diagnostics Node, Select Case Statistics from the View Menu.
Proceed to Diagnostic Plots (the next icon in progression). Be sure to look at the: