73 LAMPIRAN A
HASIL UJI STANDARISASI
Hasil Perhitungan Penetapan Susut Pengeringan Simplisia
Replikasi Hasil susut pengeringan
1 8,47
2 8,45
3 8,49
Rata-rata 8,47
Hasil Perhitungan Penetapan Susut Pengeringan Ekstrak Kering
Replikasi Hasil susut pengeringan
1 9,17
2 9,11
3 9,21
Rata-rata 9,16
Hasil Perhitungan Penetapan Kadar Abu Total Simplisia
No
W (krus kosong)
W (Bahan)
W (krus+abu)
% Kadar
Rata-rata
(gram) (gram) (gram) Abu (%)
1 21,5711 2,0062 21,7364 8,2394
74
(berat krus + serbuk) – berat krus kosong berat serbuk
(berat krus + serbuk) – berat krus kosong berat serbuk
75
Hasil Perhitungan Penetapan Kadar Abu Total Ekstrak
No
(berat krus + ekstrak) – berat krus kosong berat ekstrak
(berat krus + ekstrak) – berat krus kosong berat ekstrak
76 Hasil Perhitungan Randemen Estrak
x 100 %
Hasil Perhitungan Kadar Sari Larut Etanol
No
1. Kadar sari larut etanol
= x 100 %
2. Kadar sari larut etanol
= x 100 % berat ekstrak kental berat serbuk
(berat cawan + serbuk) – berat cawan kosong berat serbuk
77 3. Kadar sari larut etanol
= x 100 %
Hasil Perhitungan Kadar Sari Larut Air
No
(berat cawan + serbuk) – berat cawan kosong berat serbuk
(berat cawan + serbuk) – berat cawan kosong berat serbuk
78 pelarut kloroform metanol : air (64:50:10)
Noda A Noda B (berat cawan + serbuk) – berat cawan kosong
berat serbuk
79
6. RfA =
8 3 , 6
= 0,7875 RfB = 8
8 , 6
= 0,8500
7. RfA =
8 7 , 6
= 0,8375 RfB = 8
9 ,
80 LAMPIRAN B
HASIL UJI MUTU FISIK GRANUL
Mutu
fisik Replikasi
Formula Tablet Hisap Ekstrak
Daun Sirih Merah Persyaratan
81
1 10,96 9,77 14,98 9,87 2 10,98 10,14 14,99 9,83
3 10,97 10,06 15,03 10,27 5-15 % Indek 1 9,99 10,08 14,95 10,11 Baik kompresibilitas 2 9,97 10,03 15,08 10,05 sekali
(%) 3 10,01 9,83 14,94 9,82 (Fiese dan 1 10,02 10,02 15,95 10,01 Hagen, 2 10,04 9,96 16,00 9,99 19,86) 3 9,95 9,96 16,05 9,94
82 LAMPIRAN C
HASIL UJI KEKERASAN TABLET HISAP EKSTRAK DAUN SIRIH MERAH
Batch I
No Kekerasan Tablet Hisap Ekstrak Daun Sirih Merah (kp) Formula
I
Formula II
Formula III Formula IV
1 9,7 12,9 12,8 12,8
83 Batch III
No Kekerasan Tablet Hisap Ekstrak Daun Sirih Merah (kp) Formula
I
Formula II Formula III Formula IV
1 9,4 13,8 13,9 9,9
2 8,3 12,4 14,0 9,6
3 8,7 13,3 14,5 10
4 9,7 13,8 13,5 9,8
5 8,3 13,6 13,6 10,3
6 9,5 12,5 14,3 9,7
7 9,1 13,7 13,9 9,6
8 8,9 12,8 13,6 10,3
9 8,6 12,5 13,5 9,9
10 9,6 13,7 13,8 10,2
X 9,01 13,21 13,86 9,93
± ± ± ± ±
84 LAMPIRAN D
85 Batch III
Formula Replikasi
Berat awal (gram)
Berat akhir (gram)
Kerapuhan
(%)
x
±±±±SD1 16,36 16,33 0,1833 0,1834
I 2 16,30 16,27 0,1840 ±
3 16,38 16,35 0,1831 0,0004
1 16,07 16,04 0,1866 0,1859
II 2 16,19 16,16 0,1852 ±
3 16,12 16,09 0,1861 0,0007
1 16,24 16,21 0,1847 0,1847
III 2 16,20 16,17 0,1851 ±
3 16,26 16,23 0,1845 0,0003
1 16,11 16,09 0,1241 0,1236
IV 2 16,18 16,16 0,1236 ±
86 LAMPIRAN E
HASIL UJI WAKTU HANCUR TABLET HISAP EKSTRAK DAUN SIRIH MERAH
Batch I
Batch II
Batch III
Replikasi Waktu Hancur (menit)
Formula I Formula II Formula III Formula IV
1 22,12 20,19 28,16 26,07
2 22,16 20,15 28,10 28,11
3 22,11 20,18 28,13 26,10
x
22,13 20,17 28,13 26,09± ± ± ± ±
SD 0,0265 0,0208 0,0300 0,0208
Replikasi Waktu Hancur (menit)
Formula I Formula II Formula III Formula IV
1 22,09 21,30 28,26 25,57
2 22,11 23,35 29,24 25,51
3 22,06 21,31 28,24 25,53
x
22,08 21,32 28,24 25,53± ± ± ± ±
SD 0,0251 0,0264 0,0115 0,0305
Replikasi Waktu Hancur (menit)
Formula I Formula II Formula III Formula IV
1 21,17 21,29 28,17 25,39
2 21,14 21,27 28,20 25,38
3 21,18 21,22 28,19 25,41
x
21,16 21,26 28,18 25,39± ± ± ± ±
87 LAMPIRAN F
CONTOH PERHITUNGAN
89 LAMPIRAN G
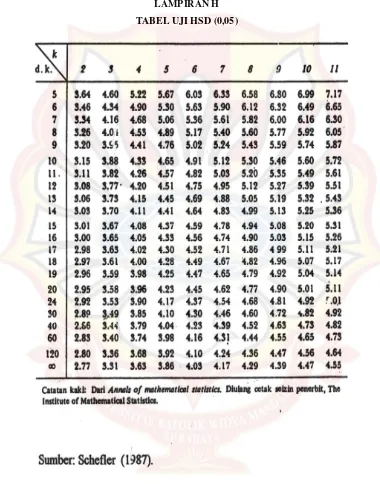
90 LAMPIRAN H
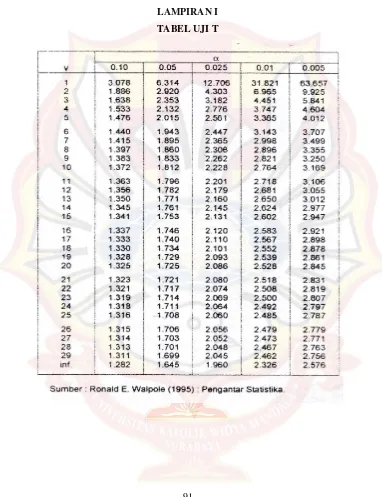
91 LAMPIRAN I
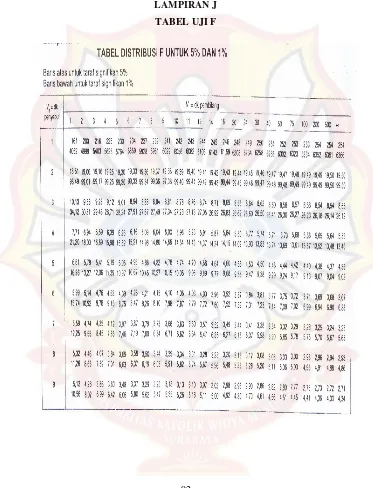
92 LAMPIRAN J
94 LAMPIRAN K
HASIL UJI STATISTIK KEKERASAN TABLET ANTAR FORMULA TABLET HISAP EKSTRAK DAUN SIRIH MERAH
ANOVA
KEKERASAN
Sum of Mean
Source Squares df Square F Sig.
Between Groups 30,374 3 10,125 5,689 ,022 Within Groups 14,239 8 1,780
Total 44,613 11
Hipotesa pengujian :
F hitung > F tabel (0,05) sehingga H ditolak dan ada perbedaan yang bermakna antar formula.
95 % Confidence
F
Interval for Mean
Std. Std. Lower Upper
N Mean Deviation Error Bound Bound Min Max
95 KEKERASAN
HSD
Keterangan :
Symbol * : Perbedaannya signifikan, karena selisih > HSD (5%)
Tanpa symbol : Perbedaannya tidak signifikan, karena selisih < HSD (5%)
Mean
(J) Difference Std. 95 % Confidence Interval
(I) F F (I-J) Error Sig.
Lower
Bound Upper Bound
I II -3,40333* 1,08929 .014 -5,9152 -,8914
III -4,06333* 1,08929 .006 -6,5752 -1,5514
IV -1,58333 1,08929 .184 -4,0952 ,9286
II I 3,40333* 1,08929 .014 ,8914 5,9152
III -,66000 1,08929 .561 -3,1719 1,8519
IV 1,82000 1,08929 .133 -,6919 4,3319
III I 4,06333* 1,08929 .006 1,5514 6,5752
II ,66000 1,08929 .561 -1,8519 3,1719
IV 2,48000 1,08929 .052 -,0319 4,9919
IV I 1,58333 1,08929 .184 -,9286 4,0952
II -1,82000 1,08929 .133 -4,3319 ,6919
96 LAMPIRAN L
HASIL UJI STATISTIK KERAPUHAN TABLET ANTAR FORMULA TABLET HISAP EKSTRAK DAUN SIRIH MERAH
95 % Confidence
F Interval for Mean
Std. Std. Lower Upper
N Mean Deviation Error Bound Bound Min Max
I 3 ,184533 ,0025929 ,0014970 ,178092 ,190975 ,1827 ,1875 II 3 ,185633 ,0008327 ,0004807 ,183565 ,187702 ,1847 ,1863 III 3 ,162667 ,0384230 ,0221835 ,067219 ,258115 ,1183 ,1850 IV 3 ,123433 ,0002082 ,0001202 ,122916 ,123950 ,1232 ,1236 Total 12 ,164067 ,0310112 ,0089522 ,144363 ,183770 ,1183 ,1875
ANOVA
KERAPUHAN
Sum of Mean
Source Squares df Square F Sig.
Between Groups .008 3 .003 6,839 .013
Within Groups .003 8 .000
Total .011 11
Hipotesa pengujian :
97 KERAPUHAN
HSD
Mean
(J) Difference Std. 95 % Confidence Interval
(I) F F (I-J) Error Sig.
Lower
Bound Upper Bound
I II -,0011000 ,0157257 .946 -,037363 ,035163
III ,0218667 ,0157257 .202 -,014397 ,058130
IV ,0611000* ,0157257 .005 ,024837 ,097363
II I ,0011000 ,0157257 .946 -,035163 ,037363
III ,0229667 ,0157257 .182 -,013297 ,059230
IV ,0622000* ,0157257 .004 ,025937 ,098463
III I -,0218667 ,0157257 .202 -,058130 ,014397
II -,0229667 ,0157257 .182 -,059230 ,013297
IV ,0392333* ,0157257 .037 ,002970 ,075497
IV I -,0611000* ,0157257 .005 -,097363 -,024837
II -,0622000* ,0157257 .004 -,098463 -,025937
III -,0392333* ,0157257 .037 -,075497 -,002970
Keterangan :
Symbol * : Perbedaannya signifikan, karena selisih > HSD (5%)
98 LAMPIRAN M
HASIL UJI STATISTIK WAKTU HANCUR TABLET ANTAR FORMULA TABLET HISAP EKSTRAK DAUN SIRIH MERAH
ANOVA
WAKTU HANCUR
Sum of Mean
Source Squares df Square F Sig.
Between Groups 103.786 3 34.595 161,137 .000 Within Groups 1.718 8 .215
Total 11
Hipotesa pengujian :
F hitung > F tabel (0,05) sehingga H ditolak dan ada perbedaan yang bermakna antar formula.
95 % Confidence
F Interval for Mean
Std. Std. Lower Upper
N Mean Deviation Error Bound Bound Min Max
I 3 21,7900 ,54617 ,31533 20,4332 23,1468 21,16 22,13
II 3 20,9177 ,64826 ,37428 19,3073 22,5280 20,17 21,32
III 3 28,1833 ,05508 ,03180 28,0465 28,3201 28,13 28,24
IV 3 25,6700 ,37041 ,21385 24,7499 26,5901 25,39 26,09
99 WAKTU HANCUR
HSD
Mean
(J) Difference Std. 95 % Confidence Interval
(I) F F (I-J) Error Sig.
Lower Bound
Upper Bound
I II ,87233 ,37833 .050 -,0001 1,7448
III -6,39333* ,37833 .000 -7,2658 -5,5209
IV -3,88000* ,37833 .000 -4,7524 -3,0076
II I -,87233 ,37833 .050 -1,7448 ,0001
III -7,26567* ,37833 .000 -8,1381 -6,3932
IV -4,75233* ,37833 .000 -5,6248 -3,8799
III I 6,39333* ,37833 .000 5,5209 7,2658
II 7,26567* ,37833 .000 6,3932 8,1381
IV 2,51333* ,37833 .000 1,6409 3,3858
IV I 3,88000* ,37833 .000 3,0076 4,7524
II 4,75233* ,37833 .000 3,8799 5,6248
III -2,51333* ,37833 .000 -3,3858 -1,6409
Keterangan :
Symbol * : Perbedaannya signifikan, karena selisih > HSD (5%)
100 LAMPIRAN N
HASIL ANOVA UJI KEKERASAN PADA PROGRAM DESIGN EXPERT
Response 1 kekerasan
ANOVA for selected factorial model
Analysis of variance table [Partial sum of squares - Type III] Sum of Mean F pvalue
Source Squares df Square Value Prob>F
Model 30.37 3 10.12 5.69 0.0220 significant A-macam pengikat 3.77 1 3.77 2.12 0.1834
B-macam pengisi 0.64 6 0.64 0.36 0.5655 AB 25.96 1 25.96 14.59 0.0051 Pure Error 14.24 8 1.78
Cor Total 44.61 11
The Model F-value of 5.69 implies the model is significant. There is only a 2.20% chance that a "Model F-Value" this large could occur due to noise.
Values of "Prob > F" less than 0.0500 indicate model terms are significant. In this case AB are significant model terms. Values greater than 0.1000 indicate the model terms are not significant. If there are many insignificant model terms (not counting those required to support hierarchy), model reduction may improve your model.
Std. Dev. 1.33 R-Squared 0.6808 Mean 11.10 Adj R-Squared 0.5612 C.V. % 12.02 Pred R-Squared 0.2819 PRESS 32.04 Adeq Precision 5.275
The "Pred R-Squared" of 0.2819 is not as close to the "Adj R-Squared" of 0.5612
101
Coefficient Standard 95% CI 95% CI Factor Estimate df Error Low High VIF Intercept 11.10 1 0.39 10.21 11.99 A-macam pengikat 0.56 1 0.39 -0.33 1.45 1.00 B-macam pengisi 0.23 1 0.39 -0.66 1.12 1.00 AB -1.47 1 0.39 -2.36 -0.58 1.00
Final Equation in Terms of Coded Factors: kekerasan =
+11.10 +0.56 * A +0.23 * B -1.47 * A * B
Final Equation in Terms of Actual Factors: kekerasan =
+11.09917
+0.56083 * macam pengikat +0.23083 * macam pengisi
-1.47083 * macam pengikat * macam pengisi
The Diagnostics Case Statistics Report has been moved to the Diagnostics Node. In the Diagnostics Node, Select Case Statistics from the View Menu Proceed to Diagnostic Plots (the next icon in progression). Be sure to look at the:
1) Normal probability plot of the studentized residuals to check for normality of 2) Studentized residuals versus predicted values to check for constant error. 3) Externally Studentized Residuals to look for outliers, i.e., influential values. 4) Box-Cox plot for power transformations.
102 LAMPIRAN O
HASIL ANOVA UJI KERAPUHAN PADA PROGRAM DESIGN EXPERT
Response 2 kerapuhan
ANOVA for selected factorial model
Analysis of variance table [Partial sum of squares - Type III] Sum of Mean F p-value
The Model F-value of 6.84 implies the model is significant. There is only a 1.34% chance that a "Model F-Value" this large could occur due to noise.
Values of "Prob > F" less than 0.0500 indicate model terms are significant. In this case A are significant model terms. Values greater than 0.1000 indicate the model terms are not significant.
If there are many insignificant model terms (not counting those required to support hierarchy), model reduction may improve your model. Std. Dev. 0.019 R-Squared 0.7195
Mean 0.16 Adj R-Squared 0.6143 C.V. % 11.74 Pred R-Squared 0.3688 PRESS 6.677E-003 Adeq Precision 5.594
103
Coefficient Standard 95% CI 95% CI
Factor Estimate df Error Low High VIF
Intercept 0.16 1 5.560E-003 0.15 0.18
A-macam pengikat -0.021 1 5.560E-003 -0.034 -8.196E-003 1.00 B-macam pengisi -9.533E-003 1 5.560E-003 -0.022 3.288E-003 1.00
AB -0.010 1 5.560E-003 -0.023 2.738E-003 1.00
Final Equation in Terms of Coded Factors: kerapuhan =
+0.16
-0.021 * A -9.533E-003 * B -0.010 * A * B
Final Equation in Terms of Actual Factors: Kerapuhan =
+0.16407
-0.021017 * macam pengikat -9.53333E-003 * macam pengisi
-0.010083 * macam pengikat * macam pengisi
The Diagnostics Case Statistics Report has been moved to the Diagnostics Node. In the Diagnostics Node, Select Case Statistics from the View Menu. Proceed to Diagnostic Plots (the next icon in progression). Be sure to look at the:
1) Normal probability plot of the studentized residuals to check for normality of residuals.
2) Studentized residuals versus predicted values to check for constant error.
3) Externally Studentized Residuals to look for outliers, i.e., influential values.
4) Box-Cox plot for power transformations.
104 LAMPIRAN P
HASIL ANOVA UJI WAKTU HANCUR PADA PROGRAM DESIGN EXPERT
Response 3 waktu hancur
ANOVA for selected factorial model
Analysis of variance table [Partial sum of squares - Type III] Sum of Mean F p-value Source Squares df Square Value Prob > F
Model 103.81 3 34.60 161.40 < 0.0001 significant A-macam pengikat 93.19 1 93.19 434.65 < 0.0001
B-macam pengisi 8.60 1 8.60 40.12 0.0002 AB 2.02 1 2.02 9.41 0.0154 Pure Error 1.72 8 0.21
Cor Total 105.52 11
The Model F-value of 161.40 implies the model is significant. There is only a 0.01% chance that a "Model F-Value" this large could occur due to noise. Values of "Prob > F" less than 0.0500 indicate model terms are significant. In this case A, B, AB are significant model terms.Values greater than 0.1000 indicate the model terms are not significant. If there are many insignificant model terms (not counting those required to support hierarchy), model reduction may improve your model.
Std. Dev. 0.46 R-Squared 0.9837 Mean 24.14 Adj R-Squared 0.9777 C.V. % 1.92 Pred R-Squared 0.9634 PRESS 3.86 Adeq Precision 27.183
105
Coefficient Standard 95% CI 95% CI Factor Estimate df Error Low High VIF Intercept 24.14 1 0.13 23.83 24.45 A-macam pengikat 2.79 1 0.13 2.48 3.09 1.00 B-macam pengisi -0.85 1 0.13 -1.15 -0.54 1.00 AB -0.41 1 0.13 -0.72 -0.10 1.00
Final Equation in Terms of Coded Factors: waktu hancur =
+24.14 +2.79 * A -0.85 * B -0.41 * A * B
Final Equation in Terms of Actual Factors: waktu hancur =
+24.14000
+2.78667 * macam pengikat -0.84667 * macam pengisi
-0.41000 * macam pengikat * macam pengisi
The Diagnostics Case Statistics Report has been moved to the Diagnostics Node. In the Diagnostics Node, Select Case Statistics from the View Menu. Proceed to Diagnostic Plots (the next icon in progression). Be sure to look at the:
1) Normal probability plot of the studentized residuals to check for normality of residuals.
2) Studentized residuals versus predicted values to check for constant error.
3) Externally Studentized Residuals to look for outliers, i.e., influential values.
4) Box-Cox plot for power transformations.
106 LAMPIRAN Q
HASIL UJI STATISTIK HASIL PERCOBAAN DAN HASIL TEORITIS PADA UJI KEKERASAN
Paired Samples Statistics
Mean N
Std. Deviation
Std. Error Mean
PERCOBAAN 110975 4 183983 ,91991
TEORITIS 111000 4 183572 ,91786
Paired Samples Correlations
N Correlation Sig.
PERCOBAAN 4 1.000 .000
107 Paired Samples Test
Hipotesa Pengujian :
T hitung (-1) < T 0,025 (3) (3,182) sehingga H diterima dan tidak ada perbedaan bermakna antar formula.
PERCOBAAN TEORITIS
Paired Differences
95 % Confidence
Interval for Mean
Mean
Std. Deviation
Std.
Error Lower Upper t df
108 LAMPIRAN R
HASIL UJI STATISTIK HASIL PERCOBAAN DAN HASIL TEORITIS PADA UJI KERAPUHAN
Paired Samples Statistics
Hipotesa pengujian :
Koefisien korelasi dan nilai t tidak dapat dihitung karena standard error dari perbedaannya adalah 0 yang tidak ada perbedaan antara formula.
Mean N
Std. Deviation
Std. Error Mean
109 LAMPIRAN S
HASIL UJI STATISTIK HASIL PERCOBAAN DAN HASIL TEORITIS PADA UJI WAKTU HANCUR
Paired Samples Statistics
Hipotesa pengujian :
Koefisien korelasi dan nilai t tidak dapat dihitung karena standard error dari perbedaannya adalah 0 yang tidak ada perbedaan antara formula.
Mean N
Std. Deviation
Std. Error Mean
PERCOBAAN 24,1400a 4 3,40092 1,70046