LAMPIRAN A
HASIL UJI MUTU FISIK GRANUL
Mutu fisik Yang diuji
Rep lika si
Formula Tablet Sublingual Propranolol HCl
Persyaratan
FA FB FC FD
Waktu alir (detik)
I 7,36 7,66 2,59 2,94 Tidak lebih dari 10 detik
(Banker & Anderson,
1996) II 8,85 8,92 3,88 3,91
III 8,96 6,70 2,78 3,14
X 8,39 7,76 3,08 3,33
SD 0,89 1,11 0,70 0,51
Sudut Diam (derajat)
I 40,02 39,69 38,66 39,69 25-40 Baik (Wells, 1988) II 40,22 39,62 38,06 39,67
III 39,56 39,49 38,71 38,78 X 39,93 39,60 38,48 39,38
SD 0,34 0,10 0,36 0,52
Ideks Kompresibili
tas (persen)
I 19 18 15 20 18-21% dapat
mengalir (Wells, 1988)
II 20 19 14 20
III 20 18 14 20
X 19,67 18,33 14,33 20 SD 0,578 0,58 0,578 0
LAMPIRAN B
HASIL UJI KESERAGAMAN KANDUNGAN TABLET SUBLINGUAL PROPRANOLOL HCl
Hasil Uji Keragaman Kandungan Tablet Formula A Batch I
Abs C sampel W sampel C teoritis
Kadar (persen)
0,387 15,91 362,5 17,19 92,54
0,382 15,65 360,1 16,93 92,41
0,375 15,28 356,8 16,63 91,90
0,371 15,07 356,3 16,58 90,87
0,388 15,96 363,1 17,22 92,68
0,380 15,54 360,4 16,96 91,58
0,378 15,44 358,9 16,83 91,76
0,378 15,44 357,3 16,67 92,62
0,372 15,12 355,4 16,50 91,63
0,370 15,01 350,9 16,08 93,34
X 92,13
SD 0,71
KV 0,77
Hasil Uji Keragaman Kandungan Tablet Formula A Batch II
Abs C sampel W sampel C teoritis
Kadar (persen)
0,360 14,48 343,3 15,39 94,09
0,371 15,07 350,5 16,04 93,94
0,372 15,12 352,3 16,22 93,24
0,371 15,07 350,1 16,00 94,16
0,391 16,12 361,1 17,03 94,64
0,382 15,65 359,2 16,89 92,26
0,378 15,44 358,1 16,75 92,22
0,362 14,59 349,8 15,98 91,28
0,360 14,48 343,3 15,39 94,09
0,363 14,64 348,5 1,86 92,30
X 93,22
Hasil Uji Keragaman Kandungan Tablet Formula A Batch III
Abs C sampel W sampel C teoritis
Kadar (persen)
0,374 15,22 350,1 16,00 95,10
0,375 15,28 351,2 16,11 94,88
0,368 14,91 345,9 15,62 95,43
0,375 15,28 358,2 16,75 91,20
0,372 15,12 355,5 16,51 91,61
0,377 15,38 356,3 16,58 92,27
0,366 14,80 347,8 15,87 93,26
0,370 15,01 347,2 15,74 95,34
0,368 14,91 352,0 16,18 92,14
0,371 15,07 352,4 16,22 92,91
X 93,41
SD 1,64
KV 1,75
Hasil Uji Keragaman Kandungan Tablet Formula B Batch I
Abs C sampel W sampel C teoritis
Kadar (persen)
0,367 14,85 347,2 15,74 94,33
0,392 16,18 364,7 17,37 93,15
0,390 16,07 360,1 16,93 94,89
0,392 16,18 364,1 17,31 93,47
0,366 14,80 347,3 15,76 93,92
0,381 15,59 350,5 16,04 97,18
0,380 15,54 350,2 16,00 97,07
0,385 15,81 351,1 16,10 98,20
0,392 16,18 364,7 17,37 93,15
0,395 16,33 362,9 17,20 94,93
X 95,03
SD 1,83
KV 1,92
Hasil Uji Keragaman Kandungan Tablet Formula B Batch II
Abs C sampel W sampel C teoritis
Kadar (persen)
0,392 16,18 364,7 17,37 93,15
0,394 16,28 365,0 17,41 93,35
0,390 16,07 365,2 17,40 92,28
0,391 16,12 360,8 17,00 94,83
0,388 15,96 350,2 16,10 99,69
0,389 16,02 352,8 16,26 98,53
0,380 15,54 348,9 15,90 97,74
0,392 16,18 358,7 16,81 96,63
0,393 16,23 360,1 16,93 95,84
0,388 15,96 355,4 16,50 96,72
X 95,88
SD 2,45
KV 2,56
Hasil Uji Keragaman Kandungan Tablet Formula B Batch III Abs C sampel W sampel C teoritis
Kadar (persen)
0,377 15,38 355,6 16,52 93,10
0,372 15,12 352,2 16,20 93,33
0,380 15,54 361,0 17,02 91,31
0,381 15,59 363,5 17,26 90,32
0,379 15,49 358,2 16,75 92,46
0,370 15,01 350,1 16,00 93,79
0,378 15,44 355,6 16,52 93,46
0,382 15,65 362,9 17,20 90,98
0,381 15,59 361,3 17,05 91,42
0,370 15,01 360,5 16,97 88,43
X 91,86
SD 1,69
Hasil Uji Keragaman Kandungan Tablet Formula C Batch I Abs C sampel W sampel C teoritis
Kadar (persen)
0,358 14,38 349,7 15,89 90,52
0,356 14,27 346,2 15,66 91,13
0,356 14,27 346,5 15,68 91,00
0,359 14,43 348,0 15,82 91,22
0,360 14,48 352,1 16,20 89,4
0,367 14,85 358,2 16,75 88,64
0,366 14,80 355,0 16,46 89,90
0,362 14,59 351,9 16,18 90,19
0,360 14,48 350,7 16,06 90,15
0,372 15,12 358,2 16,75 90,25
X 90,24
SD 0,80
KV 0,90
Hasil Uji Keragaman Kandungan Tablet Formula C Batch II Abs C sampel W sampel C teoritis
Kadar (persen)
0,355 14,22 346,6 15,69 90,65
0,357 14,33 348,0 15,82 90,59
0,350 13,96 346,5 15,68 89,02
0,369 14,96 358,1 16,75 89,32
0,361 14,54 350,2 16,00 90,82
0,365 14,75 350,5 16,04 91,94
0,366 14,80 361,7 17,08 86,64
0,355 14,22 347,5 15,78 90,13
0,357 14,33 348,0 15,82 90,59
0,354 14,17 346,6 15,69 90,33
X 90,00
SD 1,43
KV 1,59
Hasil Uji Keragaman Kandungan Tablet Formula C Batch III Abs C sampel
W
sampel C teoritis
Kadar (persen)
0,348 13,85 345,9 15,62 88,64
0,350 13,96 348,0 15,82 88,25
0,350 13,96 348,2 15,84 88,14
0,359 14,43 355,8 16,50 87,25
0,352 14,06 350,0 16,00 87,88
0,351 14,01 351,2 16,11 86,93
0,349 13,90 347,1 15,74 88,32
0,362 14,59 360,0 16,93 86,18
0,350 13,96 348,2 15,84 88,14
0,352 14,06 351,2 16,11 87,30
X 87,70
SD 0,76
KV 0,87
Hasil Uji Keragaman Kandungan Tablet Formula D Batch I Abs C sampel
W
sampel C teoritis
Kadar (persen)
0,384 15,75 359,2 16,85 93,46
0,380 15,54 352,0 16,18 96,03
0,381 15,59 355,4 16,50 94,48
0,380 15,54 352,4 16,22 95,80
0,391 16,12 361,2 17,04 94,61
0,390 16,07 360,4 16,97 94,70
0,378 15,44 348,2 15,84 97,49
0,379 15,49 349,0 15,90 97,39
0,395 16,33 364,7 17,37 94,01
0,381 15,59 354,2 16,38 95,15
X 95,31
SD 1,36
Hasil Uji Keragaman Kandungan Tablet Formula D Batch II Abs C sampel
W
sampel C teoritis
Kadar (persen)
0,384 15,75 354,8 16,44 95,79
0,385 15.81 355,0 16,46 96,04
0,384 15,75 354,2 16,38 96,13
0,378 15,44 348,1 15,82 97,58
0,392 16,18 360,2 16,95 95,46
0,394 16,28 362,0 17,12 95,11
0,388 15,96 359,1 16,85 94,74
0,388 15,96 359,7 16,90 94,46
0,384 15,75 354,2 16,38 96,13
0,383 15,70 349,8 15,98 98,24
X 95,97
SD 1,18
KV 1,23
Hasil Uji Keragaman Kandungan Tablet Formula D Batch III Abs C sampel
W
sampel C teoritis
Kadar (persen)
0,385 15,81 355,5 16,51 95,79
0,385 15,81 355,8 16,54 95,59
0,388 15,96 359,0 16,83 94,82
0,379 15,49 348,9 15,90 97,42
0,395 16,33 362,3 17,14 95,26
0,393 16,23 360,1 16,93 95,84
0,396 16,39 366,2 17,51 93,58
0,384 15,75 354,7 16,43 95,87
0,388 15,96 359,0 16,83 94,82
0,384 15,75 354,7 16,43 95,87
X 95,49
SD 0,99
KV 1,04
LAMPIRAN C
HASIL UJI KEKERASAN TABLET SUBLINGUAL PROPRANOLOL HCl
BATCH I
No Kekerasan Tablet Sublingual Propranolol HCl (kp)
FA FB FC FD
1 5,5 4,6 6,5 6,4
2 5,4 4,6 6,5 6,2
3 5,5 4,4 6,5 6,6
4 5,5 4,4 6,5 6,4
5 5,7 4,5 6,4 6,3
6 5,5 4,4 7,1 6,2
7 5,4 4,4 6,4 6,6
8 5,4 4,4 6,8 6,1
9 5,4 4,4 6,5 6,2
10 5,6 4,4 6,5 6,2
X ± SD 5,49 ± 0,10 4,45 ± 0,08 6,57 ± 0,22 6,32 ± 0,18
SD rel (%) 1,81 1,91 3,29 2,77
BATCH II
No Kekerasan Tablet Sublingual Propranolol HCl (kp)
FA FB FC FD
1 5,3 4,6 6,4 6,0
2 5,3 4,4 6,5 6,0
3 5,6 4,4 6,2 6,2
4 5,3 4,4 6,4 6,1
5 5,5 4,2 6,5 6,0
6 5,3 4,4 6,4 6,0
7 5,6 4,5 6,4 6,1
8 5,3 4,4 6,4 6,0
9 5,5 4,4 6,5 6,2
10 5,3 4,5 6,4 6,1
X ± SD 5,40 ± 0,13 4,42 ± 0,10 6,41 ± 0,09 6,07 ± 0,08
BATCH III
No Kekerasan Tablet Sublingual Propranolol HCl (kp)
FA FB FC FD
1 5,2 4,5 6,6 6,1
2 5,3 4,5 6,6 6,3
3 5,2 4,7 6,5 6,1
4 5,2 4,5 6,6 6,1
5 5,4 4,7 6,6 6,1
6 5,4 4,5 6,6 6,2
7 5,1 4,5 6,6 6,3
8 5,4 4,7 7,1 5,9
9 5,3 4,6 6,7 6,3
10 5,2 4,6 6,6 6,3
X ± SD 5,27 ± 0,11 4,58 ± 0,09 6,65 ± 0,16 6,17 ± 0,13
SD rel (%) 2,01 2,01 2,48 2,17
LAMPIRAN D
HASIL UJI KERAPUHAN TABLET SUBLINGUAL PROPRANOLOL HCl
Formula Replikasi Berat awal (gram)
Berat akhir (gram)
Kerapuhan
(%) SD X ± SD rel (%)
A 1 6,96 6,94 0,29 0,25
2 6,95 6,93 0,29 ± 30,43
3 6,38 6,37 0,16 0,08
B 1 6,98 6,96 0,29 0,30
2 6,90 6,88 0,29 ± 5,77
3 6,35 6,33 0,32 0,02
C 1 6,77 6,76 0,15 0,15
2 6,88 6,87 0,15 ± 3,77
3 6,44 6,43 0,16 0,01
D 1 6,35 6,33 0,32 0,31
2 6,63 6,61 0,30 ± 3,23
LAMPIRAN E
HASIL UJI WAKTU HANCUR TABLET SUBLINGUAL PROPRANOLOL HCl
Replikasi Waktu Hancur (menit)
FA FB FC FD
1
4 2 6 7
2
4 3 6 6
3
2 2 5 5
X ± SD
3,33± 1,15
2,33 ± 0,58
5,67 ± 0,58
6,00 ± 1,00
LAMPIRAN F
HASIL PENETAPAN KADAR TABLET SUBLINGUAL PROPRANOLOL HCl
BATCH I Formula Repli
kasi Absor bansi Csampel (µg/ml) Cteoritis (µg/ml) Kadar
(%) X±SD SD rel (%) 1 0,375 15,28 356,8 16,63 91,80
A 2 0,378 15,44 357,3 16,67 ± 0,96
3 0,371 15,07 356,3 16,58 0,88
1 0,395 16,33 362,9 17,20 93,85
B 2 0,392 16,18 364,7 17,37 ± 1,01
3 0,392 16,18 364,1 17,31 0,95
1 0,367 14,85 358,2 16,75 91,12
C 2 0,366 14,80 355,0 16,46 ± 0,12
3 0,360 14,48 350,7 16,06 0,11
1 0,380 15,54 352,0 16,18 96,97
D 2 0,379 15,49 349,0 15,90 ± 0,84
3 0,378 15,44 348,2 15,84 0,82
BATCH II Formula Repli
kasi Absor bansi Csampel (µg/ml) Cteoritis (µg/ml) Kadar
(%) X±SD SD rel (%) 1 0,391 16,12 361,1 17,03 94,30
A 2 0,360 14,48 343,3 15,39 ± 0,32
3 0,371 15,07 350,1 16,00 0,30
1 0,389 16,02 352,8 16,26 97,03
B 2 0,380 15,54 348,9 15,90 ± 2,01
3 0,391 16,12 360,8 17,00 1,95
1 0,350 13,96 346,5 15,68 91,03
C 2 0,354 14,17 346,6 15,69 ± 0,91
3 0,365 14,75 350,5 16,04 0,83
1 0,378 15,44 348,1 15,82 97,32
D 2 0,384 15,75 354,2 16,38 ± 1,11
BATCH III Formula Repli
kasi
Absor bansi
Csampel (µg/ml)
Cteoritis (µg/ml)
Kadar
(%) X±SD SD rel (%) 1 0,375 15,28 351,2 16,11 95,22
A 2 0,368 14,91 345,9 15,62 ± 0,31
3 0,370 15,01 347,2 15,74 0,30
1 0,379 15,49 358,2 16,75 91,58
B 2 0,380 15,54 361,0 17,02 ± 0,85
3 0,382 15,65 362,9 17,20 0,78
1 0,348 13,85 345,9 15,62 88,40
C 2 0,349 13,90 347,1 15,74 ± 0,24
3 0,350 13,96 348,0 15,82 0,21
1 0,379 15,49 348,9 15,90 96,29
D 2 0,384 15,75 354,7 16,43 ± 1,02
3 0,385 15,81 355,8 16,54 0,99
LAMPIRAN G
HASIL UJI DISOLUSI TABLET SUBLINGUAL PROPRANOLOL HCl
FORMULA A
FORMULA B
t A C
sampel FP
C
sesungguhnya Wt
% obat terlarut
15
1,1329 38,55 2 38,55 77,11 96,38
1,1423 39,02 2 39,02 78,04 97,54
1,1462 40,05 2 40,05 80,11 100,14
X±SD 98,02 ±
1,93 FORMULA C
t A C
sampel FP
C
sesungguhnya Wt
% obat terlarut
15
1,1124 37,54 2 37,54 75,08 93,85
1,1222 38,03 2 38,03 76,05 95,06
1,1071 37,28 2 37,28 74,56 93,20
X±SD 94,04 ±
0,94
t A C
sampel FP
C
sesungguhnya Wt
% obat terlarut
15
1,0212 33,04 2 33,04 66,08 82,60
1,0331 33,63 2 33,63 67,25 84,06
1,0735 35,62 2 35,62 71,24 89,05
X±SD 85,24 ±
FORMULA D
t A C
sampel FP
C
sesungguhnya Wt
% obat terlarut
15
1,1387 38,84 2 38,84 77,68 97,10
1,1394 38,87 2 38,87 77,75 97,19
1,1467 39,24 2 39,24 78,47 98,09
X±SD 97,46 ±
0,55
LAMPIRAN H CONTOH PERHITUNGAN
Contoh perhitungan sudut diam:
Formula A:
W persegi panjang = 5,11 gram W lingkaran = 0,76 gram Luas persegi panjang = 707,35 cm2
Luas lingkaran = 707,35
11 , 5 76 , 0
= 105,20 cm2 L = .r2
r2 =
π L = 1 , 3 20 , 105
r = 5,79 cm tg =
r t = 79 , 5 78 , 4 =39,54
Contoh perhitungan indeks kompresibilitas:
Formula A :
Berat gelas = 119,21 g (W1)
Berat gelas + granul = 178,89 g (W2) V1 = 100 ml
V2 = 85 m
Bj mampat = 2 1 2 ) ( V W W =
80 ) 21 , 119 89 , 178
( = 0,7460
% kompresibilitas = x100%
mampat . Bj nyata . Bj 1
= 20,0%
Contoh perhitungan akurasi dan presisi
% Baha n Aktif (mg) Xantha n Gum (mg) Avic el pH 101 (mg) Matri k (mg) Aquade st Pipe t (ml) Aquade st Kon s 10 0
40 15,5 248 46,5 50 0,2 10 16,3
4
Absorbansi = 0,383 → y = 0,0189x+0,0859 Konsentrasi sebenarnya = 15,7 ppm Konsentrasi teoritis = 16,34 ppm
% perolehan kembali = (konsentrasi sebenarnya / konsentrasi teoritis) x 100%
= (15,7/ 16,34) x 100% = 96,08%
Untuk menghitung % KV = x100% X SD
= 100%
80 , 96 4898 , 0 x
= 0,5060 %
LAMPIRAN I
Sertifikat Analisis Xanthan Gum
LAMPIRAN J
TABEL UJI r
Dikutip dari: Soedigdo & Soedigdo (1977)
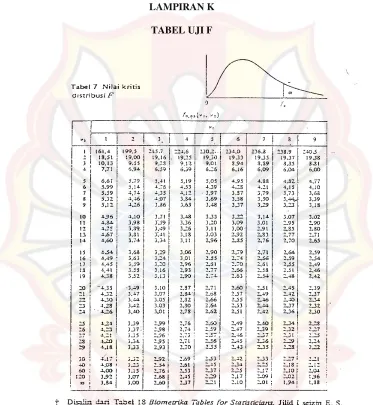
LAMPIRAN K
LAMPIRAN L
UJI F KURVA BAKU PENETAPAN KADAR
REPLIKASI I
KONSENTRASI ABSORBANSI X2 Y2 XY
2,004 0,150 4,0160 0,0225 0,3006
8,016 0,259 64,25625 0,0670 2,0761
14,028 0,374 196,7847 0,1398 5,2464
20,04 0,486 401,6016 0,2361 9,7394
26,052 0,599 678,7067 0,3588 15,6051
32,064 0,710 1028,1001 0,5041 22,7654
38,076 0,823 1449,7818 0,6773 31,3365
3823,2473 2,0056 87,0695 REPLIKASI II
KONSENTRASI ABSORBANSI X2 Y2 XY
2,004 0,117 4,0160 0,0136 0,2344
8,016 0,239 64,2562 0,0571 1,9158
14,028 0,363 196,7848 0,1317 5,0921
20,040 0,459 401,6016 0,2106 9,1983
26,052 0,579 678,7067 0,3352 15,0841
32,064 0,698 1028,1000 0,4872 22,3806
38,076 0,801 1449,7820 0,6416 30,4988
3823,2473 1,8770 84,4041 REPLIKASI III
KONSENTRASI ABSORBANSI X2 Y2 XY
2,008 0,132 4,0320 0,0174 0,2650
8,032 0,239 64,5130 0,0571 1,9196
14,056 0,360 197,5710 0,1296 5,0601
20,080 0,465 403,2060 0,2162 9,3372
26,104 0,585 681,4190 0,3422 15,2708
32,128 0,715 1032,2100 0,5112 22,9715
38,152 0,825 1455,5800 0,6806 31,4754
3838,531 1,9543 86,2996
S X2 SXY S Y2 N SSi RDF Regresi I 3823,4700 87,0697 2,0058 7 0,0231 6
Regresi
II 3823,4700 84,4044 1,8773 7 0,0140 6
Regresi
III 3838,5250 86,2998 1,9544 7 0,0142 6
11485,465 257,7739 5,8376 0,0523 Ssc = 0,052280307
LAMPIRAN M
UJI F KURVA BAKU DISOLUSI
REPLIKASI I
KONSENTRASI ABSORBANSI X2 Y2 XY
10,04 0,400 100,8016 0,1600 4,0160
25,10 0,969 630,0100 0,9389 24,3210
40,16 1,251 1612,8256 1,5650 50,2401
55,22 1,487 3049,2484 2,2111 82,1121
70,28 1,772 4939,2784 3,1399 124,5361
85,34 2,085 7282,9156 4,3472 177,9339
100,4 2,329 10080,1600 5,4242 233,8316
27695,2396 17,7863 696,9908 REPLIKASI II
KONSENTRASI ABSORBANSI X2 Y2 XY
10,02 0,410 100,4004 0,1681 4,1082
25,05 1,024 627,5025 1,0485 25,6512
40,08 1,310 1606,4060 1,7161 52,5048
55,11 1,580 3037,1120 2,4964 87,0738
70,14 1,871 4919,6200 3,5006 131,2319
85,17 2,193 7253,9290 4,8092 186,7778
100,20 2,469 10040,0400 6,0959 247,3938
27585,0099 19,8648 734,7415 REPLIKASI III
KONSENTRASI ABSORBANSI X2 Y2 XY
10,02 0,421 100,4004 0,1772 4,2184
25,05 1,002 627,5025 1,0040 25,1001
40,08 1,298 1606,4060 1,6848 52,0238
55,11 1,586 3037,1120 2,5153 87,4044
70,14 1,873 4919,6200 3,5081 131,3722
85,17 2,197 7253,9290 4,8268 187,1185
100,20 2,459 10040,0400 6,0466 246,3918
27585,0099 19,7628 733,6292
S X2 SXY S Y2 N SSi RDF Regresi
I 27695.24 696.9918 17.7865 7 0.2457 6
Regresi
II 27585.01 734.7415 19.8350 7 0.2647 6
Regresi
III 27585.01 733.6629 19.7630 7 0.2502 6 82865.26 2165.3962 57.3845 0,7996 Ssc = 0,799542417
LAMPIRAN N
HASIL UJI ANAVA KEKERASAN TABLET DENGAN DESIGN-EXPERT
Use your mouse to right click on individual cells for definitions.
Response 1 Kekerasan
ANOVA for selected factorial model
Analysis of variance table [Partial sum of squares - Type III]
Sum of Mean F p-va
Source Squares df Square Value Prob
Model 7.55 7.55 3 2.52 200.39 < 0.0001 significant A-Xanthan gum 1.19 1 1.19 94.81 < 0.0001 B-Avicel pH 101 6.13 1 6.13 488.50 < 0.0001
AB 0.22 1 0.22 17.85 0.0029 Pure Error 0.10 8 0.013
Cor Total 7.65 11
The Model F-value of 200.39 implies the model is significant. There is only
a 0.01% chance that a "Model F-Value" this large could occur due to noise. Values of "Prob > F" less than 0.0500 indicate model terms are significant. In this case A, B, AB are significant model terms.
Values greater than 0.1000 indicate the model terms are not significant. If there are many insignificant model terms (not counting those required to support hierarchy),
model reduction may improve your model.
Std. Dev. 0.11 R-Squared 0.9869
Mean 5.65 Adj R-Squared 0.9819
C.V. % 1.98 Pred R-Squared 0.9705
PRESS 0.23 Adeq Precision 31.839
The "Pred R-Squared" of 0.9705 is in reasonable agreement with the "Adj R-Squared" of 0.9819.
"Adeq Precision" measures the signal to noise ratio. A ratio greater than 4 is desirable. Your
ratio of 31.839 indicates an adequate signal. This model can be used to navigate the design space.
Coefficient Standard 95%CI 95%CI Factor Estimate df Error Low High VIF Intercept 5.65 1 0.032 5.58 5.72 A-Xanthan gum -0.32 1 0.032 0.39 -0.24 1.00 B-Avicel pH 101 0.71 1 0.032 0.64 0.79 1.00 AB 0.14 1 0.032 0.062 0.21 1.00
Final Equation in Terms of Coded Factors:
Kekerasan = 5.65
-0.32 * A 0.71 * B
0.14 * A * B
Final Equation in Terms of Actual Factors:
Kekerasan =
4.59250
-0.36250 * Xanthan gum 0.025500 * Avicel pH 101
3.41667E-003 * Xanthan gum * Avicel pH 101
The Diagnostics Case Statistics Report has been moved to the Diagnostics Node.
In the Diagnostics Node, Select Case Statistics from the View Menu. Proceed to Diagnostic Plots (the next icon in progression). Be sure to look at the:
1) Normal probability plot of the studentized residuals to check for normality of residuals.
2) Studentized residuals versus predicted values to check for constant error. 3) Externally Studentized Residuals to look for outliers, i.e., influential values.
4) Box-Cox plot for power transformations.
LAMPIRAN O
HASIL UJI ANAVA KERAPUHAN TABLET DENGAN DESIGN-EXPERT
Use your mouse to right click on individual cells for definitions.
Response 2 Kerapuhan
ANOVA for selected factorial model
Analysis of variance table [Partial sum of squares - Type III]
Sum of Mean F p-value
Source Squares df Square Value Prob > F
Model 0.046 3 0.015 10.17 0.0042 significant A-Xanthan gum 0.033 1 0.033 21.8 0.0016
B-Avicel pH 101 5.208E-003 1 5.208E-003 3.43 0.1010 AB 8.008E-003 1 8.008E-003 5.28 0.0506 Pure Error 0.012 8 1.517E-003
Cor Total 0.058 11
The Model F-value of 10.17 implies the model is significant. There is only a 0.42% chance that a "Model F-Value" this large could occur due to noise. Values of "Prob > F" less than 0.0500 indicate model terms are significant. In this case A are significant model terms.
Values greater than 0.1000 indicate the model terms are not significant. If there are many insignificant model terms (not counting those required to support hierarchy),
model reduction may improve your model.
Std. Dev. 0.039 R-Squared 0.7923 Mean 0.25 Adj R-Squared 0.7144 C.V. % 15.42 Pred R-Squared 0.5327 PRESS 0.027 Adeq Precision 6.968
The "Pred R-Squared" of 0.5327 is in reasonable agreement with the "Adj R-Squared" of 0.7144.
"Adeq Precision" measures the signal to noise ratio. A ratio greater than 4 is desirable. Your
ratio of 6.968 indicates an adequate signal. This model can be used to navigate the design space.
Coefficient Standart 95%CI 95%CI
Factor Estimate df Error Low High VIF Intercept 0.25 1 0.011 0.23 0.28
A-Xanthan gum 0.52 1 0.011 0.027 0.078 1.00 B-Avicel pH 101 -0.021 1 0.011 -0.047 5.091E-003 1.00 AB 0.026 1 0.011 -9.141E-005 0.052 1.00
Final Equation in Terms of Coded Factors:
Kerapuhan = 0.25
0.052 * A -0.021 * B 0.026 * A * B Final Equation in Terms of Actual Factors:
Kerapuhan = 0.35250
-0.012500 * Xanthan gum -2.97917E-003 * Avicel pH 101
6.45833E-004 * Xanthan gum * Avicel pH 101 The Diagnostics Case Statistics Report has been moved to the Diagnostics Node.
In the Diagnostics Node, Select Case Statistics from the View Menu. Proceed to Diagnostic Plots (the next icon in progression). Be sure to look at the:
1) Normal probability plot of the studentized residuals to check for normality of residuals.
2) Studentized residuals versus predicted values to check for constant error. 3) Externally Studentized Residuals to look for outliers, i.e., influential values.
4) Box-Cox plot for power transformations.
LAMPIRAN P
HASIL UJI ANAVA WAKTU HANCUR TABLET DENGAN
DESIGN-EXPERT
Use your mouse to right click on individual cells for definitions.
Response 3 Waktu hancur
ANOVA for selected factorial model
Analysis of variance table [Partial sum of squares - Type III]
Sum of Mean F p-value
Source Squares df Square Value Prob > F
Model 28.67 3 9.56 12.74 0.0020 significant A-Xanthan gum 0.33 1 0.33 0.44 0.5237
B-Avicel pH 101 27.00 1 27.00 36.00 0.0003 AB 1.33 1 1.33 1.78 0.2191 Pure Error 6.00 8 0.75
Cor Total 34.67 11
The Model F-value of 12.74 implies the model is significant. There is only a 0.20% chance that a "Model F-Value" this large could occur due to noise. Values of "Prob > F" less than 0.0500 indicate model terms are significant. In this case B are significant model terms.
Values greater than 0.1000 indicate the model terms are not significant. If there are many insignificant model terms (not counting those required to support hierarchy),
model reduction may improve your model.
Std. Dev. 0.87 R-Squared 0.8269 Mean 4.33 Adj R-Squared 0.7620 C.V. % 19.99 Pred R-Squared 0.6106 PRESS 13.50 Adeq Precision 7.333
The "Pred R-Squared" of 0.6106 is in reasonable agreement with the "Adj R-Squared" of 0.7620.
"Adeq Precision" measures the signal to noise ratio. A ratio greater than 4 is desirable. Your
ratio of 7.333 indicates an adequate signal. This model can be used to navigate the design space.
Coefficient Standard 95% CI 95% CI Factor Estimate df Error Low High VIF Intercept 4.33 1 0.25 3.76 4.91
A-Xanthan gum -0.17 1 0.25 -0.7 40.41 1.00 B-Avicel pH 101 1.50 1 0.25 0.9 22.08 1.00 AB 0.33 1 0.25 -0.2 40.91 1.00
Final Equation in Terms of Coded Factors:
Waktu hancur = 4.33
-0.17 * A 1.50 * B 0.33 * A * B
Final Equation in Terms of Actual Factors:
Waktu hancur = 1.58333
-0.58333 * Xanthan gum 0.050000 * Avicel pH 101
8.33333E-003 * Xanthan gum * Avicel pH 101
The Diagnostics Case Statistics Report has been moved to the Diagnostics Node.
In the Diagnostics Node, Select Case Statistics from the View Menu. Proceed to Diagnostic Plots (the next icon in progression). Be sure to look at the:
1) Normal probability plot of the studentized residuals to check for normality of residuals.
2) Studentized residuals versus predicted values to check for constant error. 3) Externally Studentized Residuals to look for outliers, i.e., influential values.
4) Box-Cox plot for power transformations.
LAMPIRAN Q
HASIL UJI ANAVA DISOLUSI TABLET DENGAN DESIGN-EXPERT
Use your mouse to right click on individual cells for definitions.
Response 4 Disolusi
ANOVA for selected factorial model
Analysis of variance table [Partial sum of squares - Type III]
Sum of Mean F p-value
Source Squares df Square Value Prob > F
Model 313.62 3 104.54 25.60 0.0002 significant A-Xanthan gum 196.99 1 196.99 48.23 0.0001
B-Avicel pH 101 65.71 1 65.71 16.09 0.0039 AB 50.92 1 50.92 12.47 0.0077 Pure Error 32.67 8 4.08
Cor Total 346.30 11
The Model F-value of 25.60 implies the model is significant. There is only a 0.02% chance that a "Model F-Value" this large could occur due to noise. Values of "Prob > F" less than 0.0500 indicate model terms are significant. In this case A, B, AB are significant model terms.
Values greater than 0.1000 indicate the model terms are not significant. If there are many insignificant model terms (not counting those required to support hierarchy),
model reduction may improve your model.
Std. Dev. 2.02 R-Squared 0.9056 Mean 93.69 Adj R-Squared 0.8703 C.V. % 2.16 Pred R-Squared 0.7877 PRESS 73.52 Adeq Precision 10.956
The "Pred R-Squared" of 0.7877 is in reasonable agreement with the "Adj R-Squared" of 0.8703.
"Adeq Precision" measures the signal to noise ratio. A ratio greater than 4 is desirable. Your ratio of 10.956 indicates an adequate signal. This model can be used to navigate the design space.
Coefficient Standard 95% CI 95% CI Factor Estimate df Error Low High VIF Intercept 93.69 1 0.58 92.34 95.03 A-Xanthan gum 4.05 1 0.58 2.71 5.40 1.00 B-Avicel pH 101 -2.34 1 0.58 -3.69 0.99 1.00 AB 2.06 1 0.58 0.71 3.41 1.00 Final Equation in Terms of Coded Factors:
Disolusi = 93.69
4.05 * A -2.34 * B 2.06 * A * B
Final Equation in Terms of Actual Factors:
Disolusi = 103.90083
-1.06417 * Xanthan gum -0.27150 * Avicel pH 101
0.051500 * Xanthan gum * Avicel pH 101
The Diagnostics Case Statistics Report has been moved to the Diagnostics Node.
In the Diagnostics Node, Select Case Statistics from the View Menu. Proceed to Diagnostic Plots (the next icon in progression). Be sure to look at the:
1) Normal probability plot of the studentized residuals to check for normality of residuals.
2) Studentized residuals versus predicted values to check for constant error. 3) Externally Studentized Residuals to look for outliers, i.e., influential values.
4) Box-Cox plot for power transformations.