LAMPIRAN A
PERHITUNGAN STATISTIK UNTUK MENGETAHUI PERBEDAAN BERMAKNA ANTAR PERSAMAAN REGRESI
Data kurva baku Atenolol dalam larutan dapar fosfat isotonis pH 6,8 pengujian 1
Data kurva baku Atenolol dalam larutan dapar fosfat isotonis pH 6,8
74242,878 377,1067 1,9223 1,9070
SSc = [( ) / ]
LAMPIRAN B
PERHITUNGAN AKURASI DAN PRESISI Data Akurasi
Replikasi Kadar (%) Konsentrasi Replikasi Serapan
(A)
Rata-rata 100,07
SD 0,98
Contoh perhitungan :
Dari hasil serapan dimasukkan kedalam persamaan kurva baku terpilih yaitu :
y = 0,0069 + 4,7662.10-3x Dimana :
y = Serapan
x = Konsentrasi teramati
Kemudian hitung % perolehan kembali dengan rumus :
Misal : data replikasi 1 y = 0,0069 + 4,7662.10-3x 0,102 = 0,0069 + 4,7662.10-3x x = 19,961
LAMPIRAN C
Perhitungan Hasil Uji Penetapan Kadar Film Atenolol Formula Replikasi Serapan
(A)
= (0,105 – 0,006863439) / 0,00476615 = 20,590
Nilai a dan b berasal dari perhitungan regresi linear pada hari ke-2.
Cteoritis = Penimbangan / Luas sediaan = 91,7 / 91,5624
= 1,002
% Kadar = C(mg/cm2) / C teoritis x 100 = 1,030 / 1,002 x100
= 102,797 %
LAMPIRAN D
Perhitungan Hasil Uji Homogenitas Film Atenolol
F R Absorbansi (A) Konsentrasi
Titik 1,2 dan 3 = Pengambilan sediaan pada tiga titik/tempat yang berbeda
LAMPIRAN E
Perhitungan Hasil Uji Indeks Pengembangan Formula 1
W1 = Berat awal sediaan film
LAMPIRAN F
Perhitungan Hasil Uji Lama Merekat
Formula Replikasi (menit) Rata-rata ± SD
1 2 3
F1 110 105 118 111,000 ± 6,557
F2 179 169 133 173,667 ± 5,033
F3 239 230 210 226,333 ± 14,844
LAMPIRAN G
DATA HASIL UJI PELEPASAN ATENOLOL PELEPASAN FORMULA 1
t (jam)
Serapan (A) Konsentrasi Pengamatan
Pelepasan Formula 2
t (jam)
Pelepasan Formula 3
t (jam)
Serapan (A) Konsentrasi Pengamatan
Pelepasan Formula 4
t (jam)
Serapan (A) Konsentrasi Pengamatan
LAMPIRAN H
HASIL UJI ANOVA INDEKS PENGEMBANGAN DENGAN DESIGN EXPERT® Response1Indeks pengembangan
ANOVA for selected factorial model
Analysis of variance table [Partial sum of squares - Type III]
Sum of Mean F p-value
Source Squares df Square Value Prob > F
Model 4.99 3 1.66 230.25 < 0.0001
The Model F-value of 230.25 implies the model is significant. There is only a 0.01% chance that a "Model F-Value" this large could occur due to noise.
Values of "Prob > F" less than 0.0500 indicate model terms are significant. In this case A, B are significant model terms.
Values greater than 0.1000 indicate the model terms are not significant.
If there are many insignificant model terms (not counting those required to support hierarchy), model reduction may improve your model.
Std. Dev. 0.085 R-Squared 0.9886
Mean2.29 Adj R-Squared 0.9843
C.V. % 3.71 Pred R-Squared 0.9742
PRESS 0.13 Adeq Precision 34.265
The "Pred R-Squared" of 0.9742 is in reasonable agreement with the "Adj R-Squared" of 0.9843. "Adeq Precision" measures the signal to noise ratio. A ratio greater than 4 is desirable. Your ratio of 34.265 indicates an adequate signal. This model can be used to navigate the design space.
Coefficient Standard 95% CI 95% CI
Factor Estimate df Error Low High
Final Equation in Terms of Coded Factors:
Final Equation in Terms of Actual Factors:
Indeks Pengembangan =
+2.29025
+0.59508 * Natrium Alginat
+0.24542 * Gliserin
-0.035417 * Natrium Alginat * Gliserin
The Diagnostics Case Statistics Report has been moved to the Diagnostics Node. In the Diagnostics Node, Select Case Statistics from the View Menu.
Proceed to Diagnostic Plots (the next icon in progression). Be sure to look at the:
1) Normal probability plot of the studentized residuals to check for normality of residuals. 2) Studentized residuals versus predicted values to check for constant error.
3) Externally Studentized Residuals to look for outliers, i.e., influential values. 4) Box-Cox plot for power transformations.
If all the model statistics and diagnostic plots are OK, finish up with the Model Graphs icon.
LAMPIRAN I
Hasil Uji Anova Lama Merekat dengan Design expert® Response2Lama merekat
ANOVA for selected factorial model
Analysis of variance table [Partial sum of squares - Type III]
Sum of Mean F p-value
The Model F-value of 57.78 implies the model is significant. There is only a 0.01% chance that a "Model F-Value" this large could occur due to noise.
Values of "Prob > F" less than 0.0500 indicate model terms are significant. In this case A, B are significant model terms.
Values greater than 0.1000 indicate the model terms are not significant.
If there are many insignificant model terms (not counting those required to support hierarchy), model reduction may improve your model.
Std. Dev. 14.82 R-Squared 0.9559
Mean188.25 Adj R-Squared 0.9393
C.V. % 7.87 Pred R-Squared 0.9007
PRESS 3955.50 Adeq Precision 16.864
The "Pred R-Squared" of 0.9007 is in reasonable agreement with the "Adj R-Squared" of 0.9393.
"Adeq Precision" measures the signal to noise ratio. A ratio greater than 4 is desirable. Your ratio of 16.864 indicates an adequate signal. This model can be used to navigate the design space.
Coefficient Standard 95% CI 95% CI
Factor Estimate df Error Low High VIF
Intercept 188.25 1 4.28 178.38 198.12
A-Natrium Alginat 52.58 1 4.28 42.72 62.45 1.00
B-gliserin 19.58 1 4.28 9.72 29.45 1.00
AB -5.08 1 4.28 -14.95 4.78 1.00
Final Equation in Terms of Coded Factors:
Final Equation in Terms of Actual Factors:
The Diagnostics Case Statistics Report has been moved to the Diagnostics Node. In the Diagnostics Node, Select Case Statistics from the View Menu.
Proceed to Diagnostic Plots (the next icon in progression). Be sure to look at the: 1) Normal probability plot of the studentized residuals to check for normality of residuals. 2) Studentized residuals versus predicted values to check for constant error.
3) Externally Studentized Residuals to look for outliers, i.e., influential values. 4) Box-Cox plot for power transformations.
If all the model statistics and diagnostic plots are OK, finish up with the Model Graphs icon.
LAMPIRAN J
Hasil Uji Anova Pelepasan dengan Design expert®
Response4 Pelepasan
ANOVA for selected factorial model
Analysis of variance table [Partial sum of squares - Type III]
Sum of Mean F p-value
The Model F-value of 115.13 implies the model is significant. There is only a 0.01% chance that a "Model F-Value" this large could occur due to noise.
Values of "Prob > F" less than 0.0500 indicate model terms are significant. In this case A, B are significant model terms.
Values greater than 0.1000 indicate the model terms are not significant.
If there are many insignificant model terms (not counting those required to support hierarchy), model reduction may improve your model.
Std. Dev. 4.11 R-Squared 0.9774
Mean127.58 Adj R-Squared 0.9689
C.V. % 3.22 Pred R-Squared 0.9491
PRESS 303.42 Adeq Precision 23.864
The "Pred R-Squared" of 0.9491 is in reasonable agreement with the "Adj R-Squared" of 0.9689.
"Adeq Precision" measures the signal to noise ratio. A ratio greater than 4 is desirable. Your ratio of 23.864 indicates an adequate signal. This model can be used to navigate the design space.
Coefficient Standard 95% CI 95% CI
Factor Estimate df Error Low High VIF
Intercept 127.58 1 1.19 124.84 130.31
A-Natrium Alginat -20.66 1 1.19 -23.39 -17.93 1.00
B-gliserin -7.63 1 1.19 -10.36 -4.89 1.00
AB 0.51 1 1.19 -2.22 3.24 1.00
Final Equation in Terms of Coded Factors:
Final Equation in Terms of Actual Factors:
The Diagnostics Case Statistics Report has been moved to the Diagnostics Node. In the Diagnostics Node, Select Case Statistics from the View Menu.
Proceed to Diagnostic Plots (the next icon in progression). Be sure to look at the:
1) Normal probability plot of the studentized residuals to check for normality of residuals. 2) Studentized residuals versus predicted values to check for constant error.
3) Externally Studentized Residuals to look for outliers, i.e., influential values. 4) Box-Cox plot for power transformations.
If all the model statistics and diagnostic plots are OK, finish up with the Model Graphs icon.
LAMPIRAN K
Formula Optimum Berdasarkan Metode Design expert® Solutions
Number Natrium Gliserin Indeks Lama Pelepasan Desirability
Alginat Pengembangan Merekat
25 -0,09 -0,80 2,0366 167,362 135,615 1,000
26 -0,86 0,51 1,91638 155,003 141,327 1,000
27 -0,13 -0,79 2,01508 165,401 136,344 1,000
28 -0,51 -0,99 1,72737 139,611 145,867 1,000
29 -0,84 0,27 1,8617 150,261 142,853 1,000
30 -0,37 -0,15 2,03333 165,751 136,324 1,000
31 -0,54 0,53 2,10636 171,45 134,642 1,000
32 -0,27 -0,22 2,07283 169,385 134,883 1,000
33 -0,82 0,59 1,9613 158,894 139,867 1,000
34 -0,57 -0,20 1,89514 153,532 141,03 1,000
LAMPIRAN L
Point Prediction dengan Design expert®
Factor Name Level Low Level High LevelStd. Dev. Coding
ANatrium Alginat 0.000 -1.00 1.00 0.000 Actual
BGliserin 0.000 -1.00 1.00 0.000 Actual
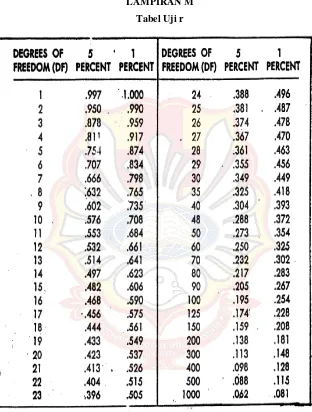
LAMPIRAN M Tabel Uji r
LAMPIRAN O
Hasil Uji Anova Penetapan Kadar
Anova : Single Factor SUMMARY
Groups 11.76536 3 3.921786 1.212913 0.365909 4.066181 Within
Groups 25.8669 8 3.233362