SUPPLY AND DEMAND IDENTIFICATION OF ECOTOURISM SECTOR (Case Study : Kota Bengkulu)
Written by DhonaShahreza1 Maria Wikantari1 Dhian Tyas Untari1
1
Lecturers of Economics Education of FIPPS of Universitas Indraprasta PGRI email:
d2reza@yahoo.com;mwikantari@gmail.com; tyas_un@yahoo.co.id
ABSTRACT
Ecotourism is a prospective sektor of Bengkulu, and ecotourism development is the once focus concept to increase economic development. The aim of research is to identify supplay and demand of ecotourism sektor. And object research is Kota Bengkulu as a capital city of Bengkulu and also have a lot of potencial tourism product. Primary datas get from Bps Kota Bengkulu dan Dispar Kota Bengkulu. And secoundary datas get from observation at the research object. Descriptifve metode use to interprate data findings. The result of the research is to facilitate government of Kota Bengkulu to create a grand strategy of ecotourism sektor.
Key words :Ecotourism, Supply Demand Identification, Kota Bengkulu.
A. PREFACE
In Indonesia tourism sektor is one of the significant contributor of foreign exhange for the country. In overall, tourism sektor became the fifth contributor in 2008, the fourth in 2009 and the fifth in 2010. Regarded as the contribution of non oil and gas sektor, tourism sektor lies in the second and third rank (Dewi, 2011:4). In connection with the implementation of decentralization policy through Law No.23 of 2004, the authority of organization of tourism policy became the autority of the regional Government. The application of regional autonomy provide logic consequency towards regional Government to handle their households and has their responsibilities fully in enhancing the prosperity of their people through activity of tourism development. Tourism sektor becomes one of the prominent sektor within the guideline of economic development of Kota Bengkulu (Plan of the Long-term Development of the Government of Kota Bengkulu 2007-2027). Through tourism sektor, it is expected to maximize the potential tourism in Kota Bengkulu to strive for an autonomy. Tourism in many developing countries including Indonesia has a significant role in solving the poverty problem, i.e. through absorption of manpower and increase of income (Siregar, 2004).
Parr, Benteng Malborough, cemetery of Sentot Ali Basa, and special culture potentially to be developed.
All potential ecotourism owned by Kota Bengkulu need a good management so as to provide benefits to the community. Government's efforts of Kota Bengkulu to lift people's economic through the tourism sektor and make Kota Bengkulu become an international tourist area is a good effort. However the success or failure of efforts to achieve Kota Bengkulu as an international ecotourism depends on the seriousness of the government in collaboration with other agencies and it has to be supported by the community in developing tourism business in Kota Bengkulu, also it is required the participation of a variety of elements to be able to achieve it, including active public participation around tourist sites (Barika, 2009).
Based on the above description which has been mentioned generally, the tourism sektor is a strategic sektor, and there should be an identification of the ecotourism market of Kota Bengkulu as the need for a strategy to develop eco-tourism in Kota Bengkulu. Related to this statement, this study aims to identify all supporting aspects of ecotourism development in Kota Bengkulu and related aspects of ecotourism demand in Kota Bengkulu.
B. METHODOLOGY
This paper uses descriptive method while the secondary data is taken from the related institutions as well as the result of field observation. The secondary data related with general overview of Kota Bengkulu consists of social economic condition of Kota Bengkulu‟scommunity, access, infrastucture and availability of
other supporting services. Meanwhile the demand site, the researchers intend to observe the aspect of visit amount, endurance and rented hotels.
Operational Variable
a) Supply : Tourism planning integrates all components of supply and their interaction. These components represent the drawing forces generating tourism demand. Lodging and other service facilities function as supporting units and should not be considerend as prime motivation of travel (Gunn, 1994). Tourism supply comprises attractions, transportation, accomodation, infrastructure and other support service.
b) Demand : It is important to treat the destination as a unit as it is noted that the destination can affect the competitiveness of both the destination and individual actors. Destinations are complex networks. A review of the literature indicates occupancy of star hotel and non star hotel, number of employee, The tourists‟ average duration and Number of
Foreign and Domestic Tourist Arrivals is some indicators to estimate demand of tourism.
C. DISCUSSION
1. General Overview of Kota Bengkulu
of North Bengkulu while the south region connect to the Regency of South Bengkulu.
The main issue is that population of Bengkulu Province has not spread yet generally. Population aglomerate only in the center region and the west coast along the street of the province, while the hinterland which constitutes a small group disperse all over. Kota Bengkulu is one of the densely populated region compared to other region in Bengkulu Province.
Table 1.
Number of Demography Based on Gender in Kota Bengkulu
Year 2011 2010 2009
Males (of humans) 159.735 155.288 138.473 Females (of humans) 153.589 153.256 140.358
Total (of humans) 313.324 308.544 278.831
Source: http://bengkulu.bps.go.id
Furthermore, income is one of the indicators of economic growth in a region. Therefore income of Bengkulu Province is offered in form of Gross Regional Domestic Product (PDRB) of Bengkulu Province indicated through the following Table 2.
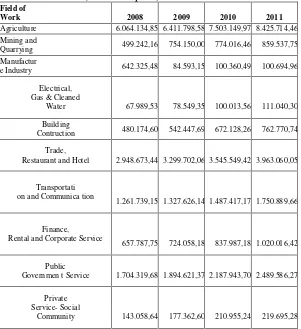
Tabel 2
PDRB of Bengkulu Provinsi According to Field of Work Based on Prevailing Price (million rupiah) Year 2008-2011
Field of
Work 2008 2009 2010 2011
Agriculture 6.064.134,85 6.411.798,58 7.503.149,97 8.425.714,46 Mining and
Quarrying 499.242,16 754.150,00 774.016,46 859.537,75
Manufactur
e Industry 642.325,48 84.593,15 100.360,49 100.694,96
Electrical, Gas & Cleaned
Water 67.989,53 78.549,35 100.013,56 111.040,30 Building
Contruction 480.174,60 542.447,69 672.128,26 762.770,74 Trade,
Restaurant and Hotel 2.948.673,44 3.299.702,06 3.545.549,42 3.963.060,05
Transportati on and Communica tion
1.261.739,15 1.327.626,14 1.487.417,17 1.750.889,66
Finance,
Rental and Corporate Service 657.787,75 724.058,18 837.987,18 1.020.016,42
Public
Governmen t Service 1.704.319,68 1.894.621,37 2.187.943,70 2.489.586,27 Private
Service- Social
Private Service- Entertainme
nt & Recreation 24.061,20 25.623,11 28.076,39 31.888,07
Private
Service- Individual and Household
422.380,35 442.200,05 516.606,10 593.131,84 Total 14.915.886,8516.385.364,1818.649.601,1521.150.289,62
Source: BPS of Bengkulu Province, 2012
Based on Table 8, it appears that the whole part of region‟sincome comes
from agriculture which reaches almost 40% of the total income. This condition is different to income from recreation and entertainment sektor of which is only 0,15% of the total income. Income from the trade, restaurant and hotel sektors amount 19% of the total income. Such condition shows that tourism is not the main factor of tourism demand in Bengkulu Province. Furthermore, Table 3 provides overview regarding population income is presented in PDRB per capita of Bengkulu Province, as follows:
Table 3
PDRB per capita of Bengkulu Provinsi (Rupiah) Year 2008-2011
Year Prevailing Price Constant Price 2000 Real Growth
2008 8.399.085 4.173.766 5,75
2009 9.045.322 4.338.965 5,62
2010 10.139.472 4.532.152 6,06
2011 11.315.156 4.744.945 6,40
Source: BPS of Bengkulu Province, 2012
PDRB per capita as shown in Table 3 describe that the growth of population income increase annually. Afterwards, population‟sconsumption rate per capita
is presented in table 10, as follows:
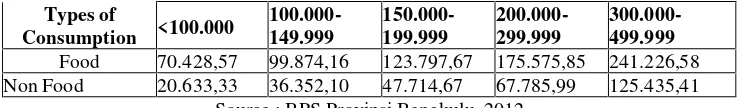
Table 4
Consumption per capita - year 2011 (Rupiah)
Consumption Non Food 20.633,3336.352,1047.714,67 67.785,99 125.435,41
Source: BPS of Bengkulu Province, 2012
Tabel 5
Consumption per capita a month in 2011 (Rupiah)
Types of
Food 70.428,57 99.874,16 123.797,67 175.575,85 241.226,58 Non Food 20.633,33 36.352,10 47.714,67 67.785,99 125.435,41
Source : BPS Provinsi Bengkulu, 2012
Table 5 show that most of the society expenses for whole range income is for food consumption. It can illustrate that the level of consumption for non-food consumption is still low, including expenses for travel.
2. Attractions and Value of Ecotourism at Bengkulu City
Kota Bengkulu is a place who has so may potencial attraction for ecotourism development, both natural ecotourism, cultural ecotourism and history cotourism. Here is an ecotourism attraction featured in Bengkulu city :
a) Danau Dendam Tak Sudah
Beyond its sinister name, the lake, situated by the town of Curup, 6 Km from Bengkulu City, capital of Bengkulu Province, presents its own distinct beauty and tranquility. The 37.5 hectares lake and its stretching surrounding green hills are one elaborate nature reserve that holds signific.
b) Tapak Paderi
Tapak Paderi Beach is one of the top tourist destinations in the province of Bengkulu. With a coastline that borders the Indian Ocean, Bengkulu‟s Tapak Paderi Beach merges into Pantai
Panjang, or Long Beach, making the entire province‟s coast
seemingly endless stretches of fun and relaxation in the sea, sand and sun
c) Wisata Pulau Tikus
Pulau Tikus is a small coral island located in the west of the city of Bengkulu, the size of the island is about 60 x 100 meters. Bygone Tikus Island is an important island for sailor and fisherman because here is where they take shelter from the storm.
d) Fort Marlborough
The British or „Raffles‟ Fort, was built between 1714 and 1719 by
Governor Joseph Collet and was famous as the second-strongest fort built by British in Asia, Fort George in Madras, India being the first. It was restored and opened to the public.
e) Rumah Kediaman Bung Karno
The most important historical heritage is Soekarno‟s exile home in
the city of Bengkulu. Indonesia‟s first president and leader of the
country‟s struggle for Independence from the late 1930s. In the midst
of this struggle, to prevent Soekarno from making political speeches against the Dutch colonial policy, the Dutch Governor-General sentenced Soekarno. Soekarno‟s home is located in the city center,
not far from the Mayor‟s office, and about 2 km from Fort
f) Thomas Parr Monument
Thomas Parr Monument is the one of historic attractions at Kota Bengkulu. It‟s located near of Benteng Marlborough. Obelisk-shaped
monument with an area of 70 square meters and 13.5 meters high was built by the British government on tahun1808 to remain of Residen Thomas Parr who was died by people of Bengkulu.
g) Pantai Panjang
Pantai Panjang, translated to mean Long Beach, boasts a coastline of fine, white sands that stretches 7 kilometers. As the beach has no reefs, its width expands to 500 meters when the tide is low.The beach area is a central tourism district and is lined with restaurants, hotels, cottages and shops. Pantai Panjang is located just 15 minutes from downtown Bengkulu.
h) Istana Inggris
Raffles was live here, and all of governmental activities was done here.Thomas Stamford Raffles is the last British governor in Bengkulu.
i) Pantai Jakat
Jakat beach is a beach with a gradient from 0 to 1.5 meters and is located 1 km from Bengkulu city center. Here are residing fishing activities around the beach so the main tourist attraction is the fishing activities.
3. Supply of Ecotourism at Bengkulu City
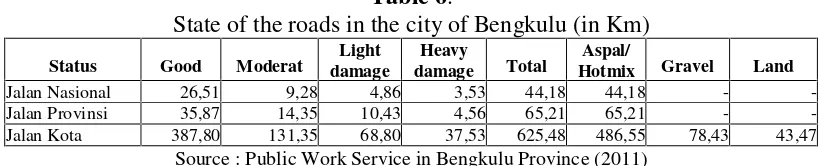
State of access in the form of roads-infrastructure are very supportive supply aspect of eco-tourism in Kota Bengkulu.
Table 6.
State of the roads in the city of Bengkulu (in Km)
Status Good Moderat damageLight damageHeavy Total HotmixAspal/ Gravel Land
Jalan Nasional 26,51 9,28 4,86 3,53 44,18 44,18 -
-Jalan Provinsi 35,87 14,35 10,43 4,56 65,21 65,21 -
-Jalan Kota 387,80 131,35 68,80 37,53 625,48 486,55 78,43 43,47
Source : Public Work Service in Bengkulu Province (2011)
Tourists do not always bring their own vehicle that’s why the availability of public transportation also be important in the development of a destination, according to the 2011 amount of public transportation in Kota Bengkulu many as 4.454 units (Regional Revenue Office of Bengkulu Province, 2011).
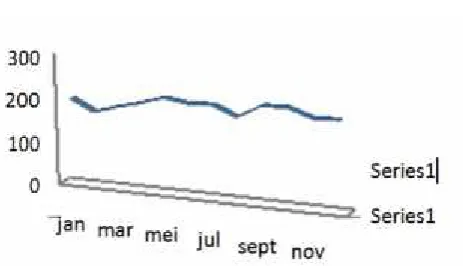
Chart 1.
Air traffic at Airports Fatmawati
Source:BPS–Statistics of Bengkulu Province (2011)
Another aspect of tourism supply is the availability of accommodation, such as hotels or lodgment, in general the number of hotels at Bengkulu city relatively more than other areas in Bengkulu. This suggests that supply aspects Bengkulu city such as the availability of hotel is more better then another place in Bengkulu.
Table 7.
Number Of Hotels, Rooms, Bed And Labor-Star Hotel
Explenation 2008 2009 2010 2011
Hotel 4 4 4 4
Room 170 170 170 170
Beds 270 292 292 259
Employees 220 221 221 204 Source:BPS–Statistics of Bengkulu Province (2011)
Table 8.
Number Of Hotels, Rooms, Bed And Labor-Non Star Hotel
Keterangan 2009 2010 2011
Hotel 40 40 44
Room 804 784 909
Beds 1286 1311 1397
Employees 441 449 359
Source:BPS–Statistics of Bengkulu Province (2011) 4. Ecotourism Demand in Bengkulu City
Bengkulu city, income and consumption of Bengkulu city and outer Bengkulu city residentsare also engaged as the indicators of ecotourism demand.
Tourist arrivals is a key determinant of tourism demand (Li, 2004). This suggests that the higher tourist arrivals, both domestic and foreign to Bengkulu city, the higher tourism demand in this area. Tourist arrivals of Bengkulu Province based on hotel‟s classification is shown by Table 5.
Table 9
Number of Foreign and Domestic Tourist Arrivals based on Hotel Classification of Bengkulu Province Bengkulu Year 2008-2011
Year
Foreign Tourists Domestic Tourists Total Star Non Star Star Non Star Star Non Star
2008 120 206 14.273 200.179 14.393 200.385 2009 150 280 20.717 189.604 20.867 189.884 2010 163 280 24.592 200.459 24.755 200.739 2011 203 320 25.160 201.593 25.363 201.913
Sumber: BPS Provinsi Bengkulu, 2012
Data as shown in Table 9 indicates that domestic tourists still dominate in visiting the tourist destination in Bengkulu compare to foreign tourists based on hotel classification. In 2011for example, there are 25.160 persons in star hotels and 201.593 persons in non star hotel. It is different with number of foreign tourist which totals only 203 persons in star hotel and 320 persons in non star hotels. This result is also supported by the findings of Collier (2010) and Stabler et al. (2010) that employment and income creation result not only from expenditure by foreign tourits, along with associated increases in private investment and public expenditure, but also from domestic tourist expenditure which often exceeds that of foreign tourists. Furthermore the percentage of hotel occupancy rates by hotel classification is also shown using the following Table 10.
Table 10.
The Percentage Of Hotel Occupancy Rate Based On Hotel Classification Year 2008-2011
2008 2009 2010 2011
Star hotels 36,44% 37,77% 39,48% 40,87% Non star hotels 28,79% 30,71% 35,48% 28,79%
Sumber: BPS Provinsi Bengkulu, 2012
Table 6 shows that the star hotel occupancy rate in 2011 was 40.87% and the non star hotels amounted to 28.79%. It indicates that hotel occupancy rate is lower than 50% in both hotels eventhough the trend is increase. Then, one of aspect to determine ecotourism demand is the tourists‟average length of stay that
Table 11
The tourists‟average duration of stay based on hotel classification
Year 2008-2011
2008 2009 2010 2011
Star hotels 2,11 days 1,80 days 1,69 days 2,09 days Non star hotels 1,64 days 1,69 days 1,67 days 1,67 days
Sumber: BPS Provinsi Bengkulu, 2012
Table 7 shows the average duration of stay in star hotels in 2011 was 2.09 days and the non star hotels was 1.67 days. It indicates mostly tourists visited Bengkulu for holiday purpose for both star hotels and non star hotels.
D. CONCLUSION REMARKS
Tourism contributes to the enhancement of the environmment, including natural and cultural resources (Wall & Mathieson, 2006) that is in line with ecotourism concept. Tourism development in Bengkulu city has to be improved continuously to rising tourist arrivals that will generate not only local income but also national GDP. Therefore, the identification of ecotourism supply and demand aspects of Bengkulu city is required. Ecotourism supply consists of the availability of accommodation, accessibility, infrastructure and services. The result shows that the availability of national roads, provincial and city roads are pretty good because mostly are already paved. The air transportation accessibility is low because there are only 200 flights in airport Fatmawati in 2011. In terms of hotel accommodation, the avaibility of star hotel is low; only 4 star hotels with 170 rooms, 259 beds and 204 staffs while there are 44 non star hotels with 909 rooms, 1,397 beds and 359 employees. Hence, an increase in facilities and infrastructure development required to enhance tourists convenience in tourist destination. Without all of it, the tourism development will be stunted and difficult to develop (Ibrahim, 2008).
REFERANCE
Dewi, Ike Juwita (2010), Implementasi dan Implikasi Kelembagaan Pemasaana Pariwisata yang Bertanggujawab (Responsible Tourism Marketing), Indonesia; Kementrian Kebudayaan dan Pariwisata Republik Indonesia.
Gunn, C.A, 1994,Tourism Planning, third edition, Taylor and Francis, London. Li, G. 2004. Tourism forecasting-an almost ideal demand system approach.
Unpublished Ph.D. thesis, University of Surrey.
Prajogo, M.J, 1976, Pengantar Pariwisata Indonesia, Cetakan II, Dirjen Pariwisata, Jakarta.
Siregar, Muhammad Arifin, 2004, Pengembangan Pariwisata Dalam Kontribusinya Untuk Penanggulangan Kemiskinan, Warta Pariwisata, ISSN; 1410-7112, Vol. 7, No.4.
Stabler. M, Papatheudorou. A, and Sinclair.M.T, 2010, The Economic of Tourism, 2nd Edition, Routledge, London.
Wall, Geoffrey & Mathieson, Alister, 2006, Tourism – Change, Impacts and Opportunities, Pearson Education Limited, Essex.
Yahya Ibrahim, 2008. Pelancongan Malaysia: Pembangunan dan Pemerkasaan. Dalam Yahya Ibrahin (ketua penyunting). Pelancongan Malaysia Isu Pembangunan, Budaya, Komuniti dan persetempatan. Penerbit Universiti Utara Malaysia.
Yoeti, O. A, 1991, Pengantar Ilmu Pariwisata, Pradnya Paramita, Jakarta. Situs:
www.bpsofbengkuluprovince.go.id.