Buletin Pos dan Telekomunikasi Vol. 13 No.1 (2015) 1-18
1
Frequency Requirement for Broadband Public Protection and Disaster Relief
(PPDR)in Indonesia
Kebutuhan Frekuensi Untuk Public Protection and Disaster Relief (PPDR)
Pita Lebar di Indonesia
Diah Yuniarti
Pusat Penelitian dan Pengembangan Sumber Daya dan Perangkat Pos dan Informatika Jl. Medan Merdeka Barat No.9 Jakarta 10110, Indonesia
e-mail: [email protected]
Permintaan akan pengembangan aplikasi Public Protection and Disaster Relief (PPDR) pita lebar terus meningkat dalam beberapa tahun terakhir seiring dengan kebutuhan untuk tanggap bencana yang lebih efisien dan efektif. Penelitian ini mengidentifikasi kebutuhan frekuensi PPDR pita lebar di Indonesia yang meliputi kejadian harian (PP1) dan kejadian darurat besar (PP2) pada pita frekuensi 400 MHz dan 800 MHz. Teknik pemodelan dan simulasi digunakan untuk menghitung kebutuhan frekuensi berdasarkan data skenario dan jumlah kejadian yang diperoleh. Hasil penelitian menunjukkan bahwa kebutuhan frekuensi untuk mengakomodasi kejadian PP1 diperkirakan sebesar 2x10 MHz. Sedangkan, kebutuhan frekuensi untuk kejadian PP2 diperkirakan sebesar 2x20 MHz untuk LTE FDD atau 30 MHz untuk LTE TDD.
A B S T R A CT
Kata kunci :
Public Protection and Disaster Relief PP1 Incidents
PP2 Incidents LTE FDD LTE TDD
Demands regarding on application development of broadband Public Protection and Disaster Relief (PPDR) are increasing in recent years as more requirements on more efficient and effective disaster responses. This research identified broadband PPDR frequency requirements in Indonesia, comprising of daily incidents (PP1) and large emergency incidents (PP2) at 400 MHz and 800 MHz frequency bands. Modelling and simulation techniques are used to calculate frequency requirement based on scenario and number of incidents data obtained. Research result shows frequency requirements to accommodate PP1 incidents is estimated at 2x10 MHz. Meanwhile, frequency requirement to accommodate PP2 incidents is estimated at 2x20 MHz for LTE FDD or 30 MHz for LTE TDD.
1. Introduction
Needs in the handling of events related to the Public Protection and Disaster Relief (PPDR) more efficiently and more effectively have boosted the development of broadband applications such as real time mobile video application. On the other hand, PPDR applications that exist today are mostly located in the narrow band support voice application and low data rate, especially in the wide-band of 25 kHz channel or below, including in Indonesia (Yuniarti, 2013). ITU in the WRC-2015 setting the agenda to review and revise Resolution 646 WRC-2003 for PPDR based on Resolution 648 WRC-2012 on a study to support broadband PPDR (ITU, 2012).
Frequencies for the purposes of provisional handling of disaster (PPDR) in Indonesia are allocated in the 409 -417 MHz and 422.5 to 426.25 MHz band (Ministry of Communications and Informatics, 2010). Although there has been the allocation of frequencies for PPDR, however, relevant government institutions or organizations such as the police and BNPB has been allocated specific frequencies that are beyond the allocation of PPDR. In order to utilize the radio frequency spectrum more efficiently, the government in this
2
case the Ministry of Communications and Informatics plan to merge the entire frequency allocations for government agencies in the frequency band called Government Radio Network Indonesia (GRNI) in the frequency band of 380 -400 MHz (Directorate of Resources Management, 2013).
The potential allocation of frequencies for broadband PPDR utilization in Indonesia are in some frequency bands, including 380-400 MHz band that are planned for GRNI and 4940 -4990 MHz band (Setiawan, 2010). The European Union has identified the 400 MHz and 700 MHz frequency band (ECC, 2013) where the 700 MHz (694-790 MHz) band is a prime candidate of frequency bands for broadband PPDR while the 400 MHz (410-430 MHz and 450-470 MHz ) band is an additional frequency spectrum (ECC, 2014). For Asia Pacific, APT has set plans of 700 MHz (698-806 MHz) frequency band for mobile broadband frequency. Whereas, the allocation of frequencies for broadband PPDR in Asia Pacific is planned to use the 800 MHz (806-960 MHz) frequency band, but is still waiting for further studies (Lewis, 2012).
By looking at the potential of broadband PPDR which is large enough to handle PPDR occurrence in Indonesia, this research identifies the needs of broadband PPDR frequency spectrum in Indonesia, limited on daily events (PP1) and major emergency events (PP2).
2. Desktop Study
2.1.Related Research
The increasing requirements for broadband PPDR has prompted some related research/studies, including:
2.1.1. Public Protection and Disaster Relief (PPDR) Services and Broadband in Asia and the Pacific: A Study of Value and Opportunity Cost in the Assignment of Radio Spectrum (Ure, 2013)
This study aims to estimate the costs and benefits of provision of broadband frequency spectrum to PPDR agencies either in full or by sharing. The research was conducted on eight Asian countries, namely Australia, China, Indonesia, Malaysia, New Zealand, Singapore, South Korea and Thailand. This research uses a combination of top-down and of bottom-up methodology. The top down data was obtained from the international references associated with the recovery of major disasters such as hurricanes, earthquakes, epidemics, and others. Bottom-up data focus on the “cost of crime" as part of the protection of the public and
based on the UNODC databases and online toolkit namely IBM’s benefits estimator. One of the conclusions of
this research is the broadband frequency spectrum provided to PPDR networks outside the emergency situation can be shared with non-commercial PPDR users as an incentive for efficient use of spectrum. The assumptions used, the losses caused by the occurrence of PPDR in eight countries is much greater than the income earned from the provision of spectrum to 4G LTE. The annual losses for public safety per capita bases are approx. at $ 505.01 (Indonesia) to $ 36.06 (Singapore). Based on the cost-benefit analysis, bandwidth should be allocated for the purposes of PPDR services ranging from 10-20 MHz.
2.1.2. PPDR Spectrum Harmonisation in Germany, Europe, and Globally” oleh J.Scott Marcus, John Burns, Val Jervis, Reinhard Wahlen, Kenneth R. Carter, Imme Philbeck dan Peter Vary (Marcus et al., 2010)
3 mobile Wimax, spectrum requirement for Germany is estimated at 15 MHz uplink and 10 MHz downlink. Frequency spectrum identified for PPDR was in the 5150-5250 MHz band and if possible coupled with the 1452-1479.5 MHz band that is not used (originally used by T-DAB). 802.11 Technology can still be used as a high power level for PPDR allowed to be used in the 5150-5250 MHz band. Alternatively, ad hoc mesh networking and LTE picocell and its repeater can be used.
2.1.3. The Need for PPDR Broadband Spectrum in the Bands Below 1 GHz (Marcus, 2013)
This paper aims to review the spectrum requirements for PPDR, to identify the costs and benefits of harmonized allocation for frequency spectrum of broadband PPDR, to identify challenges in finding the frequency spectrum below 1 GHz, to identify the urgency of the auction for the value of the PPDR spectrum, and to analyze the options for the joint use of PPDR and LTE-based mobile networks operator. The study shows that the implementation of broadband PPDR require frequency spectrum below 1 GHz. Currently, only the 700 MHz (694-790 MHz) frequency band which has a realistic prospect in a global or regional scale in the European Union. The auction of spectrum below 1 GHz did not provide an economically efficient outcome and did not provide the value of PPDR allocations for the community. Broadband requirements for public safety could not be met by relying entirely on commercial networks.
2.1.4. Delivering 4G/LTE Mobile Broadband for Emergency Services (Telstra, 2012)
This paper explains the options and presents a way for emergency services organizations (ESO) Australia to effectively adopt the 4G/LTE. Parallel operation between LTE 4G technology in the digital dividend Australia at 700 MHz and PPDR at 800 MHz low end could be done. Infrastructure development only for the use of ESO is quite costly and there is a risk most of the spectrum be unused so that PPDR infrastructure is sugensted to be in commercial infrastructure with a certain level of service.
2.1.5. ECC Report 199 : User Requirements and Spectrum Needs for future European Broadband PPDR
systems (Wide Area Networks)” by ECC (ECC, 2013)
This study aims to identify and analyze the user's requirements and the frequency spectrum needs for future European broadband PPDR system. The study includes three PPDR environments namely PP daily operations (PP1 category), emergencies or major events (PP2 category) and disaster (DR category) assuming the use of the LTE technology as the technology of broadband PPDR being used. Minimum calculation of the spectrum needed by broadband PPDR using event-based methodology is limited to only the data communication in the 400 MHz and 700 MHz frequency band. The study shows that the PP1 frequency spectrum needs for WAN is estimated between 7.1 MHz and 12.5 MHz. The amount of the frequency spectrum of 10 MHz for uplink and 10 MHz for downlink deemed to be able to meet the needs of PP1 scenario. For PP2-heavy traffic scenarios, spectrum needs are estimated between 10.3 MHz and 14.3 MHz. Taking into account the PP1 and PP2 scenarios, the value of 2x10 MHz (10 MHz uplink, 10 MHz downlink) can meet the need for two types of PPDR scenarios. Estimates of the spectrum for the noise in the Wireless Area Network (WAN) of future broadband PPDR is about 2x3.2 MHz.
2.1.6. Technical Requirements for Mission Critical Broadband PPDR Communications (APT, 2013)
4
has a stable and adaptable platform, has a high security, cost-effective, has a high performance, and has an electromagnetic compatibility (EMC). Whereas, the operational requirements of the systems required for PPDR users include: the system can be operated in various radio operation environments, the system has the capability of interoperability, the system is compatible with the existing network, the use of the system does not interfere with the adjacent frequency band, and there are planning and pre-coordination to provide a reliable PPDR communications system.
2.2.Public Protection and Disaster Relief (PPDR)
PPDR is divided into two terms, namely:
a. Public Protection, related to the maintenance of law, protection of life and property as well as emergency situations.
b. Disaster Relief, related to serious disruption to community activities, having a significant and widespread threat to human life, health, property or the environment either caused by accidents, natural or human activity, arises suddenly or the result of a complex and lengthy process,
Communication supporting the PPDR operations covers several services, including fixed, mobile, amateur and satellite services. Generally, a narrow band technology is used for PPDR communication on mobile terrestrial services whereas wideband and broadband technology can be used for PPDR applications on all communication services (ITU, 2003).
a. Narrow band
Narrow band PPDR application is implemented in wide area networks (WAN), including in digital trunked radio network which provides digital voice application and data applications at low speed (for example, the pre-defined status message, data transmission such as forms and messages, as well as access to the database). Narrow band technology has a channel bandwidth up to 25 kHz with a speed up to 64 kbit/sec which is equivalent to one voice channel in a radio system (Ure, 2013). Narrow band system is generally a permanent network and national network (SATRC Working Group on Spectrum, 2012).
b. Wide Band
Wideband technology has a data rate of up to hundreds of kilobits/second (in the range of 384-500 kbit/sec) so that it can support two voice channels on a radio system (ITU, 2003) and allows the transmission of data, video, and large-sized IP based traffic (SATRC Working Group on Spectrum, 2012). Wideband wireless systems can reduce the response time to access the Internet and other information databases directly from the scene. It is expected to initiate the development of new and safe applications for PPDR organizations.
c. Broadband
Broadband technology can be seen as an evolutionary trend from wideband. Broadband application enables additional functionality with additional capacity to support higher speed data and images with higher resolution (ITU, 2003). Broadband system can be localized at the scene of an incident or accident (known as the "hot spot") or a big event where PPDR personnel operate. This system can provide voice, high speed data and real-time digital video with high quality and multimedia applications that require data rates in the range of 1-100 Mbit/sec (SATRC Working Group on Spectrum, 2012).
There are several scenarios that can be used as a basis for identifying the frequency spectrum needs for PPDR. The scenario includes the distribution scale of PPDR events into daily operations, emergencies or public events and disaster.
a. Daily operations
5 infrastructure and frequency spectrum of PP is determined using this scenario with additional capacity to accommodate emergencies. Examples of operation or daily events include (Miral, 2014) traffic accident, fire, handling of crime, handling of row between groups, the handling of demonstrations, health support, for example, referring to the Millennium Development Goals Plan, especially reduction of maternal and child deaths, accidents in the tourist areas, factories, residents, offices, shopping centers etc., emergency services, as well as the monitoring of strategic locations.
b. Major emergency events and public events
Major emergency events and public events or called PP2 are carried out by the PP and DR agencies in a particular area which is still in the jurisdiction. On the other hand, the PP and DR agencies must still perform routine operations in other areas which are still a jurisdiction. Major emergency events and public events require additional PPDR resources from adjacent jurisdictions, cross-agency or international organization. Forest fires or vast urban fires are examples of major emergency events. Whereas, examples of public events are ASEAN meetings or the implementation of PON.
c. Disasters
Disasters can occur naturally or due to human activity. Disasters that occur naturally are, for examples, earthquakes, floods, tropical storms, etc. Disasters caused by humans include a large scale crime scene or armed conflict. The greatest requirements for PPDR telecommunications services are in big cities where traffic with diverse categories can be found. The maximum requirements will occur after a disaster when many PPDR users converge on the scene utilizing existing telecommunication networks, installing temporary networks, or utilizing or portable stations. Additional spectrum may be required for interoperability between various PPDR users or for the installation of temporary disaster recovery system (ITU, 2003).
2.3. Network Dimensioning
Network Dimensioning is the determination of the coverage area of the network and counting the number of scenes required to serve a certain area including the required coverage and capacity. Network dimensioning basically includes coverage analysis and capacity analysis (Hamid, Kawser, and Hoque, 2012).
2.3.1. Coverage Analysis
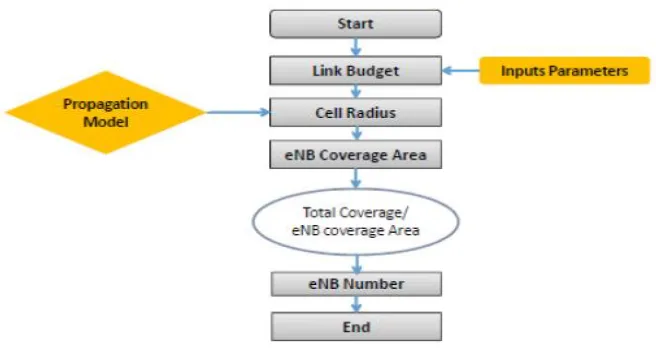
Cell reach or coverage specified for the coverage-limited scenarios or for interference-limited scenarios. It depends on the fading margin, the targetted throughput at the cell edge, the average network load etc. LTE coverage analysis stage is shown in Figure 1.
6
Link budget calculation is used to estimate the maximum allowed attenuation, called path loss, between the user terminal and base station (BS). With a maximum path loss, the maximum cell radius can be estimated using appropriate propagation model (Basit, 2009; Belhouchet & Ebdelli, 2010; Hamid et al., 2012).
Stages in calculating the Link Budget are as follows: 1. Calculate the receiver sensitivity
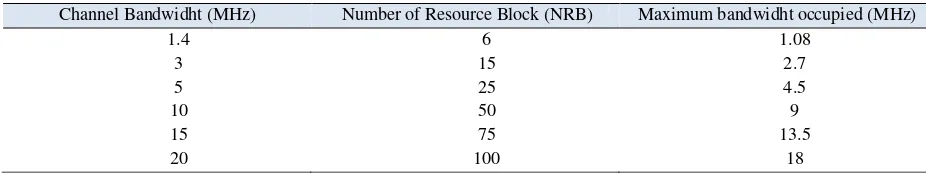
Receiver sensitivity (Pmin), as shown in the formula (1), is the minimum acceptable power where throughput requirements are still met (Abdulkafi et al., 2012) or the minimum average signal strength received by the antenna with sufficient SINR for modulation schemes used to meet the minimum throughput requirements of 95% of the maximum possible throughput value (Belhouchet & Ebdelli, 2010). The maximum number of resource blocks and bandwidth for each LTE bandwidth is shown in Table 1.
Pmin = kTB + NF + SINR + IM -Gd………….(1)
Where:
Ktb : Thermal noise level at certain bandwitdh noise (BW). BW = NRB x 180 kHz; NRB is the number of resource blocks and 180 kHz is bandwidth for 1 (one) resource block in LTE
NF : Noise Figure of receiver
SINR : Signal to interference plus noise ratio for modulation and coding scheme (MCS) used IM : Implementation margin
Gd : Diversity gain, the value is determined as -3 Db (Abdulkafi et al., 2012; Belhouchet & Ebdelli, 2010)
Table 1. Number of Resource Block and Maximum Bandwidht for Each LTE Bandwidht
Channel Bandwidht (MHz) Number of Resource Block (NRB) Maximum bandwidht occupied (MHz)
1.4 6 1.08
3 15 2.7
5 25 4.5
10 50 9
15 75 13.5
20 100 18
Source : (Anritsu Company, 2010)
2. Calculating Total Loss
Total loss is attributed to the path loss, also consists of body loss, penetration loss, cable loss, insertion loss etc. that cause a decrease in the level of the signal captured by the receiver (Puspita & Mahmudah, 2011).
Pmin = EIRP –Total Loss...(2) Total Loss = EIRP – Pmin...(3) Where:
EIRP = Pt + Gt – Ls...(4) Remarks:
Pmin : Receiver sensitivity
Pt : Transmitted power
Gt : Gain antenna
Ls : Body Loss
7
1. Uplink Budget
Uplink budget is calculated by taking into account all the loss and gain of the User Equipment (UE) to the BS, including the body loss which is generally assumed to be 3 dB (Braithwaite & Scott, 2003).
2. Downlink Budget
Downlink budget is calculated by taking into account all the loss and gain of the Base Station side to the UE Uplink Budget.
3. Calculating Cell Radius
Assuming a certain propagation models, we will obtain radius coverage of a BS based on the maximum path loss derived from previous calculations. Propagation models can be classified into empirical model and deterministic model (Singh, 2012). The empirical model is based on data measured from practice. Propagation model that is categorized as an empirical model for macrocellular environment include Hata Model, Okumura Model and COST-231 model.
Okumura model is the most popular model used. This model is the basis of the Hata model where there are three types of models, namely for urban, suburban, and open areas. A model for urban areas was first built and used as a basis for other types of areas. Hata formulate mathematical relationships to describe graphical information from Okumura. Hata formulation applies to certain parameter ranges as follows:
- Carrier frequency: 150 MHz-1500 MHz
- Height of Base Station (BS) antenna: 30 m –200 m - Height of Mobile Station(MS) antenna: 1 m –10 m - Transmission distance: 1 km-20 km
Pathloss in dB of Okumura-Hata Models (Molisch, 2011) is formulated as: PL = PLfreespace + Aexc + Hcb + Hcm………..(5)
Where
PLfreespace = freespace pathloss
Aexc = additional loss (as a function of distance and frequency)
Hcb dan Hcm : correctional factor
The most common form of formulation in equation (5) as follows:
PL = A+ Blog (d) + C………..(6)
Where A,B, and C are factors that depend on frequency and antenna
A = 69.55 + 26.16 log (fc) – 13.82log (hb)- a (hm)……….(7)
B = 44.9 – 6.55log (hb)……….(8)
Where fc is in MHz and d is in km
4. Site Area dan Number of eNodeB
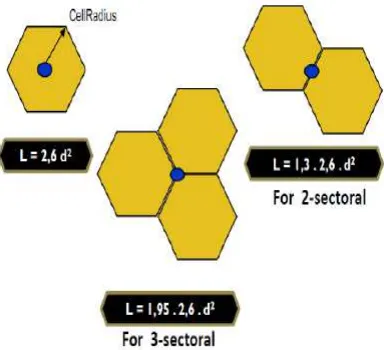
Having obtained the cell radius, the next step is to calculate the site area and the number of eNode B. Formula site area for certain types of Base Station is shown in Figure 2. Site Area for Base Station of three sectors as shown in Figure 2 as follows:
L = 1.95 x 2.6 x d2…………..(9) Where:
L = site area and d = cell radius (km)
Number of eNodeB can be obtained by the following formula:
NeNB= A/L…………..(10)
Where:
8
Figure 2. Site Area (Floatway Systems, 2014)
3. Method
3.1.Research Approach
This research was conducted using a quantitative approach to calculate the Broadband PPDR frequency spectrum needs.
3.2.Research Technique
The research was conducted with the modeling and simulation techniques to calculate and observe the description of the performance of the total allocation of PPDR spectrum needs based on scenarios and events data. The scenarios and events data can be by interview to the informant as well as by literature study. The data is required as an input in determining the needs of the number of frequencies for broadband-based PPDR with LTE technology.
3.3. Data Source
Data source from this research were obtained from informants from the agency or institution that handles PPDR events namely Fire Department and the Provincial Disaster Management of Jakarta and the Indonesian National Police as well as literature studies.
The selection criteria for informants are:
1. Having knowledge in the technical handling of disaster, the amount of data of events and scenarios when a disaster occurs
2. Occupying certain positions in any agency with an influence in the policy in the event of disaster scenarios and disaster management techniques. Therefore, any changes in these agencies can be obtained in this study.
3.4.Location and Time of Research
9 3.5.Data collection
3.5.1. Data collection technique
Primary data in this research can be through interviews, include:
Data on the frequency of fires, traffic accidents, and crime throughout Indonesia
Scenario of PPDR events, including data on the number of personnel required in handling the PPDR events
3.5.2. Secondary data collection
Secondary data collection was done by means of literature study that include similar research, including the assumption of the scenario of events and traffic of PPDR events and data of frequency of PPDR events occurrence throughout Indonesia.
3.6.Data Analysis Technique
In this research, to calculate the broadband PPDR frequency needs the incident-based approach was used. Calculation of the amount of spectrum needed assumed to use LTE Release 10. Stages in the calculation of the frequency needs are as follows:
3.6.1. PP1
1. To define the PP1events or disaster scenarios
2. To estimate the total number of traffic requirements per events and its background traffic
3. To calculate the link budget and cell size
4. To estimate the number of events that take into account traffic simultaneously per cell
5. To estimate the total spectrum needs based on the assumption of events per cell, the scene inside the cell and spectral efficiency for each event.
3.6.2. PP2
a. To define the scenario of PP2 incidents b. To estimate the traffic incident
c. To estimate the total spectrum needs based on the assumption of the user's location in the cell and spectral efficiency
4. Results and Discussion
The identification of frequency spectrum needs for broadband PPDR can use several scenarios of events. The scenario includes the distribution of PPDR events scale into the daily operations (PP1), emergency events or public events (PP2) and disaster events (PP3). In this research, the identification of frequency spectrum needs was carried out for the scenario of PP1 and PP2 incidents.
4.1. PP1 Scenario
For PP1, PP1 scenario benchmarking used by ECC in Europe as Asia has yet to found studies on the calculation of the PPDR broadband frequency spectrum needs. ECC (ECC, 2013) is using the scenario of traffic accidents and vehicle inspection. Description of the communication needs of such scenarios include only data communications.
10
2. All information regarding to the traffic accident are submitted to the medical and emergency services (location and image)
3. The images are sent to the helicopter, video downlink to the helicopter 4. Patient information sent to the control room, then sent back to the ambulance 5. The video sent to the hospital regarding the patient at the scene
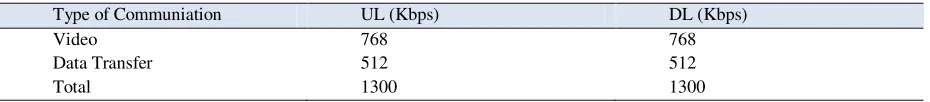
Details of traffic in the event are shown in Table 2.
Type of Communiation UL (Kbps) DL (Kbps)
Video 768 768
Data Transfer 512 512
Total 1300 1300
Source: (ECC, 2013)
To calculate the link budget, reference of uplink modulation is used since the power emitted by BTS is higher than the power emitted by the user terminal. The specifications of the uplink modulation is used, as shown in Table 3.
a. Using 4 Rx antennas on BTS
b. Using a 70% throughput performance. This assumption allows the efficiency of the spectrum to be at a good level. However, the cell size becomes smaller due to its higher SINR compared to 30% of the throughput.
c. Using EVA 70 Hz Low as channel modeling. Performance for the pedestrian type mobility (EPA 5 Hz Low) is better.
Using a 5 MHz channel performance. 5 MHz SINR value is equal to 10 MHz SINR value (although the spectral efficiency will be lower). This assumption allows for flexibility in the future (with 10 MHz channel or more).
Table 3. Reference Modulation of Uplink LTE
Uplink LTE Modulation SINR (dB) Spectrum Efficiency (bps/Hz) QPSK, CR 1/3, 5 MHz, 1x4 antena,
EVA 70 Hz Low
-3.3 0.31 (throughput 70%)
Source: (ECC, 2013)
Downlink link budget does not play a significant role as the BTS power is higher than the BTS terminal power. Downlink modulation does not specify the size of the cell. In this research, downlink modulation specification is used to determine the need for bandwidth in the downlink direction, i.e. (ECC, 2013):
a. Using 1x2 antenna configuration (only this value is provided in the 3GPP specifications). Multiple receiver antennas in the EU is a reasonable assumption for medium to long term.
b. Using the 10 MHz band (only this width is provided in the specification 3GPP) c. Propagation EVA 5 Hz (EVA 70 Hz propagation value is not provided) d. Throughput 70% to maintain good spectral efficiency.
11
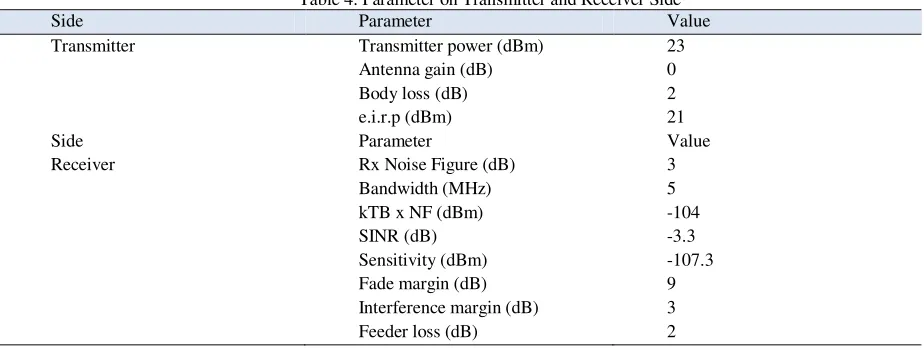
Table 4. Parameter on Transmitter and Receiver Side
Side Parameter Value
Transmitter Transmitter power (dBm) 23 Antenna gain (dB) 0
The amount of antenna gain and maximum path loss for frequency bands of 400 and 800 MHz are shown in Table 5.
Table 5. Antenna Gain and Maximum Path Loss
Frequency Band Antenna Gain (dB) Maximum Path Loss (dB)
400 MHz 13.5* 127.8
800 MHz 15.4** 129.7
Source: *(ECC, 2013), ** (Real Wireless, 2012)
Of the maximum path loss obtained, we can then seek for the farthest distance from transmitter to receiver using Okumura-Hatta propagation models. Okumura-Hatta propagation models can be used on the carrier frequency up to 1500 MHz (Singh, 2012). Assumptions of antenna height used is 30 m for the transmitting antenna and 1.5 m for the receiving antenna (ECC, 2013).
Furthermore, the cell area for dense urban, urban, suburban, and rural areas can be calculated using equation (2) as shown in Table 6. Categories of dense urban, urban, suburban, and rural areas approached with the population density (Marcus et al., 2010).
Table 6. Cell Area of Dense Urban, Urban, Suburban, and Rural Areas Frequency Band Dense Urban events is aggregated from data of crime, traffic accidents, and fires in Indonesia that occurred at a peak time.
From 2002 to 2013, the number of criminal offenses in Indonesia occurred mostly in 2011, namely 347.065 criminal offenses (BPS, 2014). Thus, in every hour, on average, almost 40 crime incidents occurred in Indonesia. Assumed, the number of events at peak times is as much as twice the average events so that at peak times 80 crime incidents occurred in Indonesia.
12
an average of nearly 14 traffic accidents in Indonesia occurred. Thus, at peak times the events occurred twice of average accidents or 28 traffic accidents in Indonesia.
In 2011, there were 16500 fires in Indonesia (Sundari, 2012) so that every hour an average of 2 fires incidents occured in Indonesia. Thus, at peak times, 4 fires incidents occurred in Indonesia. The number of events occurring simultaneously nationwide, is shown in Table 7.
The number of events that occur in a single cell is calculated from the number of population in a single cell multiplied by the number of incidents per population. Total population in a single cell is obtained from a population density of an area multiplied by the cell area for each category. Meanwhile, the number of incidents per population is the number of incidents occurring simultaneously nationwide divided by the national population.
Table 7. Number of Simultaneous Incidents Nationwide
Type of Incidents Number of Simultaneous Incidents
Criminalities Reached 80
Traffic Accidents Reached 28
Fires Reached 4
Total Reached 122
Source: processed data
Furthermore, the results of the calculation are assumed as follows:
a. For a cell in the 400 MHz band, the number of incidents per cell sector reached 2 b. For a cell in the 800 MHz band, the number of incidents per cell sector is only one
In the 800 MHz cell there are fewer simultaneous incidents than in 400 MHz cells because the 700 MHz cell coverage is smaller than the cell 400 MHz coverage. One incident is considered to occur at the periphery of cells with low spectral efficiency while the remaining are on the part of cells with higher spectral efficiency.
For the uplink, spectral efficiency used in the cell edge is 0.31 bps/Hz. Furthermore, it is assumed 16 QAM ¾ modulation used in cells so that the expected spectral efficiency is between 0.64 and 1.49 bps/Hz. Spectral efficiency used for the uplink are shown in Table 8.
Table 8. Uplink Spectral Efficiency
Scene Traffic (Kbps) Spectral efficiency (bps/Hz) Incidents at cell edge 1300 0.31 0.31
Incidents inside the cell (pessimistic) 1300 0.64 Incidents inside the cell (optimistic) 1300 1.49 Source: (ECC, 2013)
Table 9. Total PP1 Spectrum Needs Uplink Direction
Frequency Band Number of Incidents Low Estimate Medium Estimate 400 MHz 1 incident at the cell edge
In the calculation of the spectrum needs, ECC (ECC, 2013) also add background communication, where low estimate and medium estimate are of 1.1 MHz and 2.3 MHz respectively. Thus, the total needs for uplink spectrum in the 400 MHz band and 800 MHz band are as shown in Table 9.
13
Tabel 10. Downlink Spectral Efficiency
Scene Traffic (Kbps) Spectral efficiency (bps/Hz)
Incidents at cell edge 1300 0.27
Incidents inside the cell (pessimistic) 1300 0.88 Incidents inside the cell (optimistic) 1300 1.89 Source: (ECC, 2013)
In the calculation of the spectrum needs, ECC also add background communication where the low estimate and medium estimate are 0.7 MHz and 1.2 MHz respectively. Thus, the total needs for downlink spectrum in the 400 MHz band and 800 MHz band are as shown in Table 11.
Table 11. Total PP1 Spectrum Needs Downlink Direction
Frequency Band Number of Incidents Low Estimate Medium Estimate 400 MHz 1 incident at the cell edge
1 incident inside the cell and background communication
6.2 MHz 7.5 MHz
800 MHz 1 incident at the cell edge and background communication
5.5 MHz 6.0 MHz
Source: processed data
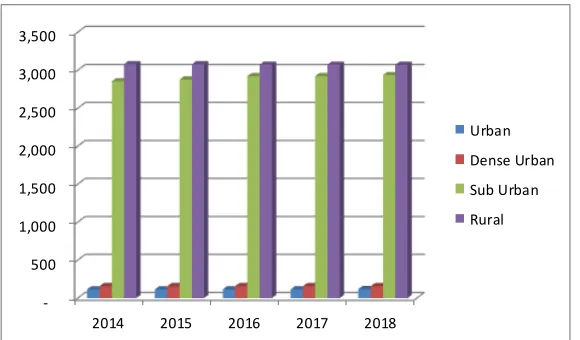
The number of sites needed in Indonesia per category of dense urban, urban, suburban, and rural in the 400 MHz band and 800 MHz band is shown in Figure 3 and Figure 4.
500 1,000 1,500 2,000 2,500 3,000 3,500
2014 2015 2016 2017 2018
Urban Dense Urban
Sub Urban Rural
Figure 3. Site Needs in the 400 MHz Frequency Band (data processed)
14
From Figure 3 and Figure 4, it is shown that the site needs for 5 years from 2014-2018 both in the 400 MHz band and the 800 MHz band has relatively not increased significantly. From the calculation, the number of sites required in 2014 in the 400 MHz band and 800 MHz band are 6200 and 11368. Meanwhile, in 2018, the number of sites required in 2014 in the 400 MHz band and 800 MHz band rose to 6275 and 11519 along with the estimated population increase.
4.2.PP2 Scenario
PP2 incident scenario used are fire scenario in Pasar Senen based on the scenario made by the Fire Department and Disaster Management of Jakarta Province. This scenario is a worst case scenario in the last three years in the Jakarta province because it involves a large number of personnel and firemen fleets. The scenario of the incident is as follows:
"On 25 April 2014 at 3:30 incidents of jaya 65/Fire at Pasar Senen Floor 1. Incoming information received by the Fire Department Post-PB "Bungur" informed that the fire incident which occurred at 03:40 which is then immediately followed up with a report to the command and communications center Sub-distric office of Fire Department-PB Central Jakarta and to the Picket Officer who immediately assign the nearest posts to immediately drove to the scene, namely Cempaka Putih Post, Cempaka Putih Sector, Johar Baru Sector, Serdang Post, Kemayoran Sector, Menteng Post, Jatibaru Post, Walikota Post and of the Sub-distric Office.
At 03:45 officers of the Bungur Post already fighting the fire which was followed by other units. The fire occurred probably derived from an electric short circuit from one of the store/kiosk in the middle part of floor 1, which then emit sparks and striked the flammable materials to then enlarge and spread to the adjoining shops.
In the event of fire at Pasar Senen, the Fire Department-PB deployed a fleet of: a. Day 1 (25 April 2014): 57 Units with 250 Personnel
b. Day 2 (26 April 2014): 58 Units with 255 Personnel c. Day 3 (27 April 2014): 44 Units with 220 Personnel
d. On Day 2 they received help from Brimob Water Canon Team and Helicopters of Polda Metro Jaya
Frequency spectrum needs for fires at Pasar Senen can be calculated by assuming the communications services used and the number of personnel involved in the incident. Bandwidth requirements for data communication services used during fires refers to the study of the Canadian spectrum needs (Lucente, 2011), while the number of personnel involved refers to the organizational structure of management of fire prevention in Indonesia (Ministry of Public Works, 2000) modified based on the ideal number of personnel and a fleet of firefighters in the United States (J.Karter & Stein, 2013).
The organizational structure of fire prevention is in accordance with the Decree of the Minister of Public Works No. 11/KPTS/2000 as follows:
a. Person in charge
b. Head of Mechanical Maintenance Division, supervises: 1. Monitor and communication room operator,
2. The lift operator,
3. The electricity and generators operator,
4. The air conditioning and ventilation operator, Pump operator c. Head of Security, in charge of:
1. Fire Fighter Team (Tim Pemadam Api/TPA),
15 Whereas, the number of fire-fighting personnel and equipment in the United States in 2012 are shown in Table 12.
Table 12. Number of Fire-Fighting personnel and equipment in the United States
No Description Number
1. Fire Fighter Personnel 1,112,250 2. Number of Sub-distric Office 51,650 3. Supporting Unit
* Assuming ideally each department has an emergency medical services
Table 13. Number of Service Users on Fire Incidents at Pasar Senen
No Description Number
1. Person In Charge 1
2. The Head of Mechanical Maintenance 1 3. Monitors and communication room operator 3
Lift operator 2
Electricity and generator operator 2 Air conditioning and ventilation operator 2
Pum operator 4
Based on the scenario of fire incident in Pasar Senen, it takes at most 58 units. From Table 11, and based on the organizational structure of the fire-fighting management based on the Decree of the State Minister of Public Works No. 11/KPTS/200, it can be assumed and adjusted the number of users in the fire incident in Pasar Senen is as shown in Table 13.
Application data speeds for uplink (UL) and downlink (DL) which is used in the event of fire are shown in Table 14. The National Telecommunications and Information Administration's (NTIA) of the United States recommend a minimum data rate for tactical video standard definition at 768 kbps for H.264.
Table 14. Applications Data Rate
Application Data Rate (kbps) Description
DL UL
Video applications
16
Application Data Rate (kbps) Description
DL UL
1152 1152 Viewing video imagery on monitors, per selected feed
Ambulance patient video
0 768 Viewing video imagery on monitors, per selected feed
Public transit video (LR) 64 64 Distribution of public transit video for composite view, constant streaming
Public transit video (HR)
384 384 Viewing video imagery on laptops, per selected feed
Video Conferencing 384 384 Per user
News feed 768 0 Streamed to users on demand Collaborative Tools 50 50 Average data rates per user Database access and records
System capacity needs are estimated using LTE technology (LTE release10). If the capacity needs are only calculated based of peak time traffic, it will cause over-dimensioning. Spectrum remain outside the peak time is not used while the network costs remain high. In this case, overbooking factor (OBF) should be defined. OBF is the average number of users who can share a given channel unit. Channel unit used in the dimensioning is the peak data rate (Basit, 2009).
OBF assumptions used in this research is 20:1, except for patients application with high-resolution that are time critical of 4:1. Furthermore, the spectral efficiency is assumed to be used by an average of 1.49 bps/Hz for uplink and 1.89 bps/Hz for downlink so that the capacity and frequency needs are as shown in Table 14.
Table 14. PP2 Spectrum Needs of Pasar Senen Fire
Direction Capacity (Kbps) Efficiency Spektral (bps/Hz) Spectrum Needs (MHz) Uplink 12044.5 1.49 15.28
Downlink 28880.9 1.89 8.28 Source: processed data
17
5. Summary
5.1.Conclusion
From the calculation, for PP1 incidents consisting of incidence of crime, traffic accidents and fires, the amount of frequency spectrum required are 6.2-8.5 MHz and 5.3-6.5 MHz for uplink in the 400 MHz band and 800 MHz band. Whereas, the need for downlink spectrum is 6.2-7.5 MHz and 5.5-6 MHz in the 400 MHz band and 800 MHz band. Thus, spectrum needs for PP1 incidents in the 400 MHz band or the 800 MHz band is estimated at 2x10 MHz for LTE FDD. If using LTE TDD it is estimated at 20 MHz in the 400 MHz band and 15 MHz in the 800 MHz band. The number of sites required in the 400 and 800 MHz band to 2018 reached 6275 and 11519.
Meanwhile, the results of calculations for the PP2 incidence of fires at Pasar Senen shows bandwidht with a spectral efficiency by an average of 15.28 MHz for downlink and 8.08 MHz for the uplink. Thus, spectrum needs for PP2 is estimated at 2x20 MHz when using LTE FDD or 30 MHz when using LTE TDD (with guard band). Overall, the need for spectrum to accommodate PP1 and PP2 incidents assumed to be equal to the spectrum needs for PP2.
5.2.Suggestion
This study identified the need to accommodate the frequency for PP1 and PP2 incidents. For further studies, it is necessary to identify the frequencies needs of PPDR broad band for PP3 incidents or large-scale disasters.
6. Acknowledgements
The author would like to thank all those who have helped in this research, especially the Center for Research and Development of Resources and Equipment of Post and Informatics, which has funded this research and Mr. Bastari Miral who helped the author in relation to the research substances.
Bibliography
Abdulkafi, A. A., Kiong, T. S., Koh, J., Chieng, D., Ting, A., & Ghaleb, A. M. (2012). Energy Efficiency of LTE Macro Base Station. In 1st IEEE International Symposium on Telecommunication Technologies (pp. 259–264).
Anritsu Company. (2010). Testing the Future LTE Resource Guide. web.cecs.pdx.edu.
APT. (2013). Technical Requirements for Mission Critical Broadband PPDR Communications. Bangkok.
Basit, A. (2009). Dimensiossning of LTE Network: Description of Models and Tool, Coverage and Capacity Estimation of 3GPP Long Term Evolution radio interface. Helsinki University of Technology.
Belhouchet, M. L., & Ebdelli, M. H. (2010). ITU/BDT Arab Regional Workshop on “4G Wireless Systems” LTE Technology
(Session 5 : LTE Technology Perofrmance Evaluation). ITU-D.
BPS. (2012). Statistics Indonesia. Retrieved October 23, 2014, from http://bps.go.id/tab_sub/view.php?kat=2&tabel=1&daftar=1&id_subyek=17¬ab=14
BPS. (2014). Jumlah Tindak Pidana Menurut Kepolisian Daerah, 2000 - 2013. Retrieved November 18, 2014, from http://www.bps.go.id/tab_sub/view.php?kat=1&tabel=1&daftar=1&id_subyek=34 ¬ab=1
Braithwaite, C., & Scott, M. (2003). Chapter Six. Influence of Link Budgets on 3G Coverage. In UMTS NETWORK PLANNING AND DEVELOPMENT (pp. 119–152).
Direktorat Penataan Sumber Daya. (2013). Draft Konsep Penataan Radio Trunking dan Government Radio Network untuk Pembebasan Frekuensi Mobile Broadband. Jakarta: Kementerian Komunikasi dan Informatika.
ECC. (2013). ECC Report 199 : User Requirements and Spectrum Needs for Future European Broadband PPDR systems (Wide Area Networks).
18
Hamid, N. I. Bin, Kawser, M. T., & Hoque, M. A. (2012). Coverage and Capacity Analysis of LTE Radio Network Planning considering Dhaka City. International Journal of Computer Applications (0975, 46(15), 49–56.
ITU. (2003). Report ITU-R M . 2033 : Radiocommunication Objectives and Requirements for Public Protection and Disaster Relief.
ITU. (2012). World Radiocommunication Conference 2015 (WRC-15) : Agenda and Relevant Resolutions (Vol. 2015). J.Karter, M., & Stein, G. P. (2013). US Fire Department Profile 2012.
Kementerian Komunikasi dan Informatika. Perubahan Kedua Atas Peraturan Menteri Komunikasi dan Informatika Nomor :
29/PER/M.KOMINFO/07/2009 Tentang Tabel Alokasi Spektrum Frekuensi Radio Indonesia. , Pub. L. No. 25/PER/M.KOMINFO/12/2010 (2010). Indonesia.
Korlantas Polri. (2014). data kecelakaan lalu lintas.
Lewis, J. (2012). Outcomes of the Working Group Spectrum Aspects of the APT Wireless Group (AWG) from the 12th Meeting of AWG, 10 – 13 April 2012, Xiamen, PR China.
Lucente, C. (2011). 700MHz Spectrum Requirements for Canadian Public Safety Interoperable Mobile Broadband Data Communications.
Marcus, J. S. (2013). The Need for PPDR Broadband Spectrum in the Bands Below 1 GHz. Bad Honnef.
Marcus, J. S., Burns, J., Jervis, V., Wahlen, R., Carter, K. R., Philbeck, I., & Vary, P. (2010). PPDR Spectrum Harmonisation in Germany , Europe and Globally. Bad Honnef.
Miral, B. (2014). Kajian Awal: Perencanaan Jaringan Public Protection and Disaster Relief di Indonesia. Jakarta. Molisch, A. F. (2011). Wireless Communications, Second Edition. John Wiley & Sons, Ltd.
Puspita, R. H., & Mahmudah, H. (2011). Perhitungan Link Budget Pada Komunikasi GSM di Daerah Urban Cluster Central Business Distric ( CBD), Residences, dan Perkantoran (pp. 1–7). Surabaya.
Real Wireless. (2012). Methodologies used for the analysis of costs relating to a coverage obligation at 800MHz: For existing sites and using MIP sites. West Sussex.
SATRC Working Group on Spectrum. (2012). SATRC Guideline on Harmonized Use of Frequency Bands for Public Protection and Disaster Relief (PPDR).
Setiawan, D. (2010). Alokasi Frekuensi : Kebijakan dan Perencanaan Spektrum Indonesia. Jakarta: Departemen Komunikasi dan Informatika.
Singh, Y. (2012). Comparison of Okumura , Hata and COST-231 Models on the Basis of Path Loss and Signal Strength, 59(11), 37–41.
Sundari. (2012). Jumlah Kebakaran Jakarta Tertinggi di Indonesia. Retrieved October 23, 2014, from http://www.tempo.co/read/news/2012/03/01/083387365/Jumlah-Kebakaran-Jakarta-Tertinggi-di-Indonesia
Tabbane, S. (2013). Long Term Evolution : Radio Network Planning. Nadi. Telstra. (2012). Delivering 4G / LTE Mobile Broadband for Emergency Services.
Ure, J. (2013). Public Protection and Disaster Relief ( PPDR ) Services and Broadband in Asia and the Pacific : A Study of Value and Opportunity Cost in the Assignment of Radio Spectrum (pp. 1–61).