Indah Hermyati, 2014.
CHAPTER III
RESEARCH METHODOLOGY
This chapter provides research method, hypothesis, data collection, the procedures of conducting the research, and data analysis. Research method consists of research design, variable, hypothesis, population, sample, and data collection instruments. In data collection, there are research instrument and research procedure. The last is data analysis. In the data analysis, there are scoring technique, data analysis on pilot test, data analysis on pre-test and post-test, and data analysis of questionnaire.
3.1 Research Method
3.1.1 Research Design
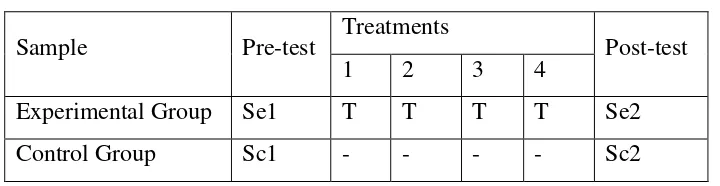
This study is an experimental research that used quantitative method naturally in order to find the objective of the study. Geoffrey (2006) conveys that experimental research is used to test the hypothesis to find out the cause-effect relationship between two variables. The research design is quasi-experimental because this study had a little control over the allocation of the treatment or other factors being studied. Table 3.1 presents the research design of this study:
Table 3.1
Sample Pre-test Treatments Post-test
1 2 3 4
Experimental Group Se1 T T T T Se2
Indah Hermyati, 2014.
Notes:
Se1: pretest for the experimental group
Sc1: pretest for the control group
Se2: posttest for the experimental group
Sc2: posttest for the control group
T: Treatment (giving some activities to students related to MUF Framework)
From the table above, two classes were selected in this study, one class as the experimental group and one class as the control. Both of the groups got the
pretest and posttest. Before giving posttest, the treatment was given to the experimental group. After the data was collected from pretest and posttest, it was compared to investigate its significance.
3.1.2 Variables
Variable is a characteristic of an individual or an organization that a researcher can measure or observe and varies among individuals or organizations
study (Creswell, 2012). There are variables in this study, which were dependent variable and independent variable. Dependent variable is an attribute that is dependent which get the effect from independent variable (Hatch & Farhady, 1982). Dependent variable is achievement score of a test or students’ learning outcome (Creswell, 2012). Independent variable is an attribute that influences the outcome or dependent variable. In this study, the dependent variable is speaking scores of young learners and the independent variable is MUF framework.
3.1.3 Hypothesis
Indah Hermyati, 2014.
- There is no significant difference in mean adjustment between pretest and posttest (null hypothesis). It means that there is no difference in mean between variables in this study, which were dependent variable and independent variable.
- There is a significant difference in mean adjustment between pretest and posttest (alternative hypothesis). It means that there is a difference in mean between variables in this study, which were dependent variable and independent variable.
3.1.4 Population and Sample
According to Creswell (2012), population is a large group of objects or subjects with specific qualities and characteristics which becomes the researcher’s interest to investigate and finally to get a conclusion. The population of this study
was fourth grade students from one elementary school in Tasikmalaya. From the population, two classes were chosen as the samples. The first class was IVA as the
control group which consisted of 20 students. This group was not given the treatment. The second class was IVB as the experimental class which was given the treatment (using MUF Framework). Fourth level students were chosen as the sample because at this level English was started to be taught to the students. In addition, IVA and IVB had the same level in English competence.
3.2 Data Collection
3.2.1 Research Instruments
Instruments were needed to gather the data from the sample which was
going to be analysed to answer the research questions. Two instruments were used in this study. There were speaking tests for pretest and posttest and questionnaire.
3.2.1.1 Speaking Test
Speaking tests were used to measure the students’ speaking ability in describing things related to the topic which were colours, clothes and occupations. Even though MUF framework was focused on grammar, but in this context,
Indah Hermyati, 2014.
pronunciation, vocabulary, grammar, and accuracy. These criteria were available to be applying in both groups.
Speaking tests were conducted two times. The first was in the pre-test and the second was in the post-test. The test was assesed by two raters, who are reseacher and the English teacher. The score of both speaking tests were analysed by using T-test for assessing the effectiveness of using MUF Framework.
3.2.1.2 Pretest and Posttest
Pretest was administered in both groups to get the initial difference between both groups which have similar level of speaking before they got treatment by the use of MUF framework.
After conducting the pretest, the experimental group was given the treatment that was the use of MUF framework. The treatment was given in four
meetings. In every meeting, students had to speak up based on the discussed topic to get participation score.
The posttest was given to both experimental and control groups. The posttest was given after the treatments to discover whether there was a significant improvement of students’ speaking skill. Then, the students’ score of pretest and posttest were computed by using SPSS 20 then the result was interpreted.
3.2.1.3 Questionnaire
The data was also collected by conducting the questionnaire. This section was only conducted in the experimental group in order to discover the students’ attitude, opinion, and perspective about the learning process from the first until the last meeting. Milne (1999) says that questionnaire is more objective than the interview because the responses are gathered in standardized way; moreover it is relatively quick to collect information by using the questionnaire.
3.3 Research Procedure
3.3.1.1 Lesson Planning
Indah Hermyati, 2014.
that were suitable with the aspects needed. Furthermore, the researcher also managed the teaching procedures by measuring the time allotment, exploring students’ condition and checking facility that the school has to provide learning process.
3.3.1.2 Administering the Pilot Test
Before the pretest and posttest were conducted, the speaking test was pilot-tested first. Pilot test is a procedure in which a researcher makes changes in an instrument based on the result or feedback from a small number of individuals who complete and evaluate the instrument (Creswell, 2012). The pilot test was used to find out the weaknesses of the test and create the opportunities of the test (pretest and posttest) for experimental and control group.
The sample of pilot test was taken from fifth graders from another
elementary school in Tasikmalaya. Ten students were chosen as the sample of pilot test. The students were asked to have conversation in pairs.
The students were given the test and they were asked to do the test based on the instruction from the researcher. If the students were confused when they were doing the test or they could not understand the instruction, it means that the test was not face valid. If this condition happened, the students should be asked about the instruction or on what part of the instruction they could not understand. When the unclear instruction had been fixed, the test item could be said to have face validity. On the other hand, the students were tested in order to check whether the test had content validity. If there were some students performed the particular language aspects and expressionwhich wereexpected to be measured in the test, it means that the test has content validity. After the pilot test was proved, the test was given to the students in the pretest and posttest.
3.3.1.3 Administering Pretest
Indah Hermyati, 2014.
as the control group and class IV B as the experimental group on October 22, 2013.
3.3.1.4 Conducting the Treatment
The treatment was given to the experimental class. The treatment was given in four meetings by using UF Framework as a treatment in teaching English to young learners. A lesson plan was prepared by researcher for each meeting which was able to support the English learning process.
During the treatment, the learning process used MUF Framework which consists of the main aspects, which are meaning, use, and form that should be provided in each meeting. There were three topics were colours, clothes, and occupations.
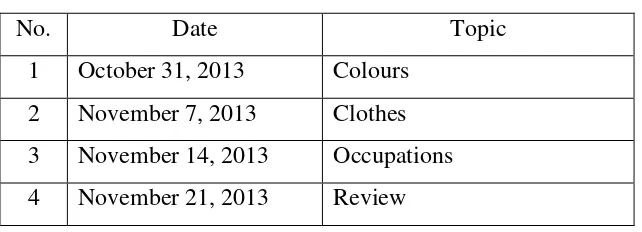
Table 3.2 shows the treatment schedules:
Table 3.2
No. Date Topic
1 October 31, 2013 Colours
2 November 7, 2013 Clothes
3 November 14, 2013 Occupations 4 November 21, 2013 Review
In order to get the clear description about MUF framework, a brief description of implementation of the method which was used in both classes was given below:
3.3.1.5 The Description of Grammar-Translation Method Implementation
in Control Group
Indah Hermyati, 2014.
not use learning media that had been used in experimental class. She just focused on the textbook. In the first stage, she wrote some words and their meanings in the blackboard. Next, the students were asked to read the word aloud and they had to memorize words and each meanings. After that, she gave a chance to the students to write down the material that they have learnt.
3.3.1.6 The Description of MUF Framework Implementation in Experimental Group
In the beginning of the learning process, the researcher had prepared a lot of media such as puppet, pictures, and song. Before the material was delivered to the students, the class was started by making some rules that should be obeyed by the students and also the researcher.
As has been stated before, the first stage of MUF framework is meaning. At meaning stage, the researcher prepared a contextual learning around the class to be presented the meaning of the language. The topic in the first meeting was colours. Before listing colours, the researcher explained the expression of asking for the colours by showing some media and also using song and story.
At the second stage, which is use stage, the students were given the
opportunities to use the language that they have learnt. On this stage, the researcher asked the students to work in pairs. After that, the researcher pointed some students to act out the story.
On the form stage, teacher gave exercise to the students to gain the awareness of the language form of the sentences. After they did the exercise, the students and the researcher discussed the result of the students’ exercise.
3.3.1.7 Administering Posttest
Indah Hermyati, 2014.
3.3.1.8 Administering Questionnaire
The questionnaire was given to all of the students in experimental group in order to discover the students’ responses toward the new method that have been used by the researcher. Questionnaire items could be open or closed-ended (Nunan, 1992). The questionnaire that had been used in this research was closed-ended questionnaire. The researcher had to determine options of the responses or answers. The questionnaire was administered after the posttest were delivered to the students on the same day.
3.4 Data Analysis
3.4.1.1 Scoring Technique
Student Oral Language Observation Matrix (SOLOM) was used to assess the speaking skill of the students in the pretest and posttest. SOLOM is a rating scale that teachers can use to assess their students’ command of oral language on the basis of what they observe on a continual basis in a variety of situations, such as class discussions, playground interactions, encounters between classes (San Jose Unified School District (2010). “Student Oral Language Observation Matrix (SOLOM”), Para 2). The teacher matches a student's language performance in a five mains, they are listening comprehension, vocabulary, fluency, grammar, and pronunciation - to descriptions on a five-point scale for each.
The score and criteria of SOLOM are represented as follows:
Assessment Criteria of Comprehension
Score Criteria
1 Cannot be said to understand even simple conversation.
2 Has great difficulty following what is said. Can comprehend only social conversation spoken slowly and with frequent repetitions.
3 Understands most of what is said at slower-than-normal speed with repetitions.
Indah Hermyati, 2014.
repetition may be necessary.
5 Understands everyday conversation and normal classroom discussions.
Assessment Criteria of Fluency
Score Criteria
1 Speech so halting and fragmentary as to make conversation virtually impossible.
2 Usually hesitant: often forced into silence by language limitations.
3 Speech in everyday conversation and classroom discussion frequently disrupted by the student's search for the correct manner of expression
4 Speech in everyday conversation and classroom discussions generally fluent, with occasional lapses while the student searches for the correct manner of expression.
5 Speech in everyday conversation and classroom discussions fluent and effortless; approximating that of a native speaker.
Assessment Criteria of Vocabulary
Score Criteria
1 Vocabulary limitations so extreme as to make conversation virtually impossible.
2 Misuse of words and very limited: comprehension quite difficult.
3 Student frequently uses wrong words: conversation somewhat limited because of inadequate vocabulary.
4 Student occasionally uses inappropriate terms and/or must rephrase ideas because of lexical inadequacies.
5 Use of vocabulary and idioms approximate that of a native speaker.
Assessment Criteria of Pronunciation
Indah Hermyati, 2014.
1 Pronunciation problems so severe as to make speech virtually unintelligible.
2 Very hard to understand because of pronunciation problems. Must frequently repeat in order to make him/herself understood.
3 Pronunciation problems necessitate concentration on the part of the
listener and occasionally lead to misunderstanding.
4 Always intelligible, although the listener is conscious of a definite accent and occasional inappropriate intonation patterns.
5 Pronunciation and intonation approximate that of a native speaker.
Assessment Criteria of Grammar
Score Criteria
1 Errors in grammar and word order so severe as to make speech virtually unintelligible.
2 Grammar and word order errors make comprehension difficult. Must often rephrase and/or restrict him/herself to basic patterns.
3 Makes frequent errors of grammar and word order that occasionally
obscure meaning.
4 Occasionally makes grammatical and/or word order errors that do not obscure meaning.
5 Grammar and word order approximate that of a native speaker.
3.4.1.2 Data Analysis on Pilot Test
Indah Hermyati, 2014.
and content validity, the items were given to the students in the pretest and posttest.
3.4.1.3 Inter-rater Reliability
Inter-rater reliability is used to examine the agreement between two people which are raters or observers on the assignment of categories of a categorical variable. It is an important measure in determining how well an implementation of some coding or measurement system works (Texasoft, 1998, Inter-rater reliability (Kappa) using SPSS, para. 1).
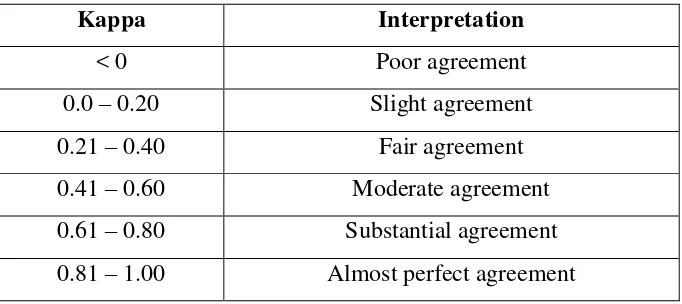
A statistical measure of inter-rater reliability is Cohen’s Kappa which ranges generally from 0 to 1.0 although negative numbers are possible where large numbers mean better reliability, values near or less than zero suggest that agreement is attributable to chance alone. The interpretation of the obtained data is given in the following table:
Table 3.3
Cohen’s Kappa Statistical Measure of Inter-rater Reliability
Kappa Interpretation
< 0 Poor agreement
0.0 – 0.20 Slight agreement
0.21 – 0.40 Fair agreement
0.41 – 0.60 Moderate agreement 0.61 – 0.80 Substantial agreement
0.81 – 1.00 Almost perfect agreement
(Landis & Koch, 1977) in Texasoft, 1998
3.4.1.4 Data Analysis on Pretest and Posttest
Indah Hermyati, 2014.
Independent t-test in analysing pretest result was designed to prove that both groups were similar. Fraenkel and Wallen (1990) state that Independent t-test is a tool to determine whether there is a significant difference between the means of two independent samples. The equivalence of both groups was the requirement to conduct the Independent t-test for both groups’ posttest which is used to determine the effectiveness of the implementation of the treatment. After the equivalent of both groups were verified, the next step was calculating posttest’s scores of both groups by using the Independent t-test which was aimed to find out
the effectiveness of the implementation M-U-F framework
3.4.1.5 Normal Distribution Test
In investigating the normal distribution, the researcher used Kolmogrov-Smirnov’s formula through IBM SPSS Statistics 20 for Windows. There are three steps in conducting the normal distribution which are setting the null hypothesis (H0) in the alpha level, analysing the normally distribution with Kolmogrov-Smirnov’s formula, and explaining the result. In this case the alpha level is 0.05, which is two-tailed test. Explaining the result means testing the hypothesis, thus if the significance level > 0.05, then t he null hypothesis (H0) is accepted which means the distribution of data is normal. On the other side, if significance level < 0.05, the null hypothesis (H0) is rejected which means the distribution of the data is not normal.
3.4.1.6 Homogeneity of Variance
This study used Levene’s formula from IBM SPSS Statistics 20 for
windows to find out the homogeneity of variance. There are three steps in
Indah Hermyati, 2014.
hypothesis (H0) is rejected. It means that the score of experimental and control group are not homogeneous.
3.4.1.7 Independent t-test
Coolidge (2000) states that the Independent t-test is used to analyse a connective relationship between the independent variable which is treatment and the dependent variable that is measured on both groups. Independent t-test is also used to find out the difference mean between two groups. There are three steps in conducting Independent t-test. First is setting the null hypothesis (H0) in the alpha level. The alpha level was set at 0.05. Second is calculating and analysing the Independent t-test by IBM SPSS Statistics 20 for Windows. The last is comparing the result with the significance level. If the result > 0.05, the null hypothesis (H0) is accepted which means there is no significant difference between experimental
and control group. In other side, if the result < 0.05, the null hypothesis (H0) is rejected which means that there is the significant difference of mean between both
groups.
3.4.1.8 Dependent t-test
The Dependent t-test was used to find the difference between two groups’ means in experimental group in which the participants in both groups were related
to each other in some ways. The dependent variable was expected to have normal distribution and the variance of the two groups should be homogenous.
In this study, the dependent sample test was analysed using computation
IBM SPSS Statistics 20 for Windows by comparing the significance value with the
Indah Hermyati, 2014.
3.4.1.9 The Calculation of Effect Size
The effect size was used to determine how far the effect of independent variable upon the dependent variable (Coolidge, 2000). If the treatment worked as detected by a large different between two groups’ mean, it means that there was a large effect size. But, if the difference between both groups’ mean is small, it means there is small effect size.
3.4.1.10 Data Analysis on the Questionnaire
The data from the questionnaire session was analysed by using Likert’s scale to analyse the obtained data. Likert’s scale is a psychometric scale to primarily used to find participant’s preferences with a statement or set of statements. The researcher used the percentage formula to analyse the questionnaire’s data. Then, the data was explained based on the frequency of the students’ answer.
Concluding remark
This chapter has already conveyed the research method that was used in this study, which was designing the lesson plan, administering the pilot test, administering pretest, giving the treatment, administering posttest, and administering questionnaire which have already been explained specifically in Research Procedure. The setting and participants of this study were also mentioned in this chapter.
The next chapter exposes the findings of this study and also the discussion.