URBAN GEOCACHING.
WHAT HAPPENED IN LISBON DURING THE LAST DECADE?
R. Nogueira Mendes a, *, T. Rodrigues a, A. M. Rodrigues a
a
e-GEO - Research Centre for Geography and Regional Planning, Faculdade de Ciências Sociais e Humanas (FCSH),
Universidade Nova de Lisboa, 1069-061 Lisboa, Portugal - (rnmendes, teresasantos, amrodrigues)@fcsh.unl.pt
Commission #### ##### ####
KEY WORDS: Geocaching, Urban environments, Recreational activities, Spatial Analysis, GIS
ABSTRACT:
Created in 2000 in the United States of America, Geocaching has become a major phenomenon all around the world, counting actually with millions of Geocaches (or caches) that work as a recreational motivation for millions of users, called Geocachers. During the last 30 days over 5,000,000 new logs have been submitted worldwide, disseminating individual experiences, motivations, emotions and photos through the official Geocaching website (www.geocaching.com), and several official or informal national web forums. The activity itself can be compared with modern treasure hunting that uses handheld GPS, Smartphones or Tablets, WEB 2.0, wiki features and technologies to keep Geocachers engaged with their activity, in a strong social-network. All these characteristics make Geocaching an activity with a strong geographic component that deals closely with the surrounding environment where each cache has been hidden. From previous work, significance correlation has been found regarding hides and natural/rural environments, but metropolitan and urban areas like Lisbon municipality (that holds 3.23% of the total 27534 Portuguese caches), still registers the higher density of Geocaches, and logs numbers. Lacking “natural/rural” environment, Geocaching in cities tend to happen in symbolic areas, like public parks and places, sightseeing spots and historical neighborhoods. The present study looks to Geocaching within the city of Lisbon, in order to understand how it works, and if this activity reflects the city itself, promoting its image and cultural heritage. From a freely available dataset that includes all Geocaches that have been placed in Lisbon since February 2001, spatial analysis has been conducted, showing the informal preferences of this activity. Results show a non-random distribution of caches within the study area, similar to the land use distribution. Preferable locations tend to be in iconic places of the city, usually close to the Tagus River, that concentrates 25% of the total caches. Since most of these places are known to be touristic destinations, the TOP15 logged Caches were also analyzed regarding their description and logs in order to understand if Geocaching reflects tourism and if it works as a tourist promotion tool within urban environments. Final results also reflect the Geocaching performance and major trends within urban environments providing new insights regarding this activity impacts and implications.
.
* Corresponding author. This is useful to know for communication with the appropriate person in cases with more than one author.
1. INTRODUCTION
1.1 What is Geocaching?
Geocaching can be considered a modern treasure hunting that mixes high-tech technologies (handheld GPS, Smartphones or Tablets), modern communication tools, like WEB 2.0, wiki features (with constant users interactions) and open space or out door activities, resulting into a strong-social network among
Geocahers. In it’s full sense it is a true grownups’ playground (Santos et al., 2012) that involves all kind of users, from all ages all over de world.
Created in the United States of America in 2000 after the discontinued use of “Selective Availability” within the Global Positioning System, the main idea of this organized leisure activity (Hawley, 2010) is for users to find hidden containers called Geocaches (or caches), and to register their “founds” in each caches logbooks. Latter on or immediately, depending on the ability of the Geocachers to connect to the web, each “found”, “not found” (or any kind of comment) should be logged on the cache webpage sharing experiences, motivations,
emotions and photos with the entire geocaching community trough the official website (www.geocaching.com). Presently there are 12 different types of Geocaches (Traditional Cache; Multi-Cache (Offset Cache); Project A.P.E. Cache; Mystery or Puzzle Caches; Letterbox Hybrid; Wherigo™ Cache; Event Cache; Mega-Event Cache; CITO™ - Cache In Trash Out Event; EarthCache; Groundspeak Headquarters Cache; GPS Adventures Maze Exhibit) of several sizes (nano; micro; small; regular; large; other) that, together with its location can virtually makes each of the over 2,000,000 caches hidden worldwide unique.
Being a web and technological based activity changes and evolutions have occurred during this last decade. Different caches types (Virtual, Webcam and Locationless (Reverse) Caches) have moved from Geocaching to a different game – Waymarking (www.waymarking.com) owned by the same company (Groundspeak, Inc. that also owns Wherigo.com™ and CITO™) and other similar projects emerged. Opencaching (www.opencaching.com), Munzee (www.munzee.com), Degree Confluence Project (confluence.org) among others, mainly International Archives of the Photogrammetry, Remote Sensing and Spatial Information Sciences,
supported by users but also private companies or by the biggest GPS brands trough dedicated apps or softwares.
1.2 Previous studies on Geocaching
Besides some short, snappy journalistic articles, lengthy books for beginners on how to get started in the game (Zeng, 2011), and despite the impressive numbers of geocaching activity (over 5,000,000 logs submitted worldwide every month), until the moment little study has been done. Some studies addressed computational aspects, others refer the use of the activity as a pedagogic tool, but very few have deal with motivational or geographical issues related with Geocaching. (Neufeld et al., 2008) developed an autonomous system for robot navigation outfitted for Geocaching. Neustaedter et al. (2013) has studied this activity in terms of game creation and orchestration, suggesting how lessons from Geocaching could be applied more broadly to location-based game design. Matherson et al. (2008) refers Geocaching as “an exciting teaching tool for social studies classroom”, Bragg et al. (2011) used it to enhance mathematics and Ihamäki (2007) has use it in a more obvious but still less explored way, i.e. to teach GPS technologies. Swartling and Threet (2009) has proposed its use “to promote the learning of chemistry concepts by students and by the public” trough puzzle problems, a practice that is common among Mystery, Puzzle or Letterbox Hybrid Caches. Other science field that uses this open space activity widely to promote its scientific and cultural knowledge is Geology, with special emphasis on the work promoted Geological Society of America with Earth Caches, (Lewis, 2013) (Lewis & McLelland, 2007). In terms of practices and motivations Hooper and Rettberg (2011) has compared Geocahing and GOWALLA (a geosocial network), and O'Hara (2008) defines Geocaching as an “end point in a much larger part of the consumption experience”, since it involves “an opportunity for social occasions” and it is an “ongoing practice that builds over time”. On other hand Hawley (2010) has found some deviant and intrusive behaviors in the act of finding and logging a cache that resembles the emotional process of burglars and thieves.
In terms of geographical aspects Weber & Haug (2012) has studied this activity in Germany, Vítek (2013) measured cache densities in Europe and Santos et al. (2012) has analyzed its temporal and spatial distribution in Portugal over a decade. Nevertheless all these works faces a particular aspect of Geocaching: each dataset used represents a single picture of Geocaching in a certain moment. Top logged or founded caches in a country or region today, might be disabled or archived tomorrow, making it difficult to study. Either way, due to the total amount of caches and logs, major trends or average behaviors should be noted, and with proper sampling schemes and analytical technics, it should also be easy monitor in order to fully understand Geocaching.
From previous work, significance correlation has been found regarding hides and natural/rural environments (Santos et al., 2012), but metropolitan and urban areas like Lisbon municipality (that holds 3.23% of the total 27534 Portuguese caches), still registers the higher density of caches, and logs numbers. Lacking “natural/rural” environments, Geocaching in cities tend to happen in symbolic areas, like public parks and places, sightseeing spots and historical neighborhoods. Like other open-air activities in temperate regions, Geocaching in Portugal shows weekly and seasonal patterns (weekends tend to have more activity than working days, like spring/summer
seasons compared to latte fall and winter), but in a urban environment it could be different.
The present study looks to Geocaching within the city of Lisbon, since the first geocache was hide in 2001, in order to understand how it works, and if this activity reflects the city’s image, promoting its culture and heritage.
2. STUDY AREA AND DATASETS
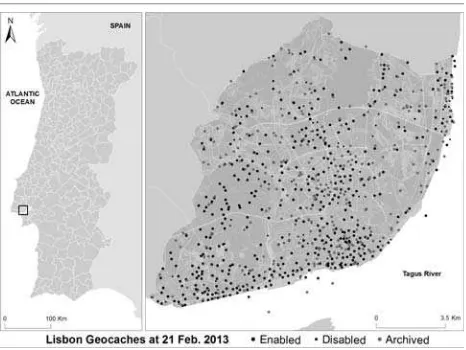
The area selected for this study (Figure 1) was the city of Lisbon (85 Km2) that holds 547,733 (2011) inhabitants within its 53 parishes. Being the capital of Portugal and located within a Metropolitan area that holds near 2.5 million inhabitants, the city receives several hundred thousands migrants on a regular working day. In terms of its geography the city is characterized by 3 aspects: a waterfront of 25 km turned to the Tagus River, 7 hills and a forest park of 10 Km2 that characterize how the city’s life usually flows. It Mediterranean clime together with its cultural and millenary historical heritage, make it a world touristic destination with over 6.5 million international airport arrivals (52 % of total Portugal international arrivals in 2012).
Figure 1. Study Area. Left side shows mainland Portugal and its 278 Municipalities. Right side shows Lisbon Municipality and
the total 884 Geocaches that constitute the selected dataset.
The most important was collected from GeoPT.org, one of the Portuguese web forums, on February 21st 2013. This includes all Portuguese caches, with unique geocode and cache location (lat/long WGS84 coordinates), as well as a total of 32 attributes (cache name and owner, date hidden, difficulty to find it, difficulty to progress in the terrain, total founds, not founds and logs, average size of logs, number of pictures uploaded by geocachers that have found it, dates regarding firsts log, found and not found, etc.). In order to restrict the dataset to the study area, only the Geocaches belonging to Lisbon municipality were kept, in a total of 890. From these ones, four caches related with future events (scheduled to latter dates than the day at which this dataset was collected) were deleted. Two other caches were also deleted due to location issues, performing a total of 884 Geocaches that were validated. These included 36 caches (less than 5% of the total dataset) that were out-side of the city limits, but “located” in the study area by the cache owner. In some cases the distances were within the acceptable GPS error, and in other cases like those ones clearly placed in the Tagus River, the location it’s just a start point and as stated International Archives of the Photogrammetry, Remote Sensing and Spatial Information Sciences,
by Geocaching good practices rules, with the exception of a few cache types, the cache itself should not be too far way of the waypoint.
A second spatial dataset was obtained from the Geographical and Cadastral Information Department of Lisbon Municipality This included thematic layers of the city master plan chosen in order to represent the urban flows and geography of the city. Vector data containing the polygons of Special Protection Areas, City Sites of Public Interest, Green Areas, Parks & Public Gardens and the “Structural City Corridors” were used to perform these spatial analyses. A third dataset was obtained from the webpages of Lisbon TOP15 logged caches, public available at www.geocaching.com, including each cache description and total logs in order to understand what makes a TOP Cache in a urban environment.
3. METHODS
Geocaching activity can be measured in two ways. By numbers of players or caches hidden in a certain territory, or by numbers of logs, founds or not founds either of each cache/geocacher or regarding the total number of caches/geocachers. In the first case, cache densities can be compared from place to place as long as data reports the same period, but like all recreational activities there are no average patterns and it’s difficult to determine reference conditions in a new activity that has register exponentials grows.
3.1 Monitoring Geocaching Activity in Lisbon
Like in many recreational activities, ranks are regularly used in Geocaching. For a Geocacher (like in many web forums) the total number of founds or logs, the maximum founds in a day, or the maximum consequent geocaching days are common measures, proudly stated in their info pages. Following the same principle the total number of founds or logs could be used to define cache’s popularity. But since cache availability, directly depends on the number of days since the cache has been hidden, and if it’s enabled or disabled, one proposes that Cache Logs/Visitation Rate (CLogR/CvR) should provide better clues regarding caches popularity. CvR is the voluntary act of a Geocacher to search for a cache either it found it or not, representing the number of caches visits per day. CLogR follows the same principle regarding the number of Logs.
dHidden Logs = Total Number of Logs F = Cache founds
DNF = Cache do not founds
CdHidden = cache days hidden (days since caches has been placed and enabled until the day that dataset has been collected)
Other methods could be used, like the number of Premium votes or uploaded photos, but these cannot represent average universal preferences. Older caches might have more visits if compared with more recent ones, but newer caches can be searched more often. CvR can also be more easily related with visitation impacts, an important aspect of Geocaching that should be studied in sensitive or protected areas for example. To evaluate the temporal pattern of geocaching in Lisbon, both methods were used and results interpretation is made in relation to both approaches.
3.2 Spatial Analysis
To reveal general preferences regarding where caches in Lisbon are normally placed, spatial analysis was conducted trough a batch of intersections between the Geocaches dataset (waypoints with lat/long coordinates) and each polygon vector data. Afterwards all caches were classified in terms of its location regarding the Lisbon urban flows and geography providing overall insights regarding favourite places for hides.
3.3 Lisbon urban Geocaching top preferences
Caches are not placed in random hiding places but rather are located in places of natural beauty or significance (O'Hara, 2008). Assuming the top logged or visited caches represents the top preferences of Geocachers in Lisbon, each of TOP15 logged caches were analyzed in terms of its placement location and page description following a questionnaire of 15 short questions:
Q1 - Cache placed in a sightseeing spot?
Q2 - Cache placed in a sightseeing spot turned to the Tagus River?
Q3 - Cache placed in a sightseeing spot turned to the city
Q4 - Cache placed near a cultural heritage attraction? Q5 - Cache placed near historical building?
Q6 - Cache placed near monumental building? Q7 - Cache placed near/or within a city square? Q8 - Cache placed near/or within a city park or garden? Q9 - Cache placed near/or within a touristic spot? Q10 - Does the cache description tell any particular
aspect of the place history?
Q11 - Does the cache description tell any particular aspect of the Lisbon history?
Q12 - Are images included in the caches description? (How many?)
Q13 - What is the page description idiom(s)?
Q14 - Does the cache description include links for on-line translation?
Q15 - Does the cache description include any community interaction?
Questions 1 to 11, and 15 where simply answered in terms of YES or NO, number of illustrations and page idiom where counted and registered.
4. RESULTS
4.1 Overall Geocaching Activity
Geocaching activity in Lisbon generally follows the same patterns that were be founded by Santos et al., 2012) in Portugal. After a renitent beginning the popularity of this activity exploded in 2007 as it can be seen in Figure 2. During International Archives of the Photogrammetry, Remote Sensing and Spatial Information Sciences,
this year, 95 new caches have been placed in Lisbon, including 5 of the TOP15 (see section 4.3). With the exception of 2008 and 2009, the number of new hidden caches has continually grown. Total number of Logs, Founds and Founds + Do Not Founds (DNF) keep the same general pattern of hidden caches per Year, with the exception of caches from 2012 where all these 3 indicators have significant lower numbers.
Figure 2. Lisbon Geocaching Activity from 2001 to 2012 regarding the number of caches hidden per year. ∑ of Logs, Founds and Found + Do Not Founds are related to the cache
hidden Year.
In terms of Cache Logs and Visitation Rates, like total cumulative geocaches hidden, both indicators show a significant increase. Generally, caches placed on last years are more often visited what, together with the increasing number of hidden caches might be a real prove of Geocaching growing popularity.
Figure 3. Lisbon Geocaching Activity from 2001 to 2012 regarding the cumulative number of total caches hidden and Enabled caches per year. Cache Logs Rate (CLogR) and Cache
Visitation Rate (CvR) shown represent average values.
4.2 Spatial Analisys of Geocaching in Lisbon
Lacking standards regarding spatial analisys for Geocaching, a proper indicator could be Caches Density, i.e. the number of caches per total area/geocacher/resident. Values higly above the average should represent preferences, in the opposition to
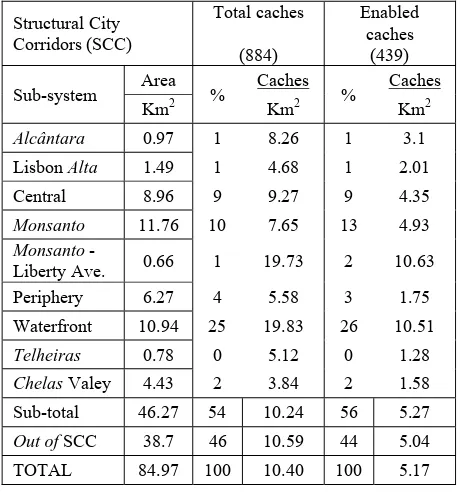
values under average. This evaluation could be done for total caches, as well as for Enabled caches only. For the total 884 hidden caches in Lisbon, average Caches Density (on the date of wich the dataset was collected) was 10.40 Caches/Km2. For the Enabled caches for the same moment this value decreases to 5.16 /Km2, but major patterns regarding higher or lower densities keeps the same, as it can be seen in Table 1 that resumes Caches % and Caches Density regarding the “Structural City Corridors” chart (Figure 4).
Figure 4. Caches locations regarding Lisbon Structural City Corridors. Special emphasis is made to TOP20 caches.
Structural City Corridors (SCC)
Total caches
(884)
Enabled caches
(439)
Sub-system Area % Caches % Caches
Km2 Km2 Km2
Alcântara 0.97 1 8.26 1 3.1
Lisbon Alta 1.49 1 4.68 1 2.01
Central 8.96 9 9.27 9 4.35
Monsanto 11.76 10 7.65 13 4.93
Monsanto -
Liberty Ave. 0.66 1 19.73 2 10.63
Periphery 6.27 4 5.58 3 1.75
Waterfront 10.94 25 19.83 26 10.51
Telheiras 0.78 0 5.12 0 1.28
ChelasValey 4.43 2 3.84 2 1.58
Sub-total 46.27 54 10.24 56 5.27
Out of SCC 38.7 46 10.59 44 5.04
TOTAL 84.97 100 10.40 100 5.17
Table 1. Caches percentages and Caches Density within each Lisbon Structural City Corridors
The Waterfront corridor turned to the Tagus River concentrates the highegest percentage of caches numbers (25% of total hidden caches, 26% of the Enabled ones) and also the highest cahes densities. These is followed by the corridor Monsanto – Liberty Avenue (one of the noble areas of the city) that concentrates only 1% of the total caches, and 2% of the enabled International Archives of the Photogrammetry, Remote Sensing and Spatial Information Sciences,
ones, but still register a cache density above city’s average for both conditions. All the other suctruturall corridors have much lower densities wheen compared to the city’s average, even the biggets city park (Monsanto), that holds all the atractions of Geocaching: out-door space, sightseeings spots and a landscape sorrounded by all the facilities that a urban park deserves. Nevertheless, at least in terms of urban geocaching these characteristics appear not to be enough.
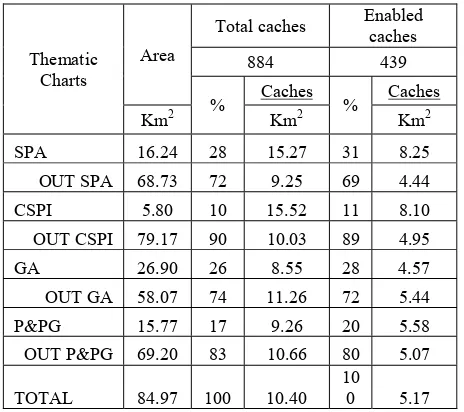
Table 2 resumes the spatial analysis regarding the rest of the thematic layers. These results show that Special Protection Areas and City Sites of Public Interest have higher Caches Densities, even with lower absolute caches numbers regarding the rest of the city. Green Areas and Parks & Public Gardens on the other hand are in line with average. Nevertheless a deeper look regarding some of the layers sub-classes shows that some polygons have huge Caches Densities. Dilution of these trends might be directly dependent to the small areas of these places. A great public park for Geocaching, directly in line with the Tagus River, and close to a Historical monument could be small, not providing enough space for more than one cache. In these cases, different indicators such as CLogR, or CvR might provide better measures in terms of popularity regarding caches hides and goecachers main choices.
Thematic Charts
Area
Total caches Enabled caches
Table 2. Total Area, Caches numbers and densities of each Lisbon thematic charts used in the spatial dataset analyses. SPA = Special Protection Areas; CSPI = City Sites of Public Interest;
GA = Green Areas; P&PG = Parks & Public Gardens.
4.3 Lisbon Top Geocaches
Table 3 shows TOP20 Lisbon Geocaches and results on the evaluation of their questionnaires are presented in Table 4. As an overall evaluation, top logged caches are mainly located in places where the urban landscape is in general well appreciated and a city tour to these places could provide the visitor with a good representation of the city. Half of these caches are in direct view of the Tagus River, and with the exception of 2 cases all TOP20 are within the city cultural heritage areas, mixing old quartiers and monuments with the modern city. Most of these caches are hidden in open urban areas and reading their webpages could provide an insight of the place or city history.
Community interaction is low if compared to other caches hidden in Protected Areas for example, with small average logs size (measured in term of bytes per log).
Geocache
Table 3. TOP15 Lisbon caches.
Q Y N Q Y N
Table 4. TOP15 Lisbon Caches Questionnaires Results.
Most of the caches webpages is presented in both Portuguese and English and in 3 cases, on-line translators are provided with a single click for other languages.
5. DISCUSSION
Geocaching is a complex activity, with huge numbers of objects, players and stated interactions (logs, founds, do not founds, uploaded photos, etc.) what makes it difficult to be studied and monitored. Special attention should be dedicated to the cache status. Regarding the analysed dataset 50% of all Lisbon caches where Enable (caches that are hidden and available to be found and logged by geocacahers), 7% where Disabled (temporary unavailable due to maintenance or other reason) and 43% where Archived (meaning that it were not hidden any more – the entire cache information is still available to register members, but it cannot be logged again). This makes caches densities variable on a daily basis despite the linear growing rates. This particular aspect requires different attitudes in terms of geographical and temporal analysis. Nevertheless, International Archives of the Photogrammetry, Remote Sensing and Spatial Information Sciences,
the entire activity of Geocaching in Lisbon, or any other place in the world, cannot be referred to the active caches alone. As expected Geocaching activity depends on caches availability, but Enabled caches provide a sub-evaluation of this activity (from the TOP15 Lisbon caches, rank 10 was archived and rans 11 was Disable). Lacking comparative studies, questions might be raised regarding carrying capacity in terms of urban Geocaching. Densities of 5 or even 10 caches/Km2 for urban spaces seam low, but recreational activities saturation depends both on practiser’s will as well as physical space. As shown in this study, favourite places to hide geocaches within Lisbon require minimum conditions: open spaces with nice sightseeing spots and cultural heritage. But as strange as it can seam, there’s a cache inside the biggest city shopping mall (within the TOP100), proving that it´s difficult to predict or modulate this activity.
6. CONCLUSIONS
Results of this study provide the first insights regarding Geocaching in urban areas. Due to the absence of “rural/natural” environments, geocaching in cities tends to be slightly different from backcountry areas, leading to some adaptations. Monumental and historical buildings might replace natural monuments and History might replace natural sciences, but landscape, open views, and curiosity are still required to create a good cache. Due to its global numbers, geocaching is a source of social data that can be use to understand not just this activity it self, but also the perception that geocachers (a particular public that grows at the same rates of new caches) have of the places where caches are hidden. Besides the short questionnaire used in this study, new issues can be assessed from the descriptions provided by the cache owners. TOP15 Lisbon caches represent a small sample of the city caches, but the image they reveal to national or international tourists is an interesting perspective of the city. Assumptions that the total caches of Lisbon, or any other place, might provide a good point of view of the surrounding environments can be done, but, requires a different approach. Nevertheless, the proposed methodology can point to preliminary results with short efforts, making dedicated sampling designs easier. Other important aspect, which deserves deeper study, is the constant feedback provide by the entire Geocaching community (293.511 logs for this dataset). Top caches might provide preliminary clues on average preferences, but the entire logs of each cache is a complete data source of perceptions and motivations that can be explored for many uses. Geocachers are people that keep saying: “I have been there!” Discovering why and when is a good subject for many social and natural sciences, and could provide new examples on how to communicate with large and dedicated audiences.
7. REFERENCES
Bragg, L.A., Pullen, Y., Skinner, M., 2011. Geocaching: a worldwide treasure hunt enhancing the mathematics classroom. MAV 2010: Proceedings of the 47th Annual Conference of the Mathematical Association of Victoria, pp. 54–62.
Hawley, F.F., 2010. Agon and Ecstasy: Transgression, Transformation, and Transcendence in Competitive Geocaching. Deviant Behavior, 31(3), pp. 225–250.
Hooper, C.J., Rettberg, J.W., 2011. Experiences with Geographical Collaborative Systems: Playfulness in Geosocial Networks and Geocaching. In MobileHCI 2011. p. 4.
Ihamäki, P., 2007. Geocaching at the Institute of Paasikivi–New Ways of Teaching GPS Technology & Basics of Orientation In Local Geography. ICTA’07, Hammamet, Tunisia, pp.156-158.
Lewis, G.B., 2013. Earth caching – Earth science geocaching. GeoSciEdV Bayreuth 2006, pp.1–1.
Lewis, G.B., McLelland, C.V., 2007. EarthCaching: An Educator's Guide, The Geological Society of America.
Matherson, L., Wright, H., Inman, C., Wilson, E., 2008. Get Up, Get Out with Geocaching: Engaging Technology for the Social Studies Classroom. Social Studies Research and Practice, 3(3), pp. 80-85.
Autonomous Geocaching: Navigation and Goal Finding in Outdoor Domains, J. Neufeld, J. Roberts, S. Walsh, A. Milstein, M. Sokolsky, M. Bowling, Proc. of 7th Int. Conf. on Autonomous Agents and Multiagent Systems (AAMAS 2008), Padgham, Parkes, Müller and Parsons (eds.), May, 12-16., 2008, Estoril, Portugal, pp. 47-54.
Neustaedter, C., Tang, A., Judge, T.K., Creating scalable location-based games: lessons from Geocaching. Personal and Ubiquitous Computing, 17, pp.335–349.
O'Hara, K., 2008. Understanding geocaching practices and
motivations. CHI, pp.1177–1186. http://portal.acm.org/citation.cfm?doid=1357054.1357239.
Santos, T., Nogueira Mendes, R., Rodrigues, A.M., Freire, S., 2012 Treasure Hunting in the 21st century: A Decade of Geocaching in Portugal. In T. Nagle, ed. 6th European Conference on Information Management and Evaluation, Cork, Irland. pp. 273–281.
Vítek, O., 2013. Let’s Count with geocaching. In P. Fredman et al., eds. 6th International Conference on Monitoring and Management of Visitors in Recreational and Protected Areas. Stockholm, Sweden. pp. 228–229.
Weber, K., Haug, S., 2012. Geocaching und Raumnutzung. Freizeitbeschäftigung mit Konfliktpotenzial. STANDORT:
Zeitschrift für Angewandte Geographie, 36(1), pp.17–24.
Zeng, M., 2011. Examining Geocaching Practices through a Mobilities Lens. Proceedings of the Media Ecology Association, 12, pp.113–122.
8. ACKNOWLEDGEMENTS
This paper presents research results of the Strategic Project of e-GEO (PEst-OE/SADG/UIo161/2011) Research Centre for Geography and Regional Planning funded by the Portuguese State Budget through the Fundação para a Ciência e Tecnologia. The authors would like to thank Lisbon City Hall for the opportunity of using the master plan´s spatial data set. International Archives of the Photogrammetry, Remote Sensing and Spatial Information Sciences,