isprs annals III 7 235 2016
Teks penuh
Gambar


Garis besar
Dokumen terkait
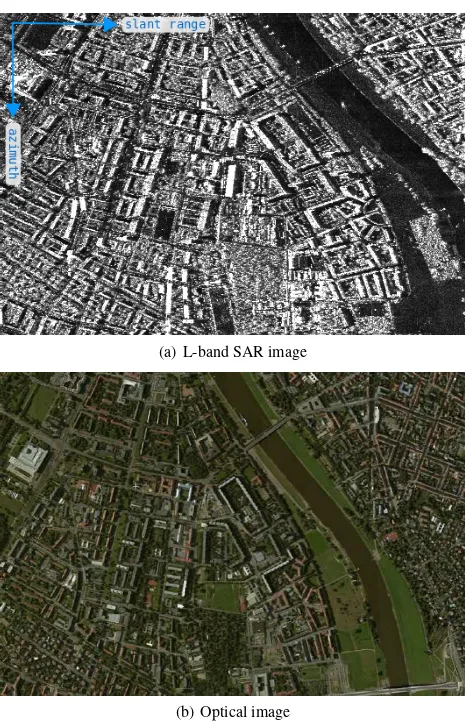
We then generated PDFs of the scatterings derived from data observed using concrete blocks with different orientation an- gles, and from an ALOS/PALSAR image. Analysis of the PDFs
This paper presents a new decomposition scheme, which models the measured matrix after polarimetric orientation angle (POA) compensation as a linear sum of
BUILDING CHANGE DETECTION IN VERY HIGH RESOLUTION SATELLITE STEREO IMAGE TIME SERIESJ. Photogrammetry and Image Analysis, Remote Sensing Technology Institute, German Aerospace
However, the sparse representation-based approach only needs inclination information for building the dictionary and not for spectral reconstruction of the plant image of
The experimental results on the synthetic image data: (a) the original image with red border lines of clipped images with a 20% overlap between two adjacent ones; (b) the
To make the prediction sensitive to inter- actions, we propose a new covariance function, which takes a pair of motion trajectories as input and computes a measure of simi- larity
Thus we can employ the pro- posed P-Linkage clustering method on the segmentation of point clouds, which differs from that on the 2D data points in three as- pects: (1) the
Their experimental alternatives can be calculated from the SAR intensity imagery directly, then the parameters of the mixture model are estimated through fitting the
