SAR IMAGE SEGMENTATION WITH UNKNOWN NUMBER OF CLASSES COMBINED
VORONOI TESSELLATION AND RJMCMC ALGORITHM
Q. H. Zhao*, Y. Li, Y. Wang
Institute for Remote Sensing Science and Application, School of Geomatics, Liaoning Technical University, Fuxin, Liaoning 123000,
China – (wangyu, liyu, zhaoquanhua)@lntu.edu.cn
Commission VII, WG VII /4
KEY WORDS: SAR, segmentation, Bayesian paradigm, unknown number of classes, Voronoi tessellation, RJMCMC
ABSTRACT:
This paper presents a novel segmentation method for automatically determining the number of classes in Synthetic Aperture Radar (SAR) images by combining Voronoi tessellation and Reversible Jump Markov Chain Monte Carlo (RJMCMC) strategy. Instead of giving the number of classes a priori, it is considered as a random variable and subject to a Poisson distribution. Based on Voronoi tessellation, the image is divided into homogeneous polygons. By Bayesian paradigm, a posterior distribution which characterizes the segmentation and model parameters conditional on a given SAR image can be obtained up to a normalizing constant; Then, a Revisable Jump Markov Chain Monte Carlo(RJMCMC) algorithm involving six move types is designed to simulate the posterior distribution, the move types including: splitting or merging real classes, updating parameter vector, updating label field, moving positions of generating points, birth or death of generating points and birth or death of an empty class. Experimental results with real and simulated SAR images demonstrate that the proposed method can determine the number of classes automatically and segment homogeneous regions well.
1. INTRODUCTION
In interpreting and understanding field of Synthetic Aperture Radar (SAR) image, image segmentation plays a very important role(Ma, 2011). Image segmentation involves two tasks: determining the number of classes and segmenting homogeneous regions. Most of image segmentation algorithms mainly segment the homogeneous regions based on a giving number of classes a priori (Ayed,2005; Touzi,1988; Won,1992; Jain,1992). In general, these algorithms can be categorized into threshold methods (Alkasassbeh, 2012), clustering methods (Pham, 2001; Zhang, 2008), statistic based methods (Cao,205; Schmitt, 2014) and so on. Statistical based algorithms applied broadly in SAR image segmentation because they can depicts and model images with speckle noise well.
Li, 2010 proposed an image segmentation algorithm based on Voronoi tessellation and RJMCMC strategy. Although the proposed approach can segment SAR intensity images well, it couldn’t determine the number for classes automatically. The issue is extremely important for remote sensing data processing since the ground truth is not always known a prior. Wang, 2015 adopts regular tessellation and RJMCMC to segment high resolution SAR images with unknown number of classes, it can determine the right number of classes automatically, but because it adopt regular tessellation technique, the edges of different regions are always ambiguous, thus after segmentation, the post-processing must be done to obtain the accurate boundaries.
In order to determine the number of classes automatically and segment homogeneous regions accurately simultaneously, the paper presents a segmentation algorithm combining Voronoi tessellation and RJMCMC strategy. First of all, the number of classes is considered as a random variable and subject to a Poisson distribution, following the Bayesian paradigm, the posterior distribution is obtained. Then, a
RJMCMC algorithm is designed to simulate from the posterior distribution to determine the number of homogeneous regions and to segment the image simultaneously. In this paper, the emphasis focuses on the designing of RJMCMC scheme. The moves in the designed RJMCMC scheme include splitting or merging real classes, updating parameter vector, updating label field, moving position of generating points, birth or death of generating points and birth or death of an empty class. These moves overcome the instability problem of segmentation optimization effectively and determine the number of classes precisely.
2. DESCRIPTION OF THE PROPOSED ALGORITHM
2.1 Image Segmentation Model
Let Y = {Yi, i =1, …, N } be a SAR intensity image in an
image domain D, where i is pixel index arranged on D, N is the number of sampling points (pixels), Yi is the random variable
sample of Y representing i.
In this paper, D = {Pj, j = 1, …, J} is partitioned into J
Voronoi polygons by using Voronoi tessellation, where J is considered as a random variable following a Poisson distribution with the probability density function (pdf) p(J) (Li,2010). Given a set of generating points G = {vjD, j =
1, …, J}, vj is composed of the points nearest to vj than to other
generating points in G, and vjis associated with jth Voronoi
polygon Pj.
Let C = {Cj, j = 1, …, J} be the label random field, where Cj
{1, …, L}is Pjs label random variable and the pixels in Pj
extending stationary Potts model into neighbour Voronoi
where constant can control the neighborhood dependences between a pair of neighbor polygons. (Cj, Cj) = 1, if Cj Cj,
otherwise (Cj, Cj) = 0; NPj ={ Pj, Pj Pj} be the set of Pj’s
neighbor polygons, j {1, …, J}, j {1, …, J} and j j, Pj
Pjare neighbors if and only if they have a mutual boundary.
It can be seen that the segmentation of Y can be fully determined by the label field C.
LetYiY satisfy independent Gamma distribution conditional
on its label and the correspondingparameter vector for Gamma
distribution = {, = 1, …, L} = (, ) ={1,
,L,1, , L}, where the shape and scale parameters
are assumed to satisfy identical and independent Gaussian distributions with mean and , standard deviations and
on D, and assume that all the generating points are independently drawn from S and the joint pdf p(G | J)of G can
The number of classes L is subjected to a Poisson distribution with mean L(Green, 1995) and truncated to L
{Lmin, …, Lmax}, Lmin (Lmax)is the allowed minimum (maximum)
number of classes. Its prior distribution can be expressed as
) Using Bayesian paradigm (Dryden, 2003), the posterior
distribution of C, , G, L and J onY can be defined according to prior probabilities and image model defined in Eq.(1)-(4) as
)
2.2 Simulation
In order to segment an SAR intensity image, it is necessary to simulate from the posterior distribution in Eq. (5) and to estimate its parameters. Let = (C, , G, L, J).be parameter vectors. It is worthy to note that when m is variable the dimension of parameter vector is varied. In this paper, a useful tool to simulate from the posterior distribution defined in Eq. (5) is the RJMCMC algorithm(Green, 1995). In each iteration, a new candidate * in a higher dimension for is algorithm, it is not necessary for all L classes to be used to label Voronoi polygons. The classes that are used to label the Voronoi polygons are called real classes and others empty classes, denoted as Lr and Le, respectively. The move types are
designed as follow.
2.2.1 Splitting or Merging Real Classes: The Splitting or merging moves are designed in tandem (Green, 1995). Given the current number of classes L, Let = (C, , G, L, J), fL or
mL+1 is the probabilities of proposing a split or merge operation,
we consider fL = 1- mL+1 = 0.5. A splitting involves
randomly selecting a real class in the current real classes collection which has a set of Voronoi polygons; then a new empty class L+1 is proposed and the corresponding parameter vector L+1 is sampled from the prior distribution; The class of
each Voronoi polygon of selected class changed to L+1 with probability of 0.5. So *= (C*, *, G, L+1, J), where * = {*, = 1, …, L, L+1}. It is evident that the splitting move does not affect G and m. The acceptance probability of the splitting move can be written as
the number of Voronoi polygons with label l. Let * = (, u), and u = {k+1, k+1}. As and u are conditional independent,
p(*) = p()q(u), consequently the Jacobian term in Eq. (6) is equal to 1.
A merging involves selecting two real classes and then merge the corresponding two classes into one selected class from the two randomly, the unwanted class is killed off, and the number of class decreases to L-1. The acceptance probability of the merge move can be generalized as
r
2.2.2 Updating Parameter Vector: The parameter vector = {, = 1, …, L}is updated sequentially and change to . If is a real class, the acceptance probability of updating can be written as
If is an empty class, the acceptance probability can be simplified as
2.2.3 Updating Label Field: To update the label, select a Voronoi polygon randomly from J polygons, say Pj, proposing
a new real label Cj* ≠Cj in the current real classes collection.
2.2.4 Moving Position of Generating Point: For a generating point vj, the new generating point vj
*
is uniformly sampled from its corresponding polygon Pj. vj
*
}. The acceptance probability of the operation can be expressed as
2.2.5 Birth or Death of Generating Points: Birth of generating point involves increasing the number of generating points by one, the new generating point vJ+1 is sampled from D
uniformly. Let the polygon induced by generating point vJ+1 be
PJ+1 and its label J+1 is uniformly drawn from {1, ..., Lr}. The
probability turns out to be
gpGiven the current number of Voronoi polygons J,
1
birth (death) operation, and the Jacobian term in Eq. (15) is equal to 1.
2.2.6 Birth or Death of Empty Class: Given the current number of classes is L, let the probabilities of proposing a birth or death of empty class move be bL and dL+1, respectively. A
birth move involves proposing a new empty class L +1 and a proposed set L+1* = (L+1*, L+1*) sampled from the identical
and independent prior distribution. It is evident that the birth move does not affect the number of the Voronoi polygons J and the set of generating points G, let *= (C*,*, G, L+1, J), where *
= {, = 1, …, L, L +1}. The acceptance probability for a birth move can be obtained by Eq. (6), that is,
term in Eq. (17) is equal to 1.
As death of empty class is designed in tandem with birth of empty class (Green, 1995), the acceptance probability can be expressed as
e
e b
d
R
A
(
,
*)
min
1
,
1
/
(18)3. EXPERIMENTAL RESULTS AND DISCUSSION
In this section we present experimental results to illustrate the feasibility and effectiveness of the proposed approach.
3.1 Simulated SAR Image
Figure1 shows a simulated SAR image, where Figure1 (a) is an image template for simulation, Figure 1(b) is simulated based on template of Figure 1(a). Table 1 lists the values of and for simulation in different homogeneous regions which are indicated by I-V in Figure 1(a).
Region
I 11.6453 10.774
II 8.1005 28.6417
III 4.2078 13.9025
IV 1.1297 61.5406
V 3.8019 6.0523
Table 1. Parameters of GAMMA distribution
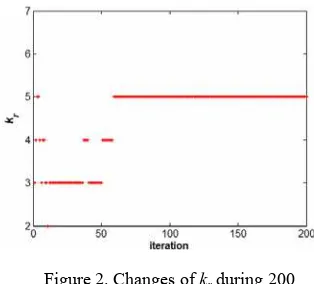
Figure 2 shows the changes of kr before 200 iterations.
Experiment results demonstrate that (1) before kr attains to its
stable value, it jumps among [2, kmax]. It can be seen from
figure 2 that kr attains to its stable value after about 60
iterations, for the simulated image, kr’s stable value is 5; (2)
during the jumping steps, no class remains unchanged with 15 consecutive iterations. Hence, during 30 consecutive iterations, if kr remains unchanged, it is thought to be the number of the
real class.
Figure 3 shows visual evaluation of the segmentation result of simulated SAR image shown in Figure 1(a). Figure 3(a)-(b) present the Voronoi tessellation and the corresponding segmentation result, respectively. To qualitatively evaluate the proposed approach, the outlines are extracted and overlaid on the original image, see Figure 3(c). Visually, the outlines match the edges of homogeneous regions well. From Figure 2 and 3, it can be found that the proposed approach can not only determine the number of classes but also segment homogeneous regions precisely.
In Table 2, we list some computed common precision measures to quantitatively assess the accuracy of the segmentation result shown in Figure 3(b). From Table 2, it can be seen that all the accuracies indexes are at least 99.3%. The Kappa coefficient is up to 0.997. It can be illustrate that the proposed approach is feasible and effective.
Class I II III IV V
Producer’s accuracy (%)
I 337
3 0 0 0 1 100
II 0 331
0 0 0 0 100
III 5 0 3311 0 5 99.7
IV 0 2 0 337
1 16 99.5
V 1 3 3 5 297
8 99.6
User’s accuracy (%)
99.8 99.9 99.9 99.9 99.3
Kappa
coefficient 0.997 Overall accuracy (%) 99.8 Table 2. Confusion matrix, statistical measures and kappa
coefficient for simulated SAR images. Figure 3. Visual evaluation of simulated SAR images, (a) Voronoi tessellation and (b) segmentation results (c) overlaying the extracted outlines on the original images.
(a) (b) (c)
Figure 1. Simulated images, (a) template for simulation, (b) simulated image.
(a)
III
II
I
IV
V
(b)
3.2 Real SAR Image
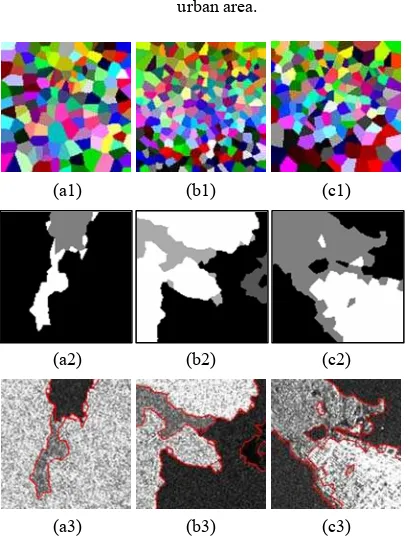
To demonstrate the efficiency of the proposed approach further, experiment on real SAR images are carried out. Three real SAR images of RADARSAT-I/II with sizes of 128128 shown in Figure 4 are tested. Figure 5 shows the corresponding visual evaluation, whereFigure 5(a1)-(c1) and Figure 5(a2)-(c2) show the Voronoi tessellations of image domain, the segmentation results, respectively. The extracted outlines are overlaid on the original images, see Figure 5(a3)-(c3). From Figure 5, it can be seen that the proposed approach can not only determine the number of classes of real SAR images, but also segment the homogenous regions precisely. So it can be demonstrate that the proposed approach is suitable to the real SAR images segmentation.
4. CONCLUSION
This paper presents a region-based approach of SAR image segmentation, which combines Voronoi tessellation and RJMCMC scheme. This proposed approach can not only determine the number of homogeneous regions but also segment them accurately. In order to determine the correct number of class, the proposed approach design 6 operations which are time-consuming, in the further work, parallel
algorithm should be studies to accelerate the proposed approach based image segmentation.
ACKNOWLEDGMENTS
This work was supported by Center for Earth Observation and
Digital Earth (No.2012LDE013) and National Natural Science
Foundation of China (No. 41271435; No. 41301479).
REFERENCES
Alkasassbeh, M., Braik, M. and Ayyash, H. A., 2012. Detection of oil spills in SAR images using threshold segmentation algorithms. Int. Joural Comput. Appl., 57(7):10–15.
Ayed, I. B., Mitiche, A. and Belhadj, Z., 2005. Multiregion level-set partitioning of synthetic aperture radar images. IEEE Trans. Pattern Anal. Mach. Intell.,27(5):793–800.
Besag, J., 1986. On the statistical analysis of dirty pictures. J. R. Stat. Soc. B ( Methodol ), 48(3):259–302.
Cao, Y. F., Sun, H., and Xu, X.,2005. An unsupervised segmentation method based on MPM for SAR images. IEEE Geosci. Remote Sens. Lett., 1:55–58.
Dryden, I. L., Scarr, M. R. and Taylor, C. C., 2003. Bayesian texture segmentation of weed and crop images using Reversible Jump Markov Chain Monte Carlo methods. J. R. Stat. Soc. C.,52(1):31–50.
Green, P. J., 1995. Reversible Jump Markov Chain Monte Carlo computation and Bayesian model determination. Biometrika, 82(4):711–732.
Jain, A. K. and Bhattacharjee, S., 1992.Text segmentation using gabor filters for automatic document processing. Mach. Vision Appl., 5(3):169-184.
Li, Y., Li, J., and Chapman, M.A.,2010. Segmentation of SAR intensity imagery with a Voronoi tessellation, Bayesian inference, and Reversible Jump MCMC algorithm. IEEE Trans. Geosci. Remote Sens., 48(4):1872–1881.
Ma, M., Liang, J. H., Guo, M., Fan, Y. and Yin, Y. L., 2011 SAR image segmentation based on artificial bee colony algorithm. Appl. Soft Comput., 11(8):5205–5214.
Pham, D. L.,2001. Spatial models for fuzzy clustering. Comput. Vis. Image Und., 84(2):285-297.
Schmitt, A., Wessel, B. and Roth, A., 2014. An innovative curvelet-only-based approach for automated change detection in multi-temporal SAR imagery. Remote Sens., 6(3):2435–2462.
Strauss, D. J., 1975. A model for clustering. Biometrika, 62(2),467–475.
Touzi, R., Lopes, A. and Bousquet, P.,1988. A statistical and geometrical edge detector for SAR images. IEEE Trans. Geosci. Remote Sens.,26(6): 764–773.
Wang, Y., Li,Y.,Zhao.Q.H.,2015. Segmentation of high (a1)
Figure 5. Visual evaluation of real SAR images, (a1)-(c1) Voronoi tessellations, (a2)-(c2) segmentation results, and (a3)-(c3) overlaying the extracted outlines on the original images.
(b1) (c1)
(a2) (b2) (c2)
(a3) (b3) (c3)
Figure 4. Real SAR images, (a) - (b) sea ice and (c) urban area.
resolution SAR image with unknown number of classes based on regular tessellation and RJMCMC algorithm. International J. Remote Sens., 36(5): 1290-1306.
Won, C. S. and Derin, H.,1992. Unsupervised segmentation of noisy and textured image using Markov random fields. Graphi. Models Image Process.,54(3): 165-178.
Yang, Y., Sun, H. and He, C.,2006. Supervised SAR image MPM segmentation based on region-based hierarchical model. IEEE Geosci. Remote Sens. Lett., 3(4): 517–521.