SPECTRAL CHARACTERISTICS OF SELECTED HERMATYPIC CORALS
FROM GULF OF KACHCHH, INDIA
Nandini Ray Chaudhury
EHD/ABHG/EPSA, Space Applications Centre, ISRO, Ahmedabad – 380015 –
[email protected]
Commission VIII, WG VIII/6
KEY WORDS: Ecosystem, Hyper spectral, Multispectral, Image, Identification
ABSTRACT:
Hermatypic, scleractinian corals are the most important benthic substrates in a coral reef ecosystem. The existing, high (spatial) resolution, broad-band, multi-spectral, space-borne sensors have limited capability to spatially detect and spectrally discriminate coral substrates. In situ hyperspectral signatures of eight coral targets were collected with the help of Analytical Spectral Devices FieldSpec spectroradiometer from Paga and Laku Point reefs of Gulf of Kachchh, India to study the spectral behaviour of corals. The eight coral targets consisted of seven live corals representing four distinct colony morphologies and one bleached coral target. The coral spectra were studied over a continuous range of 350 to 1350 nm. The corals strongly reflected in the NIR and MIR regions with regional central maximas located at 820 and 1070 nm respectively. In the visible region the live coral spectra conformed to “brown mode” of coral reflectance with triple-peaked pattern at 575, 600 and 650 nm. All coral spectra are characterized with two distinct absorption features: chlorophyll absorption at 675 nm and water absorption at 975 nm. The live and the bleached corals get distinguished in the visible region over 400 to 600 nm region. Water column over the targets modifies the spectral shape and magnitude. First and second-order derivatives help in identifying spectral windows to distinguish live and bleached corals.
1. INTRODUCTION
Worldwide, hermatypic or reef-building corals occupy a keystone position in the overall functioning of reef ecosystem. Live coral cover of a reef habitat is one of the most widely accepted parameters of coral reef health (Green et al. 2000). Space-borne, optical remote sensing has sensor limitations in automated extraction of live coral cover parameter from space data. Digital delineation of this parameter has so far mostly used the expert knowledge of local reef systems in terms of specific geomorphological features and associated benthic classes (Hochberg and Atkinson, 2003). The existing, medium to high resolution, broadband, multi-spectral sensors have limited capabilities to provide synoptic data on live coral cover at community level. Poor penetration of sunlight and low signal to noise ratio of backscattered reflectance from deeper reef habitats are considered to be the major limiting factors to the performance of these sensors (Green et al. 2000). Therefore, live coral cover assessment through space-based imaging has been successfully confined to emergent, shallow, reef flat environments preferably at low tides. Relative abundance of reef biota and litho-substrates at different bathymetric depths with varying water column (i.e. depth, quality, etc.) add high degree of natural variability to coral reefs as optically complex, shallow water, remote sensing targets. This poses significant challenge in remote assessment of reef-scale biodiversity in terms of spatial detection and spectral characterization of individual corals at colony scale.
As an underwater remote sensing target, coral reefs appear as mosaics of diverse “substrates” or “bottom types” when viewed from the space (Hochberg et al. 2003). Spectral nature of the
space-borne data has been recognized as the basic link between coral reef substrates and remotely sensed images (Hochberg and Atkinson, 2003). Substrate detection and quantification efforts have applied a deterministic, in situ data based, “reef-up” approach which often use proximal remote sensing of corals and other reef benthos. This approach calls for spectral cataloguing to identify distinct spectral features of a substrate. In situ reef-up approach has demonstrated the potential applications of field spectroscopy and hyperspectral analyses to characterize the reflectance properties of individual reef substrates which usually comprise an image (Goodman and Ustin, 2002). In situ
hyperspectral signatures of corals and other reef benthos obtained with the help of portable field spectroradiometers have mostly been used for spectral discrimination of reef substrates (Hochberg and Atkinson, 2000, Hochberg et al. 2003, Hochberg and Atkinson, 2003, Kutser et al. 2003) and for health of corals (Holden and LeDrew, 1998; 1999; Clark et al. 2000). In situ reef spectra have been also used as input to simulate top-of-atmosphere spectral reflectance using radiative transfer models (Lubin et al. 2001).
In situ spectral reflectance of corals per se has been recognized as a fundamental parameter in coral reef remote sensing (Hochberg et al. 2004). Spectral characteristics of coral organisms at colony or at community level have been correlated primarily with coral pigments, fluorescence and colony morphology (Hedley and Mumby, 2002; Hochberg et al., 2004; Joyce and Phinn, 2002 and 2003).
data usually show spectral mixing of corals and other reef substrates like benthic algae, reef-sand, etc. Therefore, it becomes necessary to understand the spectral behaviour of corals in situ to comprehend space-borne sensor-level signal of corals from a reef.
In situ spectral behaviour of Indian corals per se, in visible, near- and mid-infra-red (NIR and MIR) regions of the spectrum was so far unknown. This study attempts to characterize seven, live (belonging to seven genera and four distinctive colony morphologies) and one bleached hermatypic corals from Gulf of Kachchh, India with in situ hyperspectral data over a continuous spectral range of 350 to 1350 nm.
2. STUDY AREA
Indian coast is endowed with spatially limited but strategically located coral reef habitats which offer a myriad of marine biodiversity combined with unique regional characteristics. In India, major coral reefs occur in four distinct locations. Two of them occur in gulf settings: Gulf of Kachchh in Arabian Sea and Gulf of Mannar in Bay of Bengal while the other two are off-shore island groups of Lakshadweep in Arabian Sea and Andaman and Nicobar in Bay of Bengal. Indian coral reefs share sixty genera of hermatypic, scleractinian corals out of the one hundred and eleven genera reported in the world (Venkataraman, 2003). Thus, Indian corals share 54% of global coral diversity at genera level.
The southern part of Gulf of Kachchh from Gujarat coast represents the sturdiest scleractinian coral species of India. Occurring in the northernmost limits of Indian reef regions (22°20’ to 22°40’ north latitudes and 68°30’ to 70°40’ east longitudes), these corals grow in a highly turbid and saline, macro-tidal environment marked with semi-diurnal desiccations due to fluctuating tidal exposures (Navalgund et al. 2010). Out of the sixty genera of scleractinian corals reported from India, only twenty genera are found in Gulf of Kachchh (Venkataraman, 2003) reef region which is declared and protected as a Marine Sanctuary since 1983.
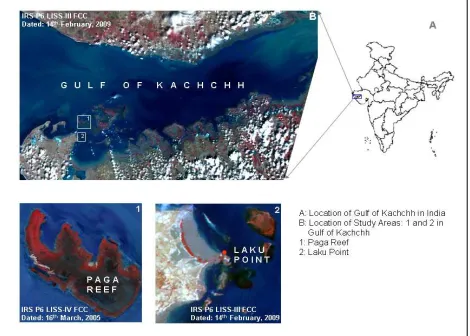
Figure 1. Location of the study sites
Paga reef and Laku Point (near Poshitra) were chosen as two specific sites (Figure 1) for collection of in situ coral spectra from Gulf of Kachchh. These sites had been reported to have relatively
high generic diversity of scleractinian corals within the region (Patel, 1978). Moreover the yearly, equinoctial spring tides (negative low tides) result in maximum exposure of inter-tidal and sub-tidal areas of these reefs facilitating in situ coral spectra collection with virtually no water column. Paga is an off-shore, patch reef where diverse coral colonies occur mostly in the reef slope, reef crest and outer reef flat areas while Laku point is a narrow fringing reef where coral colonies grow in shallow, rock-pools.
3. MATERIAL & METHODS
3.1 Multi-spectral Signatures of Reef Substrates from
Resourcesat-1 LISS-IV Data
Linear Imaging and Self Scanning sensor: LISS-IV, onboard Resourcesat-1 (IRS-P6) and 2 (RS2) satellites have been the most preferred imaging sensor for Indian coral reefs for its high spatial resolution (5.8 m at nadir) complemented with three spectral channels (located in Green, Red and NIR regions) and 10 bit level of quantization. LISS-IV in multi-spectral mode has performed considerably well to characterize reef geomorphology of the smaller reefs of Central Indian Ocean (Navalgund et al. 2010). However, at an orbital altitude of 817 km, detection capability of this sensor gets spatially limited for coral colonies within a reef. Three discrete, broad-band, spectral channels, positioned at 530 to 590 nm, 620 to 680 nm and 770 to 860 nm usually fall short to spectrally resolve a “pure coral signature”. Cohabitation of macro reef-benthos like corals and macro-algae along with underlying litho-substrates (sand, mud, etc.) under varying depths of water column make this task all the more difficult. Atmospheric interferences also alter the strength of the back-scattered signal through atmospheric absorption and scattering. The back-scattered signal from a reef for a single pixel can thus be a mixed representation of the natural heterogeneity present in the corresponding reef area. This problem has been demonstrated with the help of Figures 2 and 3 as a case study using a subset of an archived IRS- P6 LISSIVMX (multi-spectral) data acquired on 16th March, 2005 pertaining to Paga reef. The spectral behaviour of selected reef substrates have been analysed with respect to Top of the earth’s Atmosphere (TOA) spectral radiance. No atmospheric correction has been performed on this subset image for this study.
Figure 2. Appearance of reef substrates on LISS-IVMX FCC and on field
The effect of water column in suppressing the magnitude of sandy substrates from reef is visible in Figure 3 if one compares the values of mean spectral radiance in all the three channels represented by grey and cyan triangles. Benthic green (chlorophyceae) and brown (phyaophyceae) macroalgae groups can be differentiated in terms of pixels appearing in orange and brown colours respectively. Spectrally, chlorophyceae group dominates the phyaophyceae in all the three channels as shown in Figure 3. The magnitude of difference in their spectral response is minimal in the red band (spectral channel 2, 620-680 nm) while in the green band (spectral channel 1, 530-590 nm) there is a slight increase in this difference. In NIR (spectral channel 3, 770-860 nm) this difference magnifies drastically which is well evident in Figure 3.
The fifth pixel group represents mixed pixels (appearing in different tones in the FCC) randomly selected from the ‘outer reef flat’ zone of Paga (Figure 2). This zone is naturally characterized by diverse benthic and litho-substrates including live coral colonies. The natural diversity allows this zone to appear as a ‘rough textured’ zone adjacent to ‘smooth textured’ chlorophyceae dominated areas. Interestingly, the position of mean spectral radiance of this mixed pixels lie very close to the centre of the vertical distance representing the magnitude difference in spectral response of sand on reef and benthic brown algae categories in green and red bands (red filled triangles vis-à-vis cyan and light green triangles). In NIR, sand on reef category is replaced by chlorophyceae representing the upper limit of this vertical distance as reef sand shows relatively less spectral response due to water column absorption.
Thus, in NIR the mean spectral radiance of mixed pixels lie within the vertical range defined by chlorophyceae and phyaophyceae. So it can be inferred that sand on reef and benthic macro-alga contribute to the backscattered signal of these mixed pixels. This fact is confirmed if one numerically calculates the spectral radiance of mixed pixels assuming that sand on reef and phyaophyceae contributes in equal proportion to a mixed pixel signal in green and red bands while chlorophyceae and phyaophyceae in NIR. This is demonstrated in figure 3 by the red outline triangles against the red filled/solid triangles. This reaffirms the fact, that even in high (spatial) resolution, broad-band, multi-spectral images, pixel-based spectral signature of coral colonies is dominated and obscured by other reef substrates.
Figure 3. Multi-spectral signatures of selected substrates of Paga reef (TOA spectral radiance values observed from IRS-P6 LISSIVMX data acquired on 16th March, 2005)
Hence there is a definite need to explore the hyperspectral domain in remote sensing to understand the spectral behaviour of coral colonies at all possible scales and modes of acquisition: in situ, air-borne and space-borne.
3.2. In situ Spectral Measurements and Data Processing
In situ coral spectra were collected during the equinoctial spring tide (i.e. maximum negative tide = -0.09 m) of March, 2011 when low tide exposures of reefs coincided with early hours of local day time (i.e. 09:00 to 11:00 hrs) suitable for passive, proximal sensing of coral colonies with no or minimal water column. Coral reflectance spectra were collected with Analytical Spectral Devices (ASD) Fieldspec3 spectroradiometer having a spectral range of 350 to 2500 nm and spectral resolution of 3 nm (at 700 nm) and 10 nm (at 1400, 2100 nm). The sampling interval is 1.4 nm for 350-1000 nm wavelength region and 2 nm for 1000-2500 nm regions. The fibre optic probe has a Field of View (FOV) of 25° full conical angle. Since the objective was to study in situ
spectral reflectance of diverse coral communities, a point sampling strategy was followed. The field spectroradiometer was calibrated with reference to a Spectralon white plate and thereafter multiple coral spectra were recorded from different sample stations. For each station, a minimum of thirty reflectance spectra was logged along with GPS coordinates, water depth and water transparency (visual). Spectral measurements were carried out for twenty two stations over three consecutive days during 09:00 to 10:30 hrs (to reduce illumination variations) when the live coral colonies were submerged in less than 10 cm of clear, water column and data logging was completed within 15-minute period for each station. The field spectra were subsequently processed with the help of ViewSpecPro software (version 5.6).
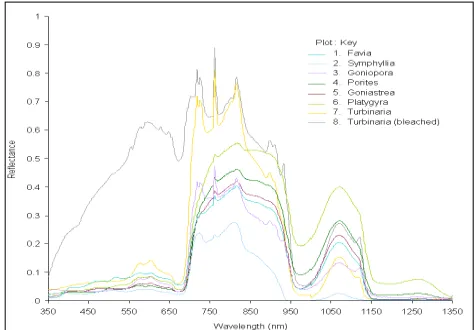
Figure 5 shows the in situ reflectance spectra of these coral targets over the spectral range of 350 to 1350 nm. All corals have central maxima near 820 nm and another prominent peak at 1070 nm. The spectra are marked with two characteristic absorption features located at 675nm (chlorophyll absorption) and at 975 nm (water absorption). The chlorophyll absorption at 675 nm is followed by an abrupt, steep rise in the NIR region. As per the spectral characteristics apparent in Figure 5 the eight coral targets can be grouped into three distinct groups: Group A consisting of Favia, Porites, Goniastrea and Platygyra; Group B comprising of
Symphillia, Goniopora and Turbinaria (Live) and Group C: the bleached Turbinaria.
7 Turbinaria Foliose 4.00
Laku
Group A corals represent massive, sub-massive and encrusting colonies with equal proportion of exposure of soft, live coral polyps and their calcium carbonate corallites. Two of the Group B corals (Symphyllia and Goniopora) representing massive and sub-massive colonies had relatively more exposure of the soft, live coral polyps than the calcium carbonate corallites. Turbinaria
(live) on the other hand represents a foliose colony with more of a calcium carbonate structure with live coral polyps. Group C: the bleached Turbinaria represents the same with polyps largely devoid of endo-symbiont zooxanthellae.
Table 1. Details of the eight sampled coral targets Table 1. Details of the eight sampled coral targets
Later analyses were focused on these eight coral targets. In general, it was found that there were negligible spectral signal received from the coral targets beyond 1350nm. Accordingly, simple average spectra and their first and second-order derivatives (over 4nm as finite band resolution) were numerically constructed for spectral characterization (Hochberg et al. 2003). The spectral plots were visually compared.
Later analyses were focused on these eight coral targets. In general, it was found that there were negligible spectral signal received from the coral targets beyond 1350nm. Accordingly, simple average spectra and their first and second-order derivatives (over 4nm as finite band resolution) were numerically constructed for spectral characterization (Hochberg et al. 2003). The spectral plots were visually compared.
Figure 4. Field photographs of the eight coral targets Figure 4. Field photographs of the eight coral targets (numbered serially)
(numbered serially)
4. RESULTS & DISCUSSION 4. RESULTS & DISCUSSION
Favia was the most dominant scleractinian genus, ubiquitously occurring on the inter-tidal reef flat and also in the sub-tidal areas of Laku Point and Paga reefs. The second dominant genus was
Porites followed closely by Goniastrea and Goniopora in both the locations. Symphillia wasfound only in the sub-tidal zones of Paga while Turbinaria were sampled from Laku Point. Platygyra
was sampled from Paga reef.
Figure 5. In situ reflectance spectra of the sampled coral targets Figure 5. In situ reflectance spectra of the sampled coral targets
Group A corals represent the purest form of in situ live coral spectra with an average water column of 1.7 cm. The individual spectra of these four corals run absolutely parallel to each other and have a near-perfect match in terms of their spectral architecture (shape). Favia shows the least reflectance over the entire range of 350 to 1350 nm, followed by Goniastrea, Porites
and Platygyra: the last showing the highest reflectance. In visible region, Group A spectra conform to the “brown mode” of coral spectra (Hochberg et al. 2004) characterized by ‘triple-peaked reflectance pattern’ first reported by Myers et al. in 1999. This brown mode of coral spectra generally exhibit a depressed reflectance between 400 and 550 nm and triple peaks or local maxima/shoulders at 575, 600 and 650 nm. Group A corals showed the characteristic chlorophyll absorption feature at 675 nm due to the presence of photosynthesizing endo-symbiont algae (zooxanthellae) within the host coral tissues (Holden and LeDrew, 1999). In the NIR region (700 to 1000 nm) these corals show a unique, near-symmetrical, bell-shape curve with central maxima located at 820 nm. Following the abrupt, steep rise between 690 and 710 nm, all the spectra gradually increases to 820 nm with a Group A corals represent the purest form of in situ live coral spectra with an average water column of 1.7 cm. The individual spectra of these four corals run absolutely parallel to each other and have a near-perfect match in terms of their spectral architecture (shape). Favia shows the least reflectance over the entire range of 350 to 1350 nm, followed by Goniastrea, Porites
characteristic spike located near 760 to 762 nm. This spike is however a contribution from the atmospheric oxygen and brings out the limitation of the instrument to outweigh this spike while sensing and recording the target spectra. Favia spectra shows a small hump at 728 nm which is absent in rest of the Group A corals. The spectra show a rapid descent from 820 to 840 nm followed by a gradual descent over 840 to 910 nm region. Beyond 910 nm the spectra are characterized by a steep descent to the water absorption feature located at 975nm. The absorption band depth appears to be a function of the depth of overlying water column. In the MIR region, the spectra show similar symmetrical bell-shape architecture with central maxima located at 1070 nm. Beyond 1150 nm upto 1350 nm the spectra show a featureless straight line trend except Platygyra which show a plateau at 1270 nm.
In case of Group B corals, the spectral architecture as shown by the Group A corals get considerably modified in the NIR region. The triple-peaked pattern is quite pronounced in case of
Turbinaria and Goniopora while gets subdued for Symphillia. In NIR region these corals exhibit a hump at 725 nm which from Group A only Favia showed at 728 nm.Contrary to the Group A corals’ steady rise from 710 nm to 820 nm Group B corals show a peak and valley pattern in this region. Group B corals exhibit a pronounced descent from 820 to 840 nm deviating from the Group A trend of gradual descent over 840 to 910 nm. Turbinaria
and Goniopora show a steep, stepped fall from 840 to 890 nm, 900 to 930 nm and 933 to 999 nm interrupted by small spikes at 898 nm and 933nm. This is due to the ripple effect of the water column present on the targets. The water absorption trough centered at 975 nm is present for both. Symphyllia though conforms to the trend of steady descent from 820 to 840 nm but deviates from the Group B trend in 840 to 950 nm region by showing a convex drop upto 935 nm. The water absorption feature of Symphyllia is absent from display in the 950 to 1000 nm region because of negative reflectance values indicating a strong water column absorption since this coral was submerged under 8 cm water column– the maximum recorded on field. In MIR region, however, Group B corals conform to the trend of Group A corals.
Group C represented by the bleached coral spectrum of
Turbinaria is characteristically different from the live corals in UV-Visible region with relatively much higher reflectance values, shooting up to its maximum at 590 nm (six times as that of its live counterpart). Right from 350 to 600 nm the bleached coral spectrum rises steadily with minor breaks of slopes. Between 590 and 650 nm, this spectrum again show a stepped pattern of descent with intermittent breaks of slopes. Thereafter, it plunges down to the chlorophyll absorption trough located at 675 nm. Unlike the live coral spectra, the bleached coral spectrum has a stepped rise up to 710 nm. Beyond 715 nm to 1350 nm this spectrum closely follows the trend of live Turbinaria with characteristic local shoulders and troughs getting vertically pronounced.
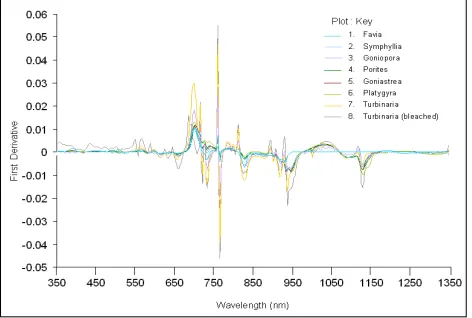
In order to exaggerate the spectral shapes and enhance the subtle features of the zero-order spectra, the first and second order derivatives (Figure 6 and 7 respectively) were numerically calculated over 4nm as finite band resolution. Figure 6 shows 700 and 760 nm as the locations corresponding to peaked coral reflectance for all the eight corals. However, the peak at 760 nm
is not a contribution from the target. In the visible region two peaks out of that triple peak at 575 and 600 nm also become prominent in the first derivative spectra. The first order derivatives also bring out the characteristic absorption troughs located over 650 to 675 nm, 800 to 850 nm, 900 to 950 nm and 1100 to 1150 nm for all the eight corals. Moreover, the first derivative of averaged reflectance appears to provide a good separability between bleached and live corals over a large spectral region from 430 to 590 nm. At 631 and 647 nm the first derivative values of all the live corals are negative while for the bleached coral it is positive.
Figure 6. First derivatives of the sampled coral spectra
The second derivative of the averaged reflectance identifies 680 to 700 nm region as a window to separate live and bleached coral spectra. In this region all the live corals record a positive second derivative value while the bleached coral has a negative value. The second derivative plot also shows the enhanced reflectance and absorption features of Symphyllia which rather showed a subdued zero-order signal because of the maximum water column.
Figure 7. Second derivatives of the sampled coral spectra
5. CONCLUSIONS
The results obtained in this preliminary study suggests that in situ
in the NIR region (Green et al. 2000) with central maxima at 820 nm and a secondary peak at 1070 nm in the MIR region. The live corals exhibited “brown mode” of coral reflectance with triple-peaked pattern in the visible region. All spectra have a characteristic spike located at 760 to 762 nm due to the presence of atmospheric oxygen. The coral spectra are characterized by two distinct absorption features located at 675 nm (chlorophyll absorption) and 975 nm (water absorption). The absorption band depth at 975 nm is a function of the depth of water column and water column does suppress the reflectance magnitude. Ripples on moving water column drastically change the spectral shape of corals at 840 nm. The live and the bleached coral spectra can be well distinguished in the 400 to 600 nm region. The relative exposure of coral polyps and corallite structure can be a major determinant in the spectral behaviour of the corals at colony scale. The first and second order derivatives can be employed to identify common reflectance and absorption regions of the coral targets along with potential region(s) of separation between live and bleached corals. Live and bleached corals get differentiated with first-order derivatives at 631 and 647 nm while 680 to 700 nm window show their clear separation with second-order derivatives However, bleached coral target needs to be sampled more in order to strengthen these observations. Derivative analysis needs to be investigated in depth and with more number of samples to comment on the spectral separability of the coral targets.
6. REFERENCES
References from Journals:
Clark, C. D., Mumby P.J., Chisholm, J.R.M., Jaubert, J. and Andrefouet, S. 2000. Spectral discrimination of coral mortality states following a svere bleaching event. International Journal of Remote Sensing, 21(11), pp. 2321-2327.
Hedley J.D. and Mumby, P.J. 2002. Biological and remote sensing perspectives of pigmentation in coral reef organisms.
Advances in Marine Biology, 43, pp.277-317
Hochberg, E.J. and Atkinson M.J. 2000. Spectral discrimination of coral reef benthic communities. Coral Reefs, 19, pp. 164-171
Hochberg, E.J. and Atkinson M.J. 2003. Capabilities of remote ensors to classify coral, algae and sand as pure and mixed spectra.
Remote Sensing of Environment 85 pp. 174-189
Hochberg, E.J., Atkinson, M. J. and Andréfouët, S. 2003. Spectral reflectance of coral reef bottom-types worldwide and implications for coral reef remote sensing. Remote Sensing of Environment 85 pp. 159-173
Hochberg, E.J., Atkinson, M. J., Apprill, A. and Andréfouët, S. 2004. Spectral reflectance of coral. Coral Reefs, 23, pp. 84-95
Holden, H. and LeDrew, E. 1998. Spectral discrimination of healthy and non-healthy corals based on cluster analysis, principal components analysis and derivative spectroscopy. Remote Sensing of Environment 65 pp. 217-224.
Joyce, K. E. and Phinn, S.R., 2002. Bi-directional reflectance of corals. International Journal of Remote Sensing, 23(2), pp. 389-394.
Joyce, K. E. and Phinn, S.R., 2003. Hyperspectral analysis of chlorophyll content and photosynthetic capacity of coral reef substrates. Limnology and Oceanography, 48(1, part 2), pp. 489-496.
Kutser, T., Dekker, A.G. and Skirving, W. 2003. Modeling spectral discrimination of Great Barrier Reef benthic communities by remote sensing instruments. Limnology and Oceanography,
48(1, part 2), pp. 497-510.
Lubin, D. Li, W., Dustan, P., Mazel, C.H., and Stamnes K. 2001. Spectral signatures of coral reefs: features from space. Remote Sensing of Environment 75 pp. 127-137
Patel, M.I. 1978. Generic diversity of scleractinians around Poshetra Point, Gulf of Kutch. Indian Journal of Marine Sciences, 7, pp. 30-32
References from Books:
Green, E.P., Mumby, P.J., Edwards, A.J., Clark, C.D. (eds. A.J. Edwards). 2000. Remote sensing handbook for tropical coastal management: Coastal management sourcebooks 3, UNESCO, Paris.
Navalgund R. R., Ajai, Bahuguna A., Ray Chaudhury N., Bhattji N.S., Madhupriya N., Sharma S., Parihar J.S., Panigrahi S., Chakraborty, M., Dwivedi, R.M., Ramdass S. and Swaroop P (2010): Coral Reef Atlas of The World Vol.1 Central Indian Ocean, Space Applications Centre, (ISRO), Ahmedabad, p: 282.
Venkataraman, K., Satyanarayana, Ch., Alfred, J.R.B. and Wolstenholme, J. 2003. Handbook on Hard Corals of India, Zoological Survey of India, Kolkata, p: 266
References from websites:
Goodman J.A. and Ustin S.L. 2002. Acquisition of underwater reflectance measurements as ground truth. ftp://popo.jpl.nasa.gov/pub/docs/workshops/02…/2002_Goodman _web.pdf
7. ACKNOWLEDGEMENTS
This study presents the preliminary results of the work being carried out under Optical Characterization of Coral Reef Diversity Project under Meteorology and Oceanography Programme of Space Applications Centre, ISRO. The author is thankful to Director, Space Applications Centre and Dr. J. S. Parihar, Deputy Director, EPSA for overall technical guidance and support for this study. The work has been carried out in collaboration with GEER Foundation, Gandhinagar. The author sincerely acknowledges the contribution of all the members of project team of GEER Foundation and Space Applications Centre, ISRO.
Holden, H. and LeDrew, E. 1999. Spectral identification of coral reef features. International Journal of Remote Sensing,