SURVEYING AND MAPPING A CAVE USING 3D LASER SCANNER:
THE OPEN CHALLENGE WITH FREE AND OPEN SOURCE SOFTWARE
T. Cosso a, I. Ferrando b, A. Orlando c
a GTER s.r.l., Genova, Italy – [email protected]
b DICCA, Dept. of Civil, Chemical and Environmental Engineering, Università degli Studi di Genova, Italy – [email protected]
c trainee at GTER s.r.l., Genova, Italy – [email protected]
KEY WORDS: survey,3D laser scanner, Open source software, Cave, Point clouds, Mesh
ABSTRACT:
The present work is part of a series of activities involving different skills, in order to explore and document in detail one of the most visited caves in Liguria Region. In this context, in addition to speleologists, geologists, videographers, the geomatic expertise has also been involved to carry out a laser scanner survey, in order to produce a three-dimensional model of the two more easily accessible rooms of the cave.
The survey was carried out using Z+F IMAGER® 5010 instrument and the post processing operations related to registration of point clouds have been made with Z+F LaserControl®.
Subsequently, two different free and open source software were used: MeshLab, to merge the point clouds and to obtain the final mesh, and CloudCompare, to make filtering on the previous results and to extract sections.
1. INTRODUCTION
In a large project that concerns a detailed exploration of Pollera cave, with the final aim of improving and promoting the tourism in the area as well as the updating of the presently available data, a 3D survey of the more easily accessible rooms was needed.
In this context, it was decided to carry out a survey with a high-precision laser scanner, in order to obtain a 3D model from which could be possible to obtain a range of products.
On the one hand, the model can be support to the definition of multimedia products such as movies, images or scenes for 3D virtual tours, also considering that many activities of HD video filming have already been carried out in this context.
On the other hand, the 3D model, once geo-referenced with respect to a reference frame materialized through classical topographic networks which was already carried out along the entire development of the cave, becomes an essential tool for generate geo-cartographic products. For example, these kind of cartographic informations provide the possibility, to extract vertical or transversal sections, that are an important support for the excursion planning in an underground environment. In addition, the ability to calculate areas and volumes offers significant and interesting prospects in terms of monitoring, within a context in which the conformation of the environment may change over time.
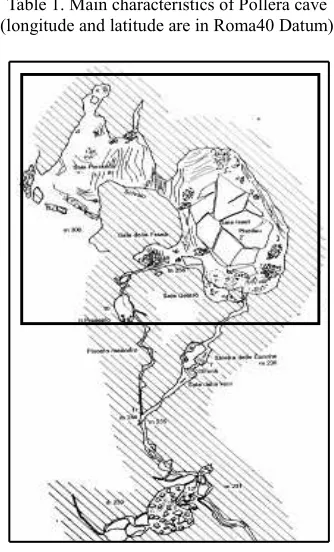
2. THE SURVEY OF POLLERA CAVE 2.1 Structure of the cave
The subject matter of the research is Arma Pollera cave, a part of the Pollera-Buio carsic complex, situated in Rocca Carpanea of Finale Ligure (SV), Italy.
The cave, whose most relevant characteristics are listed in table 1, is characterized by a rather large and easily accessible entrance immediately followed by a steep and muddy descent,
with a length of about 50 meters, which is to be crossed with the use of ropes.
Longitude 4° 08' 19'' (West Monte Mario)
Latitude 44° 11' 58''
Height 284 m a.s.l.
Altitude gap 64 m
Table 1. Main characteristics of Pollera cave (longitude and latitude are in Roma40 Datum).
The descent connects the entrance with a lower large room characterized by morphologies of collapse, where some narrower, and so more suitable for expert speleologists, itineraries branch off.
The topographical survey was carried out integrating traditional procedures with the innovative 3D laser scanner technique. The focus is here restricted to the description of the main steps of the 3D laser scanner survey and the further elaborations of data, that gave birth to the realization of the 3D model of Pollera cave.
2.2 Survey design
The peculiarity of the survey, which requires specific technical knowledge and skills to move into underground environment, has made necessary a careful planning phase, carried out jointly between geomatics and speleologists.
The primary requirements from the speleologists can be summed up in the need to have a unique accurate (on the order of centimetres of accuracy) three-dimensional survey of the previously described environments, which could be correlated with other types of informations acquired in the course of time, in order to deepen the knowledge of the cave and to make this knowledge accessible to fans.
For these reasons, the essential needs are:
1. to geo-reference the 3D model with respect to a polygonal previously carried out within the cave, which represents the geographical reference for all types of information gathered up to now;
2. to provide a model which would become an important mean for dissemination purposes, along with the creation of multimedia products such as video and image sequences already made.
To accomplish these aims, it was decided to carry out a survey using the Z+F IMAGER® 5010 laser scanner, considering not to make any topographic survey, that would have led to considerable logistical difficulties and that was not necessary, in view of the required precision.
The location and number of stations have been planned using the map of the cave and the experience of the speleologists; in particular, because of all the scans had to be combined in a single 3D model, also in these complex environments (mainly referring to the chute), additional stations had to be foreseen for linking all the point clouds.
In the planning phase, it was also tried to figure out how to insert the targets, believing that, if possible, they might be useful in the registration of scans, being difficult to find other natural points common to the scans.
2.3 Survey realization
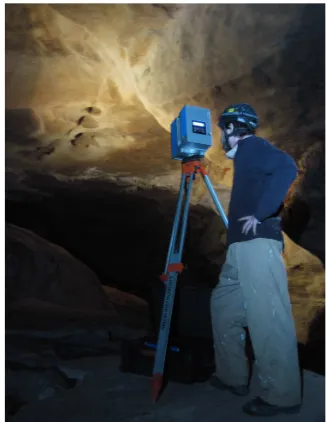
The project has been developed starting from the acquisition of data with Z+F IMAGER® 5010 instrument; eleven scans in high resolution and high quality mode were needed in order to detect any point of the cave surface.
Despite a carefully organized planning of the scanning stations, in some places it was almost impossible to create a proper station, due to the peculiar and complex conformation of the cave. In particular, in a peripheral area of the lower hall, due to some collapsed boulders, it was impossible to cross the area with the instrument, so it was decided to carry out a scan in a different location than originally planned, with the consequence of an in-situ re-planning of a part of the survey. Also along the chute, which was very slippery and muddy because of the intense rain in the days before the survey, a sufficiently stable
area on which it was possible to place the scanner was found not exactly in accordance with what was planned.
A rather complex phase of the survey was the placement of the targets. Only a small amount of planned targets were placed in easily accessible locations so that they could be visible from multiple scans. Particularly in most hidden areas, where it was necessary to perform scans at different heights, placing the instrument over large boulders, it was not easy to identify sites where to place targets visible from two or more scans. In this phase, it was convenient the use of special support trestles, but, in any case, the number of targets placed has proven to be lower than necessary, and this led to problems in the subsequent step of registration.
Figure 2. An image of the laser scanner while working.
3. WORKING PROCEDURE AND RESULTS In the next paragraphs the post processing elaborations carried out after the survey are presented to explain the working procedure implemented in order to fulfill the purpose of generating the 3D model of the cave.
3.1 Implemented working procedure
The working procedure can be summarized as follows:
1. registration of point clouds, by means of detecting and picking homologous points in different scans;
2. geo-referencing, achieved looking for correspondence
4. generation of products such as horizontal and vertical sections of the mesh.
3.1.1 Registration of point clouds The post processing operations related to registration of point clouds have been carried out with Z+F LaserControl®, the software of the Z+F IMAGER® 5010 instrument.
easy in cases where the geometry is simple or there are some easily recognizable features, for example in architectural context. In the present case, the first try was to detect the planned targets, placed during the survey. As mentioned before, not all these targets where easily identifiable or visible from multiple scans; moreover, the most of them was placed at the same height, just because of difficult operative conditions, this causing the lability of the whole system and the impossibility of creating a proper registration of all the point clouds.
So, because of the complex conformation of the cave, the real struggle was to rely on the ability to recognize not only the planned targets placed in the cave during the survey, but also additional reference points.
To solve the lack of fixed points, many tiny natural details of the cave, such as little rocks, spots and many other recognizable particulars on the surface of the cave, were identified as additional targets. This choice was decisive to fulfill the registration of point clouds, but also was very laborious because of the difficulty of detecting the mentioned points in the scans.
Figure 3. One of the eleven scans in which to detect targets and additional reference points.
A suggested solution for the future consist in making a higher resolution scan to be used just for the registration phase and then to perform a strong resampling for the following mesh reconstruction phase, in order to obtain reasonable processing times.
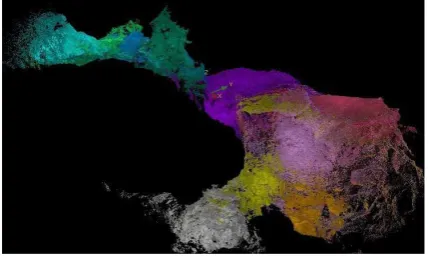
After this laborious operation, using Z+F LaserControl® it was possible to succeed in registration, with a mean error on the order of 10 cm into the whole project. The resulting point cloud is represented in figure 4.
Figure 4. Point clouds registered with Z+F LaserControl®. Each colour corresponds to a different point cloud.
The registration could be also achieved using MeshLab or CloudCompare but these software allow registration only on 3D point clouds; this would be very difficult in the present situation, where there is a few number of recognizable points and the different point clouds don’t have an adequate overlapping to perform an automatic or manual registration just
working with roto-translation of two or more adjacent point clouds. Viceversa, using Z+F LaserControl®, the registration is performed on scans, so in 2D, where the identification of tie points is easier.
3.1.2 Geo-referencing Similar to the registration of point clouds, the geo-referecing of the resulting registered point cloud was carried out using Z+F LaserControl®. In this case, instead of recognizing the same targets in different scans, datum points were detected and then associated to their coordinates, obtained from previous surveys.
In this step of the procedure, the hardest part was not to identify the points in the scans, that are very clear because of their higher reflectance compared with the quite homogeneous surface of the cave, but the difficulty lied into link every detected point to its correspondent in the topographical survey. In this complex situation, the help and the experience of the speleologists who made the survey was essential to perform a correct geo-referencing.
3.1.3 Mesh reconstruction After the preliminary steps of the procedure, the Z+F LaserControl® software was left in favour of two different free and open source software: MeshLab and CloudCompare; the first was mainly used to merge the registered point clouds and to obtain the complete mesh, the latter was employed to make manual filtering on the previous results and to extract sections.
In this phase of the procedure the difficulty lied in dealing with big data. The high resolution and so the large number of points in each cloud were necessary during the registration to identify binding points in a particularly complex situation, but they made almost impossible the processing operations, so a resample was needed to allow an easier management and elaboration of data.
The resampling was made using Z+F LaserControl®, that allows to resample each scan interpreting it as a matrix, so it is easy to choose how many points to pick in every row and column and to preserve the original density of data. Then each resampled cloud was exported in *.ptx format and imported in MeshLab for the following manipulations.
At this point of the procedure, the different point cloud have to be merged, to obtain the complete and final point cloud, so the first step performed in MeshLab was the creation of the merged point cloud, obtained by the means of the flatten visible layers tools. Then, to obtain a better cleaned point cloud, filters on duplicated vertices were employed using MeshLab by selecting the minimum distance between two close points.
After this filter, the transition from the point clouds to the mesh has been carried out with MeshLab through the Poisson surface reconstruction: this algorithm generates a triangulated mesh from the interpolation of normally to surface oriented point sets. By means of the Poisson surface reconstruction approach, the structure of the cave is so recreated by solving the Poisson problem.
The Poisson surface reconstruction needs four parameters, octree depth, solver divide, samples per node, surface offsetting, which influence the final results as follows (the next lines are acquired from the MeshLab guide):
1. Octree depth: sets the depth of the octree used to extract the resulting surface. Higher values of this parameter mean higher precision in the reconstruction but, on the other hand, higher processing times; 2. Solver divide: using this parameter reduces memory
usage;
High value of this parameter can provide a smoother and noise-reduced reconstruction of surface;
4. Surface offsetting: specifies a correction value for the isosurface threshold chosen.
Some attempts were needed to find the best calibration of the Poisson surface reconstruction algorithm's parameters (which were set respectively to 12, 12, 1, 1), also considering processing times and memory needed to fulfill the generation of mesh.
For the processing operation, an 8 RAM and Intel® Core™ i7 processor PC was used. To fulfill the reconstruction of the entire mesh, about 15 minutes were needed, having set the Poisson surface reconstruction algorithm's parameters at the values indicated before.
As mentioned in the description of parameters, the one which has a deeper influence on the processing times is the octree depth; a high value was needed to obtain an accurate mesh, so we choose to have a high accuracy to the disadvantage of computational speed.
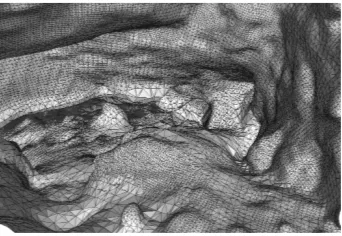
A sample of the resulting mesh is represented in figure 5, where the accuracy of reconstruction can be appreciated.
Figure 5. A sample of the mesh obtained from Poisson surface reconstruction using MeshLab.
Once the mesh was created, a manual filter was needed to delete those points that caused errors in mesh reconstruction, mainly due to the presence of trees at the entrance of the cave, which produced noise and the closing of the entrance, and little meshes outside the main perimeter of the cave. Also this filter was performed using MeshLab by manually selecting and deleting the identified imprecisions.
The final step of mesh reconstruction was carried out with CloudCompare. The complete mesh was exported in *.ply format and imported in CloudCompare; using this software it was possible to apply the final filter, the PCV Ambient Occlusion, a shading method used for 3D computer graphic, which reckon with attenuation of light in proximity of occluded volumes, giving a more realistic appearance.
Figure 6. A sample of PCV Ambient Occlusion filter.
Following the described steps, the mesh reconstruction was performed. The final result is shown in figure 7.
Figure7. The final 3D mesh model, after cleaning and filtering.
3.2 Resulting products
In the next three paragraphs the final products, resulting from direct elaborations and interaction with the 3D model, are presented.
3.2.1 Sections The final product of the procedure are the sections, obtained using CloudCompare. The extraction of parallel multiple sections is very simple by using a dedicated tool, the cross section tool; once the orientation, thickness and dimensions of section plan are set, the cross section tool’s final results are (multiple) contours and slices of the point cloud. In case of multiple sections, in addition to sections plan orientation, thickness and dimension, also the gap between two consecutive sections has to be imposed.
An example of multiple horizontal sections, with a gap of 0.2 m, is represented in figure 8.
Figure 8. Horizontal sections extracted with CloudCompare.
The importance of extracting sections consist in the possibility of evaluate the vertical profile of the cave and obtain plans.
To generate an orthophoto using Z+F LaserControl®, the first step is to define a projection plane by means of the plane management tool picking an a scan an area almost parallel to the resulting parallel plan, then the characteristics of the plane can be adjusted through roto-translations of the plane to best fitting what should be included in the orthophoto.
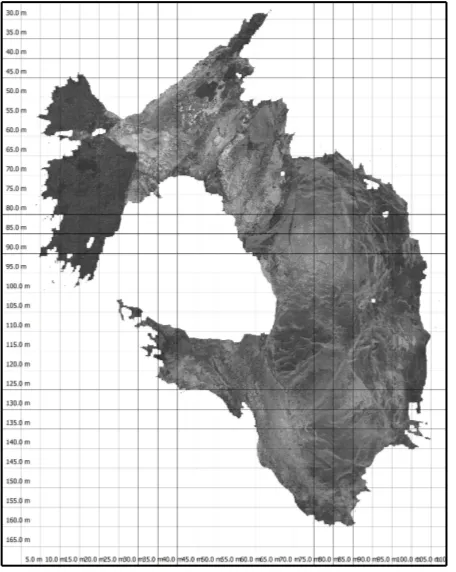
For the present work, a parallel plane to the roof of the lower room of the cave, which is approximately horizontal, was defined and then the orthophoto shown in figure 9 was extracted.
Figure 9. The orthophoto resulting from Z+F LaserControl.
3.2.3 Textured model The last resulting product of the procedure is the textured model, which was obtained using the Z-painting tool in MeshLab. This tool allows to colourize the mesh using sample colours or taking a texture from a picture. This second feature was employed using as texture one of the picture taken inside the cave during the survey. A very realistic appearance is so given to the intern of the cave, applying the texture to the 3D model. The obtained textured model can be useful, for example, to make the virtual exploration of the cave a very realistic experience.
Figure 10. The textured 3D model.
In this picture, the entrance of the cave is represented.
An alternative to the post-processing colourizing is possible only if the 3D laser scanner is equipped with a camera that can record the real colours, which can be added in the mesh using MeshLab by recovering colour as a texture or as per-vertex colour. These features allows to simply transfer the colour attribute from the original point cloud to the reconstructed surface.
3.3 Summary
In the first column of table 2, the steps of the implemented procedure are summarized; in the second, the software used to fulfill each step is reported.
Step of procedure Used software
Registration Z+F LaserControl®
Geo-referencing Z+F LaserControl®
Filters on point cloud MeshLab
(duplicate points removal)
Mesh reconstruction MeshLab
(Poisson reconstruction surface)
Filters on mesh MeshLab
(manual filter)
PCV Ambient Occlusion CloudCompare
Sections CloudCompare
Orthophotos Z+F LaserControl®
Textured model MeshLab
Table 2. Summary of implemented procedure.
3.4 Comparison, limits and potentiality of OS software Despite of different applications of the two software for this work, that held to a complementary usage of them, both MeshLab and CloudCompare support the basic functions of point cloud processing, such as importing, visualizing and exporting point clouds and meshes, filtering on points and on meshes, mesh creating, colouring and texturing, aligning and registering point clouds, but the final results are different and better performances are hidden in their tools and not in the program itself.
We decided to use both MeshLab and CloudCompare in order to individuate the optimal procedure, to perform a comparison between them and also because opting for only one of them for the entire process would have carry us to a partial satisfying result.
What emerged from our experience is that apparently MeshLab could seem less intuitive, partly because it seems to promise much more commands and performances, partly because of its large amount of filters, plug-in andprocessing tools, typical of every good open source program; instead CloudCompare looks like a faster and easier program to manipulate even huge point clouds, also because it was originally designed for comparison between point clouds and only in a second time it was extended to other functionalities for point cloud processing.
5. FURTHER DEVELOPMENTS
The work of data processing and elaboration is currently proceeding in order to deepen the knowledge of MeshLab and CloudCompare with the final aim of individuate an optimal and definite procedure, relevant for similar survey situations. This purpose will be achieved also by applying the procedure to other case studies, to explore the largest amount of possible situation, detect the limits of the implemented procedure and to find the better strategies to obtain a 3D model and derive products starting from the acquisition of point clouds by means of a 3D laser scanner survey.
Furthermore, a comparison between the final products obtained from the described operations and the results of traditional topographic surveying methods is foreseen, in order to evaluate the quality of the survey, to complete the measurements and, finally, to integrate the obtained results with the ones derived by other survey experience and scientific researches..
CONCLUSIONS
The work presents procedures, problems and solutions characterizing the 3D laser scanner survey in a cave.
After an introduction to the planning and the implementation of the survey, where the encountered difficulties are stressed, a procedure involving both commercial and open source software is presented. Following the implemented procedure it was possible to fulfill the post processing elaboration, which allowed to create a three-dimensional model and other products, such as sections, orthophotos and textured model.
The procedure is schematically divided into these steps: 1. registration of point clouds
2. geo-referencing 3. mesh reconstruction 4. generation of products.
As a consequence of the application of the implemented procedure it is possible to understand which are the weak points of the survey procedure and analyse them in order to keep in mind for the further surveys.
The entire procedure is now being applied to other case studies to improve the knowledge of the software and their tools to obtain a final and stable optimal procedure, applicable in many different situations. This could be very useful and educational to whom approaches the 3D laser scanner survey and the post processing procedures for the first time.
The further developments of the project will concern the integration of the present results with those obtained with traditional topographic surveying methods and those derived from some different scientific researcher, in order to produce complete and easily to be consulted products.
This can make possible the virtual exploration of barely reachable places to the majority of people.
ACKNOWLEDGMENTS
The authors wish to thank the members of CarpeNeam, a multi-disciplinaryproject taking its origins from a Regional Financing required by the Ligurian Speleological Delegation in order to review and update the cadastral data of the whole Pollera-Buio carsic complex, with the final purpose of creating a detailed description of the area with elaborates such as plans, sections and 3D model.
REFERENCES
Gonzalez-Aguilera D., Muñoz A.L., Lahoz J.G., Herrero J.S., Corchón M.S., García E., 2009. Recording and modeling Palaeolithic caves through laser scanning, International Conference on Advanced Geographic Information Systems & Web Services.
Gonzales-Aguilera D., Muñoz A.L., Lahoz J.G., Herrero J.S., Gutierrez-Alonso G., 2009. 3D digital surveying and modelling of cave geometry: application to Palaeolithic rock art, Sensors 9 (2), pp. 1108-1127.
Rodriguez-Gonzalves P., Mancera-Taboada J., Gonzales-Aguilera D. Muñoz-Nieto A., Armesto J., 2012. A hybrid approach to create an archeological visualization system for Palaeolithic cave, Archaeometry 54, 3, pp. 565-580.
MeshLab website: www.meshlab.sourceforge.net