www.elsevier.nlrlocateraqua-online
The influence of dietary protein and fat levels on
tissue free amino acid levels of fingerling rainbow
ž
/
trout Oncorhynchus mykiss
Takeshi Yamamoto
a,), Tatsuya Unuma
b, Toshio Akiyama
ca
Fish Feed Section, Inland Station, National Research Institute of Aquaculture, Tamaki, Mie 519-0423, Japan b
ReproductiÕe Technology Section, Coastal Station, National Research Institute of Aquaculture, Nansei, Mie
516-0193, Japan c
Research Coordinating Section, National Research Institute of Fisheries Science, Fukuura, Kanagawa 236-8648, Japan
Accepted 27 July 1999
Abstract
The influence of six semi-purified diets having different nutrient composition on the tissue free
Ž .
amino acid FAA levels of fingerling rainbow trout was examined. Four balanced amino acid
Ž . Ž Ž . Ž ..
diets casein:gelatins6:1 with combinations of two protein levels 35% LP and 50% HP and
Ž Ž . Ž .. Ž . Ž
two fat levels 10% LF and 20% HF , and two imbalanced high-protein 50% diets IMB-HP,
. Ž . Ž
casein:gelatins1:1 with two fat levels LF and HF , were each fed to duplicate groups 30
.
fishrgroup, 10 grfish for 6 weeks at 158C. FAA in plasma, liver, dorsal white muscle and brain at 12 h after the last feeding were compared. Percentage weight gain of the HPHF diet group was
Ž .
the highest, but was not different P)0.05 from the others except for the IMB-HPLF diet group
ŽP-0.05 . Levels of individual amino acids in the whole body protein were not markedly. Ž .
different among the treatments. Most of the free essential amino acid EAA levels in the tissues of the HP diet fed fish were higher than in those of the LP diet group. The levels of free phenylalanine and tyrosine of the HF group tended to be higher, and those of taurine lower, than the LF group. Most of the free EAA levels of the IMB diet group were lower even than the LP group. Correlations in EAA patterns between a given diet and tissue were high in plasma, but very
)Corresponding author. Tel.:q81-596-58-6411; fax:q81-596-58-6413; e-mail:
0044-8486r00r$ - see front matterq2000 Elsevier Science B.V. All rights reserved.
Ž .
low in muscle and brain. These findings suggest that not only dietary protein level and amino acid profile, but also dietary fat level affects the levels of certain FAA of rainbow trout tissues.q2000 Elsevier Science B.V. All rights reserved.
Keywords: Casein; Free amino acids; Gelatin; Oncorhynchus mykiss; Plasma; Tissue
1. Introduction
Ž .
The concentration of free amino acids FAA in animal tissues can be an sensitive tool to determine the adequacy of dietary amino acids and to estimate the amino acid
Ž .
requirement of the animal Pion, 1976 . In fish, levels of FAA in tissues are also known Ž
to be affected by dietary protein quality Nose et al., 1978; Kaushik and Luquet, 1980;
. Ž .
Dabrowska, 1984 , and a relationship between tissue essential amino acid EAA levels Ž
and dietary requirements has been suggested Cowey and Walton, 1989; Kaushik et al., .
1994; Schuhmacher et al., 1997 . Thus, tissue FAA levels in fish may be useful to know sufficiency of amino acids in practical feeds containing various protein sources.
The influence of dietary protein levels on tissue FAA levels has been examined in Ž
rainbow trout Cowey et al., 1977; Yokoyama and Nakazoe, 1991; Yokoyama et al.,
. Ž . Ž .
1994 , masu salmon Ogata and Murai, 1994 , and European eel Ogata et al., 1985 . These studies have shown, in general, that the tissue EAA levels tended to increase as the dietary protein level increased. In channel catfish, the serum FAA levels of fish fed diets with various protein to energy ratios were compared, and the effect of dietary
Ž . Ž .
energy fat level was found to be insignificant Wilson et al., 1985 . Since there is a
Ž .
slower rate of protein turnover in muscle than in other organs Fauconneau, 1985 , the influence of dietary treatments, especially dietary amino acid profiles, may be more responsive in other tissues than muscle. As most studies have examined the influence of dietary treatments on FAA levels of blood andror muscle, the influence on FAA levels in other tissues should be examined.
On the other hand, the relationships between dietary amino acid patterns and tissue FAA patterns have been evaluated in several fish species, and the results have shown that a high correlation exists between dietary and plasma EAA patterns in common carp ŽPlakas et al., 1980; Dabrowski, 1982; Ogata, 1986 , rainbow trout. ŽNose, 1973;
.
Kaushik and Luquet, 1977a; Walton and Wilson, 1986; Murai et al., 1987 , and some
Ž .
other species Lyndon et al., 1993; Kaushik et al., 1994 . As the correlations in most of these studies were determined using only one diet or several diets having similar amino acid profiles, it is not clear whether such high correlations exist when different dietary treatments are fed.
2. Materials and methods
2.1. Diet
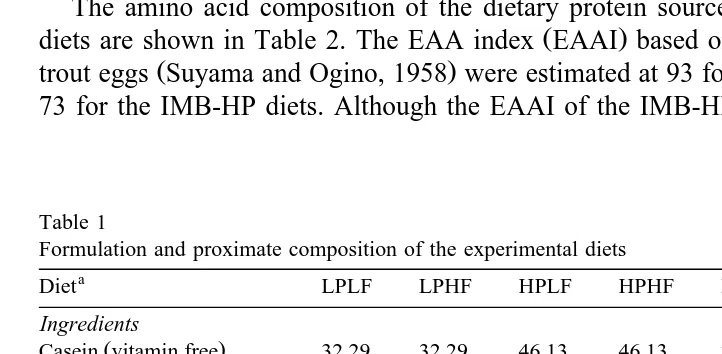
The ingredients and proximate composition of the experimental diets are shown in
Ž .
Table 1. Six semi-purified diets were prepared using vitamin-free casein Wako, Japan
Ž . Ž
and gelatin Difco Laboratories, USA as the protein sources, pollock visceral oil Riken
. Ž .
Vitamin, Japan and soybean oil Wako as the fat sources, and gelatinized potato starch ŽMatsuya Chemical Industry, Japan and dextrin Wako as the digestible carbohydrate. Ž .
Ž Ž . Ž ..
sources. Four diets contained combinations of two levels 35% LP and 50% HP of a
Ž . Ž Ž .
balanced amino acid protein casein:gelatins6:1 and two levels 10% LF and 20% ŽHF.. of fat pollock oil:soybean oilŽ s2:3 . The ratio of casein to gelatin was in.
Ž .
accordance with an optimal value for carp Murai et al., 1984 . The other two diets
Ž .
contained 50% imbalanced amino acid protein IMB-HP, casein:gelatins1:1 and two
Ž Ž . Ž ..
levels of fat 10% LF and 20% HF . The ingredients were thoroughly mixed,
Ž .
moistened by addition of hot water 508C , and made into pellets using a garlic squeezer. The pellets were freeze-dried and stored aty208C until fed to the fish.
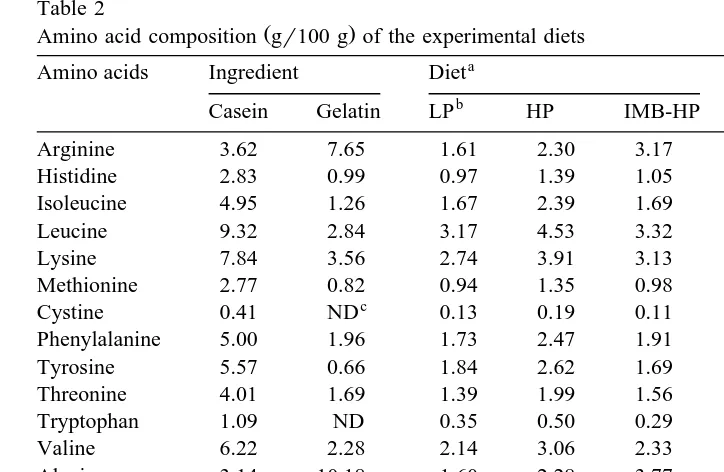
The amino acid composition of the dietary protein sources and of the experimental
Ž .
diets are shown in Table 2. The EAA index EAAI based on the EAA composition of
Ž .
trout eggs Suyama and Ogino, 1958 were estimated at 93 for the LP and HP diets, and 73 for the IMB-HP diets. Although the EAAI of the IMB-HP diets was lower than the
Table 1
Formulation and proximate composition of the experimental diets a
Diet LPLF LPHF HPLF HPHF IMB-HPLF IMB-HPHF
Ingredients
Ž .
Casein vitamin free 32.29 32.29 46.13 46.13 26.91 26.91
Gelatin 5.74 5.74 8.20 8.20 28.70 28.70
Pollock visceral oil 4.00 8.00 4.00 8.00 4.00 8.00
Soybean oil 6.00 12.00 6.00 12.00 6.00 12.00
a-Starch 15.00 15.00 15.00 15.00 15.00 15.00
Dextrin 16.00 16.00 4.67 4.67 3.39 3.39
b
Vitamin mix 2.00 2.00 2.00 2.00 2.00 2.00
b
Mineral mix 4.00 4.00 4.00 4.00 4.00 4.00
Cellulose 14.97 4.97 10.00 – 10.00 –
( )
Proximate composition dry matter basis
Ž .
Crude protein N=6.25% 36.5 36.7 52.8 52.2 55.5 55.0
Ž .
Gross energy KJrg 21.6 24.6 22.6 25.3 21.9 24.4
a
LP; low protein with balanced amino acid diet, HP; high protein with balanced amino acid diet, IMB-HP; high protein with imbalanced amino acid diet, LF; low fat diet, HF; high fat diet.
b Ž .
Same mixtures as previously reported Yamamoto et al., 1998 .
c Ž .
Table 2
Ž .
Amino acid composition gr100 g of the experimental diets a
Amino acids Ingredient Diet ArE ratio of diet
b
Casein Gelatin LP HP IMB-HP LP and HP IMB-HP
Arginine 3.62 7.65 1.61 2.30 3.17 86 149
Histidine 2.83 0.99 0.97 1.39 1.05 52 50
Isoleucine 4.95 1.26 1.67 2.39 1.69 89 80
Leucine 9.32 2.84 3.17 4.53 3.32 170 156
Lysine 7.84 3.56 2.74 3.91 3.13 147 147
Methionine 2.77 0.82 0.94 1.35 0.98 50 46
c
Cystine 0.41 ND 0.13 0.19 0.11 7 5
Phenylalanine 5.00 1.96 1.73 2.47 1.91 93 90
Tyrosine 5.57 0.66 1.84 2.62 1.69 98 80
Threonine 4.01 1.69 1.39 1.99 1.56 74 73
Tryptophan 1.09 ND 0.35 0.50 0.29 19 14
Valine 6.22 2.28 2.14 3.06 2.33 115 110
Alanine 3.14 10.18 1.60 2.28 3.77
Aspartic acid 6.60 5.45 2.44 3.49 3.34
Glutamic acid 21.73 9.55 7.56 10.81 8.59
Glycine 1.82 32.33 2.44 3.49 9.77
Proline 10.51 12.83 4.13 5.90 6.51
Hydroxyproline ND 10.11 0.58 0.83 2.90
Serine 5.44 3.16 1.94 2.77 2.37
d
EAA index 93.9 28.4 93.1 93.1 73.2
a
Amino acid levels of the diets were calculated based on the analytical values of casein and gelatin. b
LP; low protein with balanced amino acid diet, HP; high protein with balanced amino acid diet, IMB-HP; high protein with imbalanced amino acid diet.
c
Not detected.
d Ž
Essential amino acid index based on amino acid composition of rainbow trout egg Suyama and Ogino,
.
1958 .
balanced amino acid diets, the IMB-HP diets contained similar levels of individual EAA to those of the LP diets except for arginine.
2.2. Fish and feeding
Ž .
Fingerling rainbow trout Oncorhynchus mykiss with a mean weight of 3.1 grfish were transported from the Shiga Prefectural Samegai Trout Farm, Shiga, Japan, to the Inland Station of the National Research Institute of Aquaculture, Mie, Japan. The fish
Ž .
were reared for 6 weeks with a commercial trout feed Nippon Formula Feed, Japan at
Ž .
158C. The fish were then sorted by hand to an uniform size approximately 8 grfish , Ž
and 30 fish were allotted into each of 12 polyvinyl chloride tanks 50=20=30 cm, .
holding 20 l of water , and fed a commercial feed for two weeks for acclimation to the Ž new rearing condition. The tanks were continuously supplied with well water 15"
.
experimental diets to satiation twice per day, 6 days per week for 6 weeks. The fish were weighed every 2 weeks to follow the overall growth.
2.3. Sampling
Ž After the 6-week feeding trial, the fish were weighed and four fish from each tank 8
.
fishrtreatment were sampled and stored at y208C for subsequent analyses of the proximate and the amino acid composition of the whole body. The remaining fish were fed their respective diets for another 2 days. In rainbow trout fed intact protein diets to
Ž . Ž .
satiation, Nose 1973 and Walton and Wilson 1986 reported that plasma FAA attained maximum levels at 12 h after feeding and declined to the fasting levels by 48 h. By
Ž
contrast, FAA in trout liver did not show distinct postprandial changes Walton and .
Wilson, 1986 . Thus, the fish in this study were then starved for 48 h, fed once again the diets to satiation, and blood and tissue samples for FAA analysis were collected at 12 h
Ž .
after the last feeding. Three fish from each tank 6 fishrtreatment were anesthetized in
Ž .
0.01% ethyl 3-aminobenzoate methanesulfonic acid Aldrich Chemical, USA . Blood was immediately withdrawn from the caudal vein–artery complex and plasma samples for determination of FAA were prepared according to the procedures described in
Ž .
Yamamoto et al. 1998 . The fish were then placed into liquid nitrogen and stored at
y808C for up to 1 week until extraction of FAA from tissues.
2.4. Analysis
Proximate analysis of the diets and the whole bodies were carried out using the
Ž .
AOAC method slightly modified by Akiyama et al. 1984 . Amino acid composition of the protein sources and the whole bodies was determined after acid hydrolysis in 6 N
Ž .
HCl for 22 h at 1108C, as described in Yamamoto et al. 1997 . Cystine and tryptophan
Ž .
in the protein sources were analyzed according to the methods of Moore 1963 and
Ž .
Penke et al. 1974 , respectively. The partially thawed–frozen fish were dissected and
Ž .
whole brain and liver, and a portion of dorsal white muscle approximately 500 mg were taken for FAA analysis. FAA in tissue samples were extracted with a perchloric
Ž .
acid solution according to the method of Ogata and Murai 1994 . FAA levels were
Ž .
determined individually by an automatic amino acid analyzer L-8500 Hitachi, Japan
Ž .
with a ninhydrin reagent and lithium buffer system Yamamoto et al., 1998 .
Ž .
Significance P-0.05 of treatment means of growth performance parameters, whole body proximate and amino acid compositions, and tissue FAA levels, were compared using one-way ANOVA followed by Duncan’s new multiple range test ŽWakabayashi, 1984 ..
3. Results
3.1. Growth and feed performance
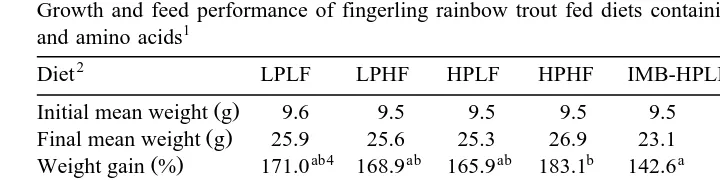
The results of the 6-week feeding trial are shown in Table 3. Percentage weight gain
Ž .
Table 3
Growth and feed performance of fingerling rainbow trout fed diets containing different levels of protein, fat and amino acids1
2 3
Diet LPLF LPHF HPLF HPHF IMB-HPLF IMB-HPHF Pooled SEM
Ž .
Initial mean weight g 9.6 9.5 9.5 9.5 9.5 9.5 0.18
Ž .
Final mean weight g 25.9 25.6 25.3 26.9 23.1 25.6 2.48
ab4 ab ab b a ab
Ž .
Weight gain % 171.0 168.9 165.9 183.1 142.6 169.4 9.87
a bc d e ab cd
Ž .
Feed efficiency % 99.6 115.1 129.3 147.2 109.4 125.1 3.00
b c b b a a
Ž .
N retention % 42.7 47.8 41.3 42.9 30.5 32.2 1.08
e d b a cd bc
Ž .
Feed consumption % 2.20 1.89 1.67 1.54 1.81 1.75 0.030
Ž .
Mortality % 0 0 0 0 0 0
1
Average value of duplicate groups containing 30 fish each reared for 6 weeks at 158C. 2
LP; low protein with balanced amino acid diet, HP; high protein with balanced amino acid diet, IMB-HP; high protein with imbalanced amino acid diet, LF; low fat diet, HF; high fat diet.
3
Standard error of the means.
4 Ž .
Values in the same row with the same superscript are not different P)0.05 .
Ž .
treatment groups except for the IMB-HPLF diet group P-0.05 . Feed efficiency was
Ž .
higher P-0.05 in the HF diet group than the LF group fed the same protein level or amino acid profile diet. Although the feed efficiency of the IMB-HPLF group was
Ž .
higher P-0.05 than the LPLF group, the efficiency of the IMB group was lower ŽP-0.05 than the HP group fed the same fat level diet. Percentage dietary nitrogen. retained also showed a higher value in the HF group than in the LF group. Daily feed consumption rates were less in the high protein or fat diet groups. The feed consumption
Ž .
of the IMB group was higher P-0.05 than the HP group fed the same fat level diet.
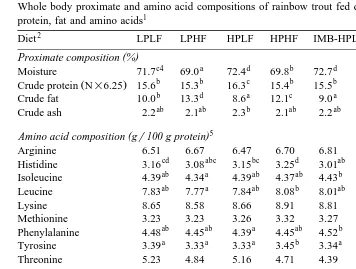
3.2. Whole body proximate and amino acid compositions
The proximate and the amino acid compositions of the whole body are shown in
Ž .
Table 4. The protein content of the HPLF group was higher P-0.05 , and that of the
Ž .
IMB-HPHF group was lower P-0.05 , than the other groups. The HF diet group
Ž .
showed higher whole body fat level P-0.05 than the LF diet group. The fat content
Ž .
of the LP diet group was higher P-0.05 than the HP diet group fed the same fat level diet.
Although differences in the levels of certain amino acids, such as histidine and
Ž .
glycine, in whole body protein were significant P-0.05 among the dietary treat-ments, the actual differences were small.
3.3. Plasma free amino acids
Levels of FAA and related compounds in plasma are shown in Table 5.
Ž .
Increment of dietary protein level LPLF vs. HPLF, LPHF vs. HPHF increased ŽP-0.05 the levels of most EAA, and also of certain non-essential amino acids. ŽNEAA such as asparagine and glycine. So the total EAA and the NEAA levels of the.
Ž .
Table 4
Whole body proximate and amino acid compositions of rainbow trout fed diets containing different levels of protein, fat and amino acids1
2 3
Diet LPLF LPHF HPLF HPHF IMB-HPLF IMB-HPHF Pooled SEM
( ) Proximate composition %
c4 a d b d b
Moisture 71.7 69.0 72.4 69.8 72.7 70.1 0.18
b b c b b a
Ž .
Crude protein N=6.25 15.6 15.3 16.3 15.4 15.5 14.6 0.14
b d a c a cd
Crude fat 10.0 13.3 8.6 12.1 9.0 12.6 0.25
ab ab b ab ab a
Crude ash 2.2 2.1 2.3 2.1 2.2 2.1 0.05
5
( )
Amino acid composition gr100 g protein
Arginine 6.51 6.67 6.47 6.70 6.81 6.62 0.094
cd abc bc d ab a
Histidine 3.16 3.08 3.15 3.25 3.01 2.94 0.041
ab a ab ab b ab
Isoleucine 4.39 4.34 4.39 4.37 4.43 4.39 0.017
ab a ab b ab ab
Leucine 7.83 7.77 7.84 8.08 8.01 7.91 0.078
Lysine 8.65 8.58 8.66 8.91 8.81 8.58 0.123
Methionine 3.23 3.23 3.26 3.32 3.27 3.27 0.041
ab ab a ab b ab
Phenylalanine 4.48 4.45 4.39 4.45 4.52 4.45 0.031
a a a b a a
Tyrosine 3.39 3.33 3.33 3.45 3.34 3.35 0.021
Threonine 5.23 4.84 5.16 4.71 4.39 4.66 0.242
Valine 5.00 4.87 5.02 4.90 4.85 4.97 0.070
Alanine 6.70 7.09 6.56 6.98 7.15 6.94 0.219
Aspartic acid 9.70 9.63 9.95 9.37 9.29 9.71 0.366
Glutamic acid 13.76 13.51 13.95 13.50 13.73 13.62 0.144
a c a a ab bc
Glycine 7.39 8.01 7.50 7.40 7.63 7.88 0.102
Proline 4.71 4.43 4.50 4.42 4.57 4.48 0.176
Hydroxyproline 1.26 1.48 1.29 1.10 1.26 1.53 0.218
Serine 4.15 4.37 4.12 4.40 4.63 4.45 0.190
bc abc c abc ab a
Taurine 0.50 0.39 0.52 0.38 0.35 0.31 0.046
1 Ž .
Average value of two pooled samples four fishrsample from duplicate groups. 2
LP; low protein with balanced amino acid diet, HP; high protein with balanced amino acid diet, IMB-HP; high protein with imbalanced amino acid diet, LF; low fat diet, HF; high fat diet.
3
Standard error of the means.
4 Ž .
Values in the same row with the same superscript are not different P)0.05 . 5
Tryptophan and cystine contents were not determined.
Ž .
Dietary fat levels LPLF vs. LPHF, HPLF vs. HPHF, IMB-HPLF vs. IMB-HPHF
Ž .
did not markedly affect the plasma FAA levels. However, higher levels P-0.05 of
Ž .
aromatic amino acids phenylalanine and tyrosine were found in the HF diet group than
Ž .
the LF diet group. In addition, the taurine level of the HF group was lower P-0.05 than the LF group.
Individual free EAA levels except for arginine, of the IMB diet group were lower ŽP-0.05 than those of the HP group, and were generally lower than the levels of the.
Ž .
LP group. Taurine level of the IMB diet group was also lower P-0.05 than the HP group fed the same fat level diet. The levels of serine, glycine and hydroxyproline of the
Ž .
IMB diet group were higher P-0.05 than the HP diet group, so that the total NEAA
Ž .
Table 5
Ž .
Levels of free amino acids and related compounds nMrml in plasma of rainbow trout fed diets containing different levels of protein, fat and amino acids1
2 3
Diet LPLF LPHF HPLF HPHF IMB-HPLF IMB-HPHF Pooled SEM
b4 a c b ab a
Taurine 142 61 201 143 87 38 18.7
ab a b b a b
Aspartic acid 10 7 12 10 7 11 0.8
a a b b a a
Threonine 253 202 419 400 293 252 30.2
a a a a b b
Serine 221 264 262 288 440 438 21.6
a a b b a a
Asparagine 494 547 772 753 517 559 42.7
ab a c b a ab
Glutamic acid 69 62 95 78 57 71 4.8
a ab b b ab b
Glutamine 304 346 401 411 342 390 24.2
ab a ab bc d cd
Glycine 1199 996 1496 1583 2324 2068 167.3
ab a ab ab b ab
Alanine 434 398 473 479 538 461 37.9
b b b b a b
Citruline 37 38 42 42 30 40 2.1
b b c c a a
Valine 750 682 915 960 467 506 39.6
bc b b c b a
Cystine 8 6 6 9 5 2 0.8
b b b b a a
Methionine 192 213 214 209 130 148 14.5
5
Cystathionine ND ND ND ND ND ND
b b c c a a
Isoleucine 285 249 362 379 156 153 17.1
b b c c a a
Leucine 518 468 662 681 300 297 29.1
b d b c a b
Tyrosine 110 220 109 148 57 94 11.7
ab de cd e a bc
Phenylalanine 137 196 172 199 119 152 8.0
b a ab a ab ab
b-Alanine 55 36 44 36 46 47 3.9
g-Aminobutyric acid ND ND ND ND ND ND
Tryptophan 16a 18a 28b 31b 10a 12a 2.7
Ethanolamine ND ND ND ND ND ND
a a a a a b
Ammonia 225 209 222 220 211 249 7.9
a a a a b c
Ornithine 11 9 13 15 25 35 3.3
a a b b a a
Lysine 194 190 284 291 210 216 21.4
bc b d cd a a
Histidine 186 177 233 211 124 128 10.2
Anserine ND ND ND ND ND ND
Carnosine ND ND ND ND ND ND
a a a a b b
Arginine 48 54 76 76 122 137 9.9
a a a a b b
Hydroxyproline 572 578 763 758 2193 1962 112.4
ab a b bc c c
Proline 495 333 576 771 928 1059 95.6
6 b b c c a a
EAAqCqT 2765 2694 3450 3585 1970 2115 145.6
6 a a b b c c
NEAA 3784 3504 4866 5203 7346 7114 328.8
1 Ž .
Average value of 6 fish three fishrgroup from duplicate groups. 2
LP; low protein with balanced amino acid diet, HP; high protein with balanced amino acid diet, IMB-HP; high protein with imbalanced amino acid diet, LF; low fat diet, HF; high fat diet.
3
Standard error of the means.
4 Ž .
Values in the same row with the same superscript are not different P)0.05 . 5
Not detected. 6
EAAqCqT; total amount of 10 essential amino acids, cystine and tyrosine, NEAA; total amount of non-essential amino acids including hydroxyproline.
3.4. LiÕer free amino acids
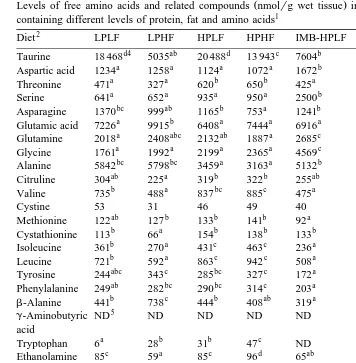
The levels of FAA and related compounds in liver are shown in Table 6.
Ž .
In liver, increment of dietary protein level increased P-0.05 the levels of several Ž
Table 6
Ž .
Levels of free amino acids and related compounds nmolrg wet tissue in liver of rainbow trout fed diets containing different levels of protein, fat and amino acids1
2 3
Diet LPLF LPHF HPLF HPHF IMB-HPLF IMB-HPHF Pooled SEM
d4 ab d c b a
Taurine 18 468 5035 20 488 13 943 7604 2218 1006.4
a a a a b c
Aspartic acid 1234 1258 1124 1072 1672 2008 102.9
a a b b a a
Threonine 471 327 620 650 425 433 49.0
a a a a b b
Serine 641 652 935 950 2500 2753 105.4
bc ab b a b c
Asparagine 1370 999 1165 753 1241 1652 131.5
a b a a a a
Glutamic acid 7226 9915 6408 7444 6916 7753 607.1
a abc ab a c bc
Glutamine 2018 2408 2132 1887 2685 2612 169.3
a a a a c b
Glycine 1761 1992 2199 2365 4569 3419 288.5
bc bc a a b c
Alanine 5842 5798 3459 3163 5132 6130 285.6
ab a b b ab ab
Citruline 304 225 319 322 255 291 27.4
b a bc c a a
Valine 735 488 837 885 475 480 37.0
Cystine 53 31 46 49 40 36 6.7
ab b b b a a
Methionine 122 127 133 141 92 94 9.9
b a b b b b
Cystathionine 113 66 154 138 133 124 13.9
b a c c a a
Isoleucine 361 270 431 463 236 222 17.4
b a c c a a
Leucine 721 592 863 942 508 491 34.4
abc c bc c a ab
Tyrosine 244 343 285 327 172 217 31.9
ab bc bc c a a
Phenylalanine 249 282 290 314 203 222 18.9
b-Alanine 441b 738c 444b 408ab 319a 467b 33.8
5
g-Aminobutyric ND ND ND ND ND ND
acid
a b b c a
Tryptophan 6 28 31 47 ND 10 3.9
c a c d ab bc
Ethanolamine 85 59 85 96 65 75 3.6
a a c c c b
Ammonia 3256 3253 4148 3998 4308 3598 108.6
a a a ab ab b
Ornithine 102 109 116 133 156 181 16.8
ab a b b ab ab
Lysine 438 375 513 529 449 447 41.1
b b b b a a
Histidine 1135 1132 1097 1149 822 895 37.7
Anserine ND ND ND ND ND ND
Carnosine ND ND ND ND ND ND
Arginine 130 125 129 133 104 114 13.8
a a a a c b
Hydroxyproline 555 483 661 717 4024 2653 341.0
ab a abc bc c d
Proline 1487 1088 1773 2085 2468 3734 250.4
6 bc ab cd d a a
EAAqCqT 4778 4100 5344 5687 3593 3666 233.9
6 bc c a ab d d
NEAA 23 399 24 901 19 988 20 687 31 239 33 213 961.4
1 Ž .
Average value of 6 fish three fishrgroup from duplicate groups. 2
LP; low protein with balanced amino acid diet, HP; high protein with balanced amino acid diet, IMB-HP; high protein with imbalanced amino acid diet, LF; low fat diet, HF; high fat diet.
3
Standard error of the means.
4 Ž .
Values in the same row with the same superscript are not different P)0.05 . 5
Not detected. 6
EAAqCqT; total amount of 10 essential amino acids, cystine and tyrosine, NEAA; total amount of non-essential amino acids including hydroxyproline.
.
valine , however, the levels of methionine, aromatic amino acids, histidine, and arginine
Ž .
were not different P)0.05 . Due to the decrease of NEAA such as alanine, the total
Ž .
Although the levels of certain FAA were affected by dietary fat level, the influence of the treatments was not clear. The levels of aromatic amino acids of the HF group seemed higher than the LF group, however, the differences were not significant. Taurine
Ž .
level of the HF group was markedly lower P-0.05 than the LF group.
Table 7
Ž .
Levels of free amino acids and related compounds nmolrg wet tissue in dorsal white muscle of rainbow trout fed diets containing different levels of protein, fat and amino acids1
2 3
Diet LPLF LPHF HPLF HPHF IMB-HPLF IMB-HPHF Pooled SEM
e4 cd d c b a
Taurine 873 682 734 659 524 360 23.2
b b b c a a
Aspartic acid 463 595 612 886 145 171 66.3
ab a c bc a a
Threonine 1004 757 1573 1275 820 863 118.5
bc c a ab bc c
Serine 1363 1710 917 1177 1384 1633 109.8
b c d d a a
Asparagine 6752 8866 10 471 10 226 3240 3358 384.6
c bc c c a b
Glutamic acid 1163 1106 1239 1236 724 943 57.4
ab a c bc a bc
Glutamine 1158 1114 1392 1310 973 1317 60.5
a b ab c a a
Glycine 26 331 30 514 28 143 33 268 27 535 27 339 813.1
b b a a a a
Alanine 4042 3754 2937 2585 2216 2375 261.2
b b b ab a ab
Citruline 240 237 232 197 144 197 24.3
c b c c a a
Valine 526 424 572 601 281 307 30.2
a a b a a a
Cystine 40 37 128 76 36 28 15.2
a b a a a a
Methionine 95 127 89 99 84 87 7.0
ab b c d a a
Cystathionine 58 66 112 160 19 18 13.1
b b c c a a
Isoleucine 194 157 243 243 80 84 13.5
bc b c c a a
Leucine 372 304 443 445 170 170 25.1
b c b b a b
Tyrosine 85 188 78 91 33 71 9.3
ab d bc c a bc
Phenylalanine 97 151 114 123 87 104 7.0
b-Alanine 392d 298c 387d 392d 139a 218b 21.7
5
g-Aminobutyric ND ND ND ND ND ND
acid
Tryptophan ND ND ND ND ND ND
Ethanolamine ND ND ND ND ND ND
c c b b b a
Ammonia 6159 6154 5029 5071 5173 4861 57.5
d ab a a bc c
Ornithine 70 27 18 16 43 48 6.8
bc ab c c a a
Lysine 806 621 1146 1030 283 404 111.0
b b c bc a a
Histidine 8530 8322 10 092 9152 4835 3599 419.4
c b a a b a
Anserine 12 886 10 948 9638 9265 10 859 9051 292.5
b a a a b c
Carnosine 258 130 139 119 241 553 32.8
a a a a b c
Arginine 18 14 19 11 90 192 9.7
a a a a b c
Hydroxyproline 5978 7859 5932 6554 11 338 13 306 616.0
b a b b a ab
Proline 3426 2042 3443 3990 1964 2807 414.2
6 bc b d c a a
EAAqCqT 12 212 11 164 14 565 13 181 6950 5952 428.8
6 a c bc d a ab
NEAA 51 618 57 792 55 504 60 973 50 580 52 757 1056.4
1 Ž .
Average value of 6 fish three fishrgroup from duplicate groups. 2
LP; low protein with balanced amino acid diet, HP; high protein with balanced amino acid diet, IMB-HP; high protein with imbalanced amino acid diet, LF; low fat diet, HF; high fat diet.
3
Standard error of the means.
4 Ž .
Values in the same row with the same superscript are not different P)0.05 . 5
Not detected. 6
In the IMB diet group, levels of most EAA, except for lysine and arginine, were
Ž .
lower P-0.05 than those of the HP group. On the other hand, levels of most NEAA of the IMB group were higher than the HP group. Thus, compared with the HP group,
Ž .
total EAA level of the IMB group was lower P-0.05 and total NEAA level was
Ž .
higher P-0.05 .
3.5. White muscle free amino acids
The levels of FAA and related compounds in dorsal white muscle are shown in Table 7. In white muscle, although the levels of methionine and aromatic amino acids of the
Ž .
HPHF group were lower P-0.05 than those of the LPHF group, total EAA level of
Ž .
the HP group was higher P-0.05 than that of the LP group fed the same fat level diet, due to the increase of the other EAA levels. Likewise, the total NEAA level of the
Ž .
HP group was higher P-0.05 than the LP group.
As the individual EAA levels of the HF group tended to be lower than the LF group,
Ž .
the total EAA level of the HPHF group was lower P-0.05 than the HPLF group.
Ž .
Increasing the dietary fat level increased P-0.05 the levels of aromatic amino acids
Ž .
among the LP groups, however, the effect was insignificant P)0.05 among the HP
Ž .
groups. The total NEAA level of the HF group was higher P-0.05 than the LF group due mainly to the increase of glycine level. However, this glycine increase was not observed among the IMB diet groups. The taurine level of the HF group was lower ŽP-0.05 than the LF group..
Most of the EAA levels of the IMB diet group were markedly lower than the HP group, and the total EAA level was nearly half the level of the LP group. Compared with the HP group, the levels of individual NEAA except for serine and hydroxyproline of the IMB diet group also tended to decrease, so that the total NEAA level was lower ŽP-0.05 than the HP group fed the same fat level diet..
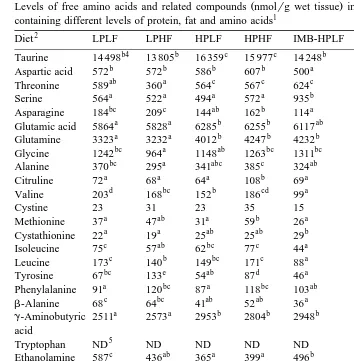
3.6. Brain free amino acids
The levels of FAA and related compounds in brain are shown in Table 8.
As the increment of dietary protein level tended to increase individual FAA levels among the HF groups, the total EAA and the NEAA levels of the HPHF group were
Ž .
higher P-0.05 than the LPHF group. However, such an influence of dietary protein
Ž .
level was not different P)0.05 among the LF diet groups.
Ž .
The aromatic amino acid levels of the HF group were higher P-0.05 than the LF group. The taurine level of the HF group seemed slightly lower than the LF group,
Ž .
however, the influence was significant P-0.05 only among the IMB diet groups. Although the levels of certain EAA such as branched-chain amino acids and lysine of
Ž .
Table 8
Ž .
Levels of free amino acids and related compounds nmolrg wet tissue in brain of rainbow trout fed diets containing different levels of protein, fat and amino acids1
2 3
Diet LPLF LPHF HPLF HPHF IMB-HPLF IMB-HPHF Pooled SEM
b4 b c c b a
Taurine 14 498 13 805 16 359 15 977 14 248 12 967 274.9
b b b b a a
Aspartic acid 572 572 586 607 500 480 19.5
ab a c c c bc
Threonine 589 360 564 567 624 547 30.7
a a a a b b
Serine 564 522 494 572 935 1061 45.0
bc c ab b a b
Asparagine 184 209 144 162 114 160 13.0
a a b b ab a
Glutamic acid 5864 5828 6285 6255 6117 5844 111.6
a a b b b c
Glutamine 3323 3232 4012 4247 4232 4853 111.7
bc a ab bc bc c
Glycine 1242 964 1148 1263 1311 1415 73.1
bc a abc c ab bc
Alanine 370 295 341 385 324 353 16.1
a a a b a a
Citruline 72 68 64 108 69 75 9.6
d bc b cd a a
Valine 203 168 152 186 99 122 9.3
Cystine 23 31 23 35 15 18 8.5
a ab a b a a
Methionine 37 47 31 59 26 31 6.8
a a ab ab b ab
Cystathionine 22 19 25 25 29 24 2.3
c ab bc c a ab
Isoleucine 75 57 62 77 44 46 5.3
c b bc c a a
Leucine 173 140 149 171 88 108 8.4
bc e ab d a cd
Tyrosine 67 133 54 87 46 78 5.0
a bc a bc ab c
Phenylalanine 91 120 87 118 103 122 5.5
b-Alanine 68c 64bc 41ab 52ab 36a 53ab 7.6
a a b b b b
g-Aminobutyric 2511 2573 2953 2804 2948 3005 70.7
acid
5
Tryptophan ND ND ND ND ND ND
c ab a a b c
Ethanolamine 587 436 365 399 496 588 28.3
ab a ab b a b
Ammonia 1921 1762 2126 2305 1695 2322 140.8
abc a ab bc ab c
Ornithine 30 24 27 38 28 40 3.6
bc ab c d a a
Lysine 291 249 304 360 216 216 14.5
ab a ab ab a b
Histidine 822 701 1009 1010 707 1110 109.2
Anserine ND ND ND ND ND ND
a a ab ab c b
Carnosine 2186 2156 2292 2326 2837 2427 71.7
a a a b b c
Arginine 87 84 93 110 123 141 5.1
a a a a b b
Hydroxyproline 381 447 403 425 1316 1401 42.2
ab a ab bc cd d
Proline 218 164 225 256 332 382 26.5
6 abc a abc c ab bc
EAAqCqT 2341 2048 2518 2741 2077 2567 152.7
6 ab a b b c c
NEAA 12 973 12 141 13 728 14 172 15 333 15 762 388.8
1 Ž .
Average value of 6 fish three fishrgroup from duplicate groups. 2
LP; low protein with balanced amino acid diet, HP; high protein with balanced amino acid diet, IMB-HP; high protein with imbalanced amino acid diet, LF; low fat diet, HF; high fat diet.
3
Standard error of the means.
4 Ž .
Values in the same row with the same superscript are not different P)0.05 . 5
Not detected. 6
EAAqCqT; total amount of 10 essential amino acids, cystine and tyrosine, NEAA; total amount of non-essential amino acids including hydroxyproline.
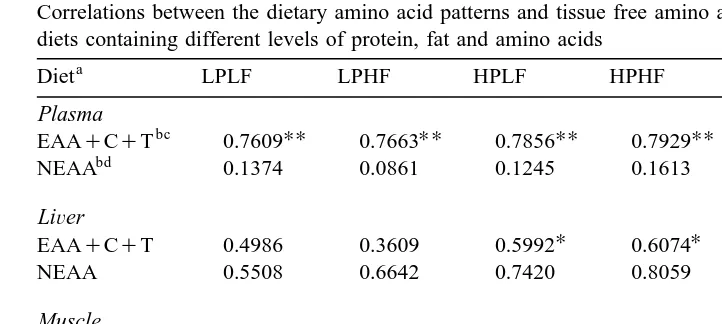
3.7. Relationship in amino acid leÕels between diet and tissue
The relationships between dietary amino acid patterns and tissue FAA patterns are
Ž .
Table 9
Correlations between the dietary amino acid patterns and tissue free amino acid patterns of rainbow trout fed diets containing different levels of protein, fat and amino acids
a
Diet LPLF LPHF HPLF HPHF IMB-HPLF IMB-HPHF
Plasma
UU UU UU UU UU UU
bc
EAAqCqT 0.7609 0.7663 0.7856 0.7929 0.7526 0.7548
UU UU
bd
NEAA 0.1374 0.0861 0.1245 0.1613 0.9323 0.9229
LiÕer
U U
EAAqCqT 0.4986 0.3609 0.5992 0.6074 0.4469 0.3953
NEAA 0.5508 0.6642 0.7420 0.8059 0.2303 y0.0071
Muscle
EAAqCqT y0.2000 y0.2176 y0.1993 y0.1922 y0.2470 y0.2118
U U
NEAA 0.0084 y0.0357 y0.0116 0.0112 0.8912 0.9013
Brain
EAAqCqT 0.0216 y0.0179 y0.0598 y0.0378 y0.0690 y0.1491
U U U
NEAA 0.8132 0.8051 0.8151 0.8156 0.0894 0.0910
a
LP; low protein with balanced amino acid diet, HP; high protein with balanced amino acid diet, IMB-HP; high protein with imbalanced amino acid diet, LF; low fat diet, HF; high fat diet.
b
EAAqCqT; 10 essential amino acids, cystine and tyrosine, NEAA; non-essential amino acids excluding hydroxyproline.
c
Tryptophan is excluded from calculation when free tryptophan is not detected in the tissue. d
In calculation, free asparagine and glutamine levels are included in free aspartic acid and glutamic acid levels, respectively.
U
P-0.05,UUP-0.01.
Ž .
EAA patterns. In liver, the correlations were significant P-0.05 only in the EAA patterns of the HP groups. In muscle and brain, the correlations in EAA patterns were very low. High correlations between dietary and tissue NEAA patterns were observed in plasma and muscle of the IMB groups, and in brain of the balanced amino acid diet groups.
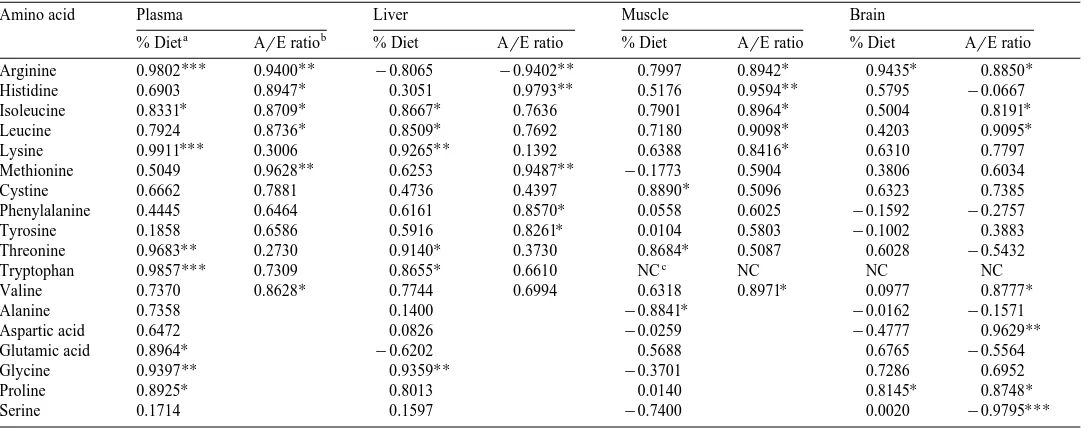
The correlations between the levels of certain amino acids in the diets and tissue through the treatments are given in Table 10. In plasma and liver, high correlations were found for several EAA such as isoleucine, lysine and threonine. In plasma, the dietary
Ž .
arginine levels showed a strong positive correlation P-0.001 to the tissue free
Ž .
arginine levels, however, the correlation was negative P-0.05 in liver. In muscle and brain, the correlations between dietary and tissue amino acid levels were significant for only one or two amino acids. Among NEAA, relatively high correlations were found for glycine in plasma and liver, and proline in plasma and brain.
When the tissue levels of certain EAA in all the treatments were compared with the
Ž .
()
Correlations between levels of certain amino acids in the diets and tissues for all dietary treatments
Amino acid Plasma Liver Muscle Brain
a b
% Diet ArE ratio % Diet ArE ratio % Diet ArE ratio % Diet ArE ratio
UUU UU UU U U U
Arginine 0.9802 0.9400 y0.8065 y0.9402 0.7997 0.8942 0.9435 0.8850
U UU UU
Histidine 0.6903 0.8947 0.3051 0.9793 0.5176 0.9594 0.5795 y0.0667
U U U U U
Isoleucine 0.8331 0.8709 0.8667 0.7636 0.7901 0.8964 0.5004 0.8191
U U U U
Leucine 0.7924 0.8736 0.8509 0.7692 0.7180 0.9098 0.4203 0.9095
UUU UU U
Lysine 0.9911 0.3006 0.9265 0.1392 0.6388 0.8416 0.6310 0.7797
UU UU
Methionine 0.5049 0.9628 0.6253 0.9487 y0.1773 0.5904 0.3806 0.6034
U
Cystine 0.6662 0.7881 0.4736 0.4397 0.8890 0.5096 0.6323 0.7385
U
Phenylalanine 0.4445 0.6464 0.6161 0.8570 0.0558 0.6025 y0.1592 y0.2757
U
Tyrosine 0.1858 0.6586 0.5916 0.8261 0.0104 0.5803 y0.1002 0.3883
UU U U
Threonine 0.9683 0.2730 0.9140 0.3730 0.8684 0.5087 0.6028 y0.5432
Tryptophan 0.9857UUU 0.7309 0.8655U 0.6610 NCc NC NC NC
U U U
Valine 0.7370 0.8628 0.7744 0.6994 0.6318 0.8971 0.0977 0.8777
U
Alanine 0.7358 0.1400 y0.8841 y0.0162 y0.1571
UU
Aspartic acid 0.6472 0.0826 y0.0259 y0.4777 0.9629
U
Glutamic acid 0.8964 y0.6202 0.5688 0.6765 y0.5564
UU UU
Glycine 0.9397 0.9359 y0.3701 0.7286 0.6952
U U U
Proline 0.8925 0.8013 0.0140 0.8145 0.8748
UUU
Serine 0.1714 0.1597 y0.7400 0.0020 y0.9795
a
Based on percentage amino acid content in the diets. b
Based on ArE ratio of the diets. c
Not calculated because free tryptophan was not detected in the tissues. U
4. Discussion
4.1. Growth performance and whole body composition
In several fish species, it is known that supplying additional fat to the diet improves Ž
feed efficiency and increases body fat content Cowey et al., 1975; Takeuchi et al., .
1978b, 1991 . In this study, we also observed that, in rainbow trout the feed efficiency and the whole body fat content of the HF group were higher than in the LF diet group,
Ž .
irrespective of the profiles of dietary amino acids. As Takeuchi et al. 1978a reported, we also found that increasing fat in the high protein diets slightly improved the percentage weight gains even among the IMB-HP diet groups. On the other hand, the feed consumption rate of the IMB-HP diet group was higher than in the balanced HP
Ž .
diet group fed the same fat level diet. Murai et al. 1984 reported that the feed consumption of carp tended to increase as the dietary gelatin to casein ratio increased. Accordingly, the fish fed the IMB-HF diet in this study showed identical growth to the balanced amino acid diet groups within the 6-week feeding period, both by increasing their feed intake and by the protein sparing effect of supplemental dietary fat. However, the whole body protein content of the IMB-HPHF group was lower than that of the other
Ž .
groups. Takeuchi et al. 1978b observed lower body protein content and higher fat accumulation into the viscera in trout fed high fat diets than in trout fed low fat diets. The IMB-HPHF group in this study may have also deposited excess energy supplied from imbalanced amino acids and supplemental fat in the diet as visceral fat.
In this study, the whole body amino acid composition of rainbow trout fed various dietary compositions did not show marked differences. This is, in a way, expected because body proteins are synthesized based on the genetic information from DNA, so that amino acid composition of specific body proteins is the same irrespective of dietary treatments. Also, it has been reported that the whole body amino acid compositions are
Ž
similar among fish species Wilson, 1989; Wilson and Cowey, 1985; Mohanty and .
Kaushik, 1991 . The whole body amino acid composition of carp is not influenced by
Ž .
dietary protein and fat levels Schwarz and Kirchgessner, 1988 . Dabrowska and Wojno Ž1984 found that the amino acid composition of trout muscle fed various combinations. of protein sources were almost identical among the treatments. The small differences of certain amino acid levels between the dietary treatments found in this study may be due to the differences in the tissue levels of free amino acids. For example, the lower whole body histidine content of the IMB diet groups compared to the balanced amino acid diet groups may have resulted from marked differences in free histidine content in the muscle.
4.2. Free amino acid profiles of trout tissues
As mentioned in the introduction, many reports in fish have discussed the relationship between dietary and tissue amino acid patterns, and the results have revealed a high correlation between dietary EAA patterns and free EAA patterns in blood or its constituents. In other tissues, the correlation in EAA patterns was found to be low with a
Ž .
amino acid levels, and observed high correlations between dietary and plasma free EAA patterns in all treatments. We also found that correlations were somewhat higher in liver, but very low in muscle and brain. Tissue free amino acids, namely, tissue amino acid pool is the result of dietary amino acid supply and metabolism of protein and amino acids within the body, so that it does not directly reflect the amino acid pattern of the
Ž .
diet Pion, 1976; Cowey and Walton, 1989 . However, during the period when absorp-tion of dietary amino acids from the digestive tracts is active, correlaabsorp-tions between dietary and plasma EAA patterns may be high. On the other hand, a high correlation between NEAA patterns in the diet and tissues have not been reported previously except
Ž .
for Atlantic cod plasma in the study of Lyndon et al. 1993 . We also found, in this study, high correlations between NEAA patterns in plasma and muscle of the IMB diet groups, and in brain of the balanced amino acid diet groups. However, as individual
Ž
NEAA undergo extensive interconversion and metabolism within the body Cowey and .
Walton, 1989 , the correlation in NEAA patterns between diet and tissue should be further examined.
In this study we found tissue free EAA levels were increased by increasing the dietary protein level. Similar phenomena were also observed in more precise studies of
Ž . Ž .
Yokoyama et al. 1994 in rainbow trout, Ogata and Murai 1994 in masu salmon, and
Ž .
Ogata et al. 1985 in European eel, using diets containing graded protein levels. Ogata
Ž .
et al. 1985 concluded that whole body free EAA levels of the European eel were strongly correlated with their protein intake. The increase in free EAA levels in this study may have been caused by the increase of EAA supply from HP diet intake. By contrast, the changes in individual free NEAA levels by dietary protein levels depend on
Ž
the kind of the NEAA and on the tissue, as reported elsewhere Ogata et al., 1985; Ogata .
and Murai, 1994; Yokoyama et al., 1994 . The total NEAA level in plasma, muscle, and brain of the HP diet group is higher than the LP groups, however, that in the liver of the HP group is lower than the LP group. The changes in the levels of individual NEAA may also be due to the interconversion and metabolism as has already been mentioned ŽCowey and Walton, 1989 ..
In most of the tissues examined, the levels of free phenylalanine and tyrosine increased with increasing dietary fat. We also found free NEAA levels in muscle,
Ž .
especially the glycine levels, increased with increased dietary fat. Wilson et al. 1985 , who compared the serum FAA of channel catfish fed low or high energy diets, did not
Ž .
find marked differences in the FAA levels. However, Cowey et al. 1977 reported that the aromatic amino acid levels in rainbow trout plasma did not differ between high-pro-teinrlow-carbohydrate diet group and low-proteinrhigh-carbohydrate diet group, al-though other amino acid levels were markedly lower in the high-carbohydrate group.
Ž .
Whiting and Wiggs 1977 found that the activity of tyrosine aminotransferase, which
Ž .
lower than the LF group. In rainbow trout, taurine is synthesized from sulfur amino acids such as methionine and cystine, and muscle free taurine levels were increased by
Ž .
supplying higher sulfur amino acids in the diets Yokoyama, 1996 . Accordingly, the
Ž .
decreased feed intakes and sulfur amino acid supply with supplemental dietary fat might be partly related to the lower tissue taurine levels. Taurine is also known to be a
Ž .
component of bile salts in fish Fange and Grove, 1979 . Therefore, another possible reason is that more taurine is consumed as bile salts for digestion of supplemental dietary fat and consequently excreted.
Dietary amino acid profiles are well known to influence the plasma FAA levels ŽKaushik and Luquet, 1980; Cowey and Walton, 1989; Kaushik et al., 1994; Yamamoto
.
et al., 1998 . Several reports have shown that the dietary amino acid profiles affect Ž
muscular FAA levels as well Nose et al., 1978; Kaushik and Luquet, 1980; Dabrowska, .
1984 . In this study, the fish fed the IMB diet contained generally lower levels of free EAA in the tissues than the fish fed the HP diet. In addition, most of the free EAA levels of the IMB group were lower even than the LP group, although the individual EAA content in both the IMB and the LP diets were almost similar except for arginine. When comparing the patterns of individual free EAA levels in a tissue through the treatments with the dietary ArE ratio patterns, higher correlations are found in certain EAA. For example, the correlation for methionine based on the ArE ratio was high in all tissues examined than on just the dietary content. These findings may mean that not only the amino acid content of a diet, but also the amino acid balance in the diet, strongly affect the tissue free EAA levels. In brain, although certain free EAA levels of the IMB diet group were lower than those of the LP group, the total EAA levels through the treatments were rather constant compared with other tissues examined. Peters and
Ž .
Harper 1985 showed that total brain EAA contents in rats were maintained within a narrow range despite the 13-fold range in their protein intake. On the other hand,
Ž .
considerable amounts of g-aminobutyric acid GABA and carnosine were found in the brain, but the levels in the IMB group were not lower than the HP group. The carnosine
Ž .
in the brain will be homocarnosine Matthews and Payne, 1975 . GABA is known as a
Ž . Ž
neurotransmitter Nilsson et al., 1991 , and carnosine and other imidazole compounds .
such as histidine and anserine have a strong buffering capacity in masu salmon skeletal
Ž .
muscle Ogata and Murai, 1994; Ogata et al., 1998 . The levels of these physiologically important compounds in the brain may be kept constant. In muscle, free histidine and b-alanine levels of the IMB group were about half the levels of the HP group, however, anserine levels were not different. In rats, the half-life of histidine and b-alanine was
Ž .
only 3.6 and 2.3 h, respectively, but that of carnosine was 29 days Tamaki et al., 1980 . Accordingly, the fish receiving the IMB diets might keep the muscular level of the more stable anserine at the cost of histidine andb-alanine.
Acknowledgements
We express our sincere gratitude to the Shiga Prefectural Samegai Trout Farm for providing fingerling rainbow trout. We also thank Dr. K.D. Shearer, Northwest Fisheries Science Center, NMFS, USA, for his reviewing the manuscript. This study was carried out with financial support from the Fisheries Agency, Government of Japan.
References
Akiyama, T., Murai, T., Hirasawa, Y., Nose, T., 1984. Supplementation of various meals to fish meal diet for chum salmon fry. Aquaculture 37, 217–222.
Ž .
Cowey, C.B., Walton, M.J., 1989. Intermediary metabolism. In: Halver, J.E. Ed. , Fish Nutrition. Academic Press, San Diego, pp. 259–329.
Cowey, C.B., Adron, J.W., Brown, D.A., 1975. Studies on the nutrition of marine flatfish. The metabolism of
Ž .
glucose by plaice Pleuronectes platessa and the effect of dietary energy source on protein utilization in plaice. Br. J. Nutr. 33, 219–231.
Cowey, C.B., Knox, D., Walton, M.J., Adron, J.W., 1977. The regulation of gluconeogenesis by diet and
Ž .
insulin in rainbow trout Salmo gairdneri . Br. J. Nutr. 38, 463–470.
Ž
Dabrowska, H., 1984. Effect of dietary proteins on the free amino acid content in rainbow trout Salmo
.
gairdneri Rich. muscles. Comp. Biochem. Physiol. A 77, 553–556.
Dabrowska, H., Wojno, T., 1984. Badania nad zastosowaniem dodatkow aminokwasow syntetycznych do
Ž .
mieszanek paszowych przeznaczonych dla pstraga teczowego Salmo gairdneri Rich. . Roczniki Nauk Rolniczych 100, 7–25.
Dabrowski, K., 1982. Postprandial distribution of free amino acids between plasma and erythrocytes of
Ž .
common carp Cyprinus carpio L. . Comp. Biochem. Physiol. A 72, 753–763.
Ž .
Fange, R., Grove, D., 1979. Digestion. In: Hoar, W.S., Randall, D.J., Brett, J.R. Eds. , Fish Physiology, Vol. VIII. Academic Press, New York, pp. 162–260.
Fauconneau, B., 1985. Protein synthesis and protein deposition in fish. In: Cowey, C.B., Mackie, A.M., Bell,
Ž .
J.G. Eds. , Nutrition and Feeding in Fish. Academic Press, London, pp. 17–45.
Kaushik, S., Luquet, P., 1977a. Study of free amino acids in rainbow trout in relation to salinity changes: I. Blood free amino acids during starvation. Ann. Hydrobiol. 8, 135–144.
Kaushik, S., Luquet, P., 1977b. Study of free amino acids in rainbow trout in relation to salinity changes: II. Muscle free amino acids during starvation. Ann. Hydrobiol. 8, 375–387.
Kaushik, S.J., Luquet, P., 1980. Influence of dietary amino acid patterns on the free amino acid contents of
Ž .
blood and muscle of rainbow trout Salmo gairdnerii R. . Comp. Biochem. Physiol. B 64, 175–180. Kaushik, S.J., Breque, J., Blanc, D., 1994. Apparent amino acid availability and plasma free amino acid levels
Ž .
in Siberian sturgeon Acipenser baeri . Comp. Biochem. Physiol. A 107, 433–438.
Lyndon, A.R., Davidson, I., Houlihan, D.F., 1993. Changes in tissue and plasma free amino acid concentra-tions after feeding in Atlantic cod. Fish Physiol. Biochem. 10, 365–375.
Matthews, D.M., Payne, J.W., 1975. Occurrence and biological activities of peptides. In: Matthews, D.M.,
Ž .
Payne, J.W. Eds. , Peptide Transport in Protein Nutrition. North-Holland Publishing, Amsterdam, pp. 392–463.
Mohanty, S.N., Kaushik, S.J., 1991. Whole body amino acid composition of Indian major carp and its significance. Aquat. Living Resour. 4, 61–64.
Moore, S., 1963. On the determination of cysteine as cysteic acid. J. Biol. Chem. 238, 235–237.
Murai, T., Akiyama, T., Nose, T., 1984. Effect of amino acid balance on efficiency in utilization of diet by fingerling carp. Nippon Suisan Gakkaishi 50, 893–897.
Nilsson, G.E., Lutz, P.L., Jackson, T.L., 1991. Neurotransmitters and anoxic survival of the brain: a comparison of anoxia-tolerant and anoxia-intolerant vertebrates. Physiol. Zool. 64, 638–652.
Nose, T., 1973. Changes in pattern of free plasma amino acid in rainbow trout after feeding. Bull. Freshwater Fish. Res. Lab. 22, 137–144.
Nose, T., Lee, D.L., Arai, S., 1978. The effects of withdrawal of single amino acid from an amino acid diet on the free amino acid composition of skeletal muscle in young carp. Bull. Freshwater Fish. Res. Lab. 28, 255–262.
Ogata, H., 1986. Correlations of essential amino acid patterns between the dietary protein and the blood, hepatopancreas, or skeletal muscle in carp. Nippon Suisan Gakkaishi 52, 307–312.
Ogata, H., Murai, T., 1994. White muscle of masu salmon, Oncorhynchus masou masou, smolts possesses a strong buffering capacity due to a high level of anserine. Fish Physiol. Biochem. 13, 285–293.
Ogata, H., Arai, S., Alvarez, B.M., 1985. Effect of dietary protein levels on free amino acid contents of juvenile European eel Anguilla anguilla. Nippon Suisan Gakkaishi 51, 573–578, in Japanese, with English abstract.
Ogata, H.Y., Konno, S., Silverstein, J.T., 1998. Muscular buffering capacity of the parr and smolts in Oncorhynchus masou. Aquaculture 168, 303–310.
Penke, B., Ferenczi, R., Kovacs, K., 1974. A new hydrolysis method for determining tryptophan in peptides and proteins. Anal. Biochem. 60, 45–50.
Peters, J.C., Harper, A.E., 1985. Adaptation of rats to diets containing different levels of protein: effects on food intake, plasma and brain amino acid concentrations and brain neurotransmitter metabolism. J. Nutr. 115, 382–398.
Pion, R., 1976. Dietary effects and amino acids in tissues. In: Cole, D.J.A., Boorman, K.N., Buttery, P.J.,
Ž .
Lewis, D., Neale, R.J., Swan, H. Eds. , Protein Metabolism and Nutrition. Butterworths, London, pp. 259–278.
Plakas, S.M., Katayama, T., Tanaka, Y., Deshimaru, O., 1980. Changes in the levels of circulating plasma free
Ž .
amino acids of carp Cyprinus carpio after feeding a protein and an amino acid diet of similar composition. Aquaculture 21, 307–322.
Ž .
Schuhmacher, A., Wax, C., Gropp, J.M., 1997. Plasma amino acids in rainbow trout Oncorhynchus mykiss fed intact protein or a crystalline amino acid diet. Aquaculture 151, 15–28.
Ž .
Schwarz, F.J., Kirchgessner, M., 1988. Amino acid composition of carp Cyprinus carpio L. with varying protein and energy supplies. Aquaculture 72, 307–317.
Suyama, M., Ogino, C., 1958. Changes in the amino acid composition of protein during the development of rainbow trout eggs. Nippon Suisan Gakkaishi 23, 789–792.
Takeuchi, T., Watanabe, T., Ogino, C., 1978a. Supplementary effect of lipids in a high protein diet of rainbow trout. Nippon Suisan Gakkaishi 44, 677–681, in Japanese, with English abstract.
Takeuchi, T., Watanabe, T., Ogino, C., 1978b. Optimum ratio of protein to lipid in diets of rainbow trout. Nippon Suisan Gakkaishi 44, 683–688, in Japanese, with English abstract.
Takeuchi, T., Shiina, Y., Watanabe, T., 1991. Suitable protein and lipid levels in diet for fingerling red sea bream Pagrus major. Nippon Suisan Gakkaishi 57, 293–299.
Tamaki, N., Morioka, S., Ikeda, T., Harada, M., Hama, T., 1980. Biosynthesis and degradation of carnosine and turnover rate of its constituent amino acid in rats. J. Nutr. Sci. Vitaminol. 26, 127–139.
Wakabayashi, K., 1984. Processing of experimental data. Baifu-kan, Tokyo, pp. 1–201, in Japanese. Walton, M.J., Cowey, C.B., 1982. Aspects of intermediary metabolism in salmonid fish. Comp. Biochem.
Physiol. B 73, 59–79.
Walton, M.J., Wilson, R.P., 1986. Postprandial changes in plasma and liver free amino acids of rainbow trout fed complete diets containing casein. Aquaculture 51, 105–115.
Whiting, S.J., Wiggs, A.J., 1977. Effect of nutritional factors and cortisol on tyrosine aminotransferase activity in liver of brook trout, SalÕelinus fontinalis Mitchill. Comp. Biochem. Physiol. B 58, 189–193.
Ž .
Wilson, R.P., 1989. Amino acids and proteins. In: Halver, J.E. Ed. , Fish Nutrition. Academic Press, San Diego, pp. 111–151.
Wilson, R.P., Cowey, C.B., 1985. Amino acid composition of whole body tissue of rainbow trout and Atlantic salmon. Aquaculture 48, 373–376.
Yamamoto, T., Ikeda, K., Unuma, T., Akiyama, T., 1997. Apparent availabilities of amino acids and minerals from several protein sources for fingerling rainbow trout. Fish. Sci. 63, 995–1001.
Yamamoto, T., Unuma, T., Akiyama, T., 1998. Postprandial changes in plasma free amino acid concentrations of rainbow trout fed different protein sources. Fish. Sci. 64, 474–481.
Yokoyama, M., 1996. Studies on sulfur amino acid metabolism in rainbow trout. PhD thesis, Kyoto University, Kyoto, pp. 1–93.
Yokoyama, M., Nakazoe, J., 1991. Effects of dietary protein levels on free amino acid and glutathione contents in the tissues of rainbow trout. Comp. Biochem. Physiol. A 99, 203–206.