Tree scale distributed multipoint measuring system of
photosynthetically active radiation
L. Palva
a,∗, T. Markkanen
b, E. Siivola
a, E. Garam
a, M. Linnavuo
a, S. Nevas
d,
F. Manoochehri
d, S. Palmroth
c, K. Rajala
a, H. Ruotoistenmäki
a, T. Vuorivirta
a,
I. Seppälä
a, T. Vesala
b, P. Hari
c, R. Sepponen
aaApplied Electronics Laboratory, Helsinki University of Technology, P.O. Box 3000, FIN-02015 HUT, Finland bDepartment of Physics, University of Helsinki, P.O. Box 9, FIN-00014 University of Helsinki, Finland cDepartment of Forest Ecology, University of Helsinki, P.O. Box 24, FIN-00014 University of Helsinki, Finland
dMetrology Research Institute, Helsinki University of Technology, P.O. Box 3000, FIN-02015 HUT, Finland
Received 31 March 2000; received in revised form 13 June 2000
Abstract
A tree scale distributed multipoint measuring system of photosynthetically active radiation (PAR) has been designed. The system is divided into a central unit, measuring units and sensor–amplifiers. Measurements can be carried out with a maximum number of 32 measuring units each comprising 24 sensor–amplifiers. The feasibility of the system has been demonstrated with measurements within a Scots pine canopy using a 12 m telescopic mast with horizontal cross-booms. Two sensor arrays of 4 m in length comprising about 40 sensors were divided into 10-sensor sub-arrays of 1, 2, and 4 m in length. The simultaneously measured PAR averages over the sub-arrays differed considerably from the 4 m reference arrays. The maximum difference was 100% in the case of the 1 m sub-arrays, 80% in the case of the 2 m sub-arrays and 54% in the case of the 4 m sub-arrays. When averaged over the 6 h measuring period around noon, the respective maximum differences were 27, 15 and 3%. © 2001 Elsevier Science B.V. All rights reserved.
Keywords:Multipoint measuring system; Photosynthetically active radiation; Sensor; Photodiode; Data acquisition; Scots pine
1. Introduction
Within a forest canopy the availability of PAR (400–700 nm) is determined by the type and charac-teristics of the forest. Moreover, the spatial distribu-tion of PAR depends on the depth within the canopy (Baldocchi et al., 1986; Ross et al., 1998). In photo-synthetic studies, this distribution is needed due the nonlinear dependency of the photosynthetic rate on
∗Corresponding author. Tel.:+358-9-4512313;
fax:+358-9-4512307.
E-mail address:[email protected] (L. Palva).
PAR (Norman and Jarvis, 1974; Sheehy and Cha-pas, 1976; Hari et al., 1984; Baldocchi et al., 1986; Myneni et al., 1989; Pearcy, 1989). Therefore, to assess the photosynthetic productivity of a hetero-geneous forest canopy, measurements of PAR at different depths within the canopy are needed.
Various methods have been used for estimating PAR within canopies depending on the specific re-quirements of the study, such as the spatial scale of the site (Baldocchi and Collineau, 1994). Reifsnyder et al. (1971) determined statistical guidelines for the measurement of solar radiation within a pine canopy using 15 pairs of sensors at randomly located
measuring points in a semicircle having a radius of about 30 m. It was concluded that within pine canopies, about 400 sensors would be required to estimate the mean value of the direct component of instantaneous radiation. However, fewer sensors are needed for longer averaging periods. For example, Gay et al. (1971) used five sensors in a grid with about 8 m between the measuring points, and recom-mended that beneath a pine canopy on a cloudless day five sensors would be required to determine the daily mean of the transmitted total radiation. In gen-eral, the number of measuring points needed has been found to depend on the type of canopy and on the duration of the measuring period (Reifsnyder et al., 1971; Baldocchi and Collineau, 1994).
In studies where a high number of measuring points has been required, mobile sensors have often been used for the measurement of the spatial distribution of ra-diation (Mukammal, 1971; Norman and Jarvis, 1974; Sinclair and Knoerr, 1982; Baldocchi et al., 1986; Péch, 1986; Cohen and Fuchs, 1987; Ross et al., 1998). The sensor or a number of sensors are mounted on a carriage which traverses along a track of about 1 m to tens of meters in length. Although a moving sensor has advantages (see, e.g. Brown, 1973; Péch, 1986) there is, however, problems in the case that the separation of spatial and temporal components of PAR variabil-ity is required (Baldocchi and Collineau, 1994). For this purpose, simultaneous measurements with a rep-resentative number of sensors are preferred (Salminen et al., 1983; Gutschik et al., 1985).
The dependence of the measuring accuracy on the number and spatial distribution of measuring points has been studied within a Scots pine canopy in a case where the spatial scale was the area of a twig (Palva, 1998; Palva et al., 1998). A fiberoptic sensor comprising 400 measuring points in a regular grid of 11 cm×20 cm was used. The results showed that the
spatial distribution of the measuring points is of major importance. For example, in a case where 192 measur-ing points covermeasur-ing the needle region and 24 evenly distributed points were selected, these 24 points pro-vided a maximum difference of 3% from the value obtained using the 192 points. However, in the case where the 96 points covering half of the needle region were selected, the maximum difference was 20%.
The aim of this study was to develop a multipoint measuring system of PAR specified for tree scale
as-sessments of PAR distributions within a forest canopy. In this paper, the measuring system is described in de-tail, the sensor is characterised and the system is used to investigate the effect of the number and the spatial distribution of measuring points in determining the av-erage PAR in the mid crown and close to the crown base within a Scots pine (Pinus sylvestrisL.) stand.
2. Methods
2.1. Construction of the measuring system of photosynthetically active radiation
2.1.1. General view
The measuring system is divided into a central unit (CU), measuring units (MU) and sensor–amplifiers (SA). The MUs are connected with a serial commu-nications line and to a common power supply. The construction enables measurements with a maximum number of 32 MUs each comprising 24 SA. Thus, 768 (32×24) sensors can be employed which correspond
to the indications given by studies of Reifsnyder et al. (1971) and Palva (1998).
The system is movable and capable of long term automatic data collection. The connection network en-ables the distribution of MUs into chain and star-type arrangements with a maximum cable length of 100 m. The sensor–amplifiers have a maximum cable length of 5 m. Measurement configurations are alterable with respect to the measuring point number, spatial reso-lution of measurements with a minimum distance of 10 mm between the 1.6 mm2measuring points and the arrangement of MUs into groups with a variable num-ber and spatial positioning.
2.1.2. Data acquisition and processing
command, a sequential sampling procedure covering the 24 channels in a time of 1 m s is followed. There-after, the resulting datapacket is transmitted to the CU in 40 m s. The data transfer rate is 9600 bit s−1.
2.1.3. Sensor–amplifier
Quantum sensors are commonly used for the mea-surement of PAR (Pearcy, 1989). A conventional quan-tum sensor comprises a photodiode and optical fil-ters in a hermetically sealed housing with a diffuser placed on the top to provide a cosine response. As an affordable alternative photodiodes have been used in multipoint measuring systems (Gutschik et al., 1985; Chazdon and Field, 1987). The applicability of photo-diodes for PAR measurements has been discussed by Pearcy (1989).
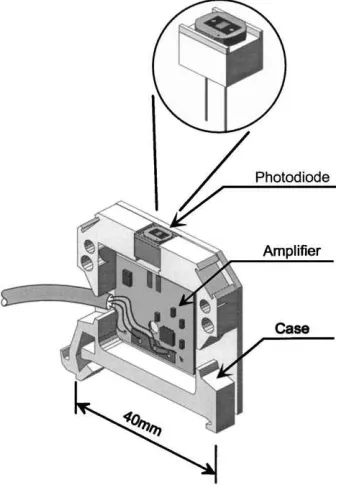
The selected sensors were silicon photodiodes with IR filters (VTB 9412B, EG&G Vactec Optoelec-tronics, USA). The sensor–amplifier construction is shown in the diagram of Fig. 1. Important character-istics of the selected photodiode and the operational amplifier (TLC271ID, Texas Instruments, USA) are
Fig. 1. Structure of sensor–amplifier combination. Photodi-ode active surface is 1.6 mm×1.0 mm and packace surface is 5.2 mm×6.0 mm.
Table 1
Characteristics of photodiode and preamplifier by manufactures Test conditions Photodiode (T=25◦C)
Active area 1.6 mm2
ISC(max) 0.08% (◦C) 2850 K
Dark current 0.5 nA VR=2 V
Angular response ±50◦ 50% response point
Spectral response peak 580 nm Preamplifier (T=−40 to 85◦C)
Offset voltage (max) 13 mV Bias current (max) 2 nA
presented in Table 1. The measurement bandwidth de-termined by the time constant of the transimpedance R1C1 is 160 Hz and the absolute response of the sensor–amplifier combination is of the order of 150mA (3 V)/2000mmol m−2s−1. In comparison to
the absolute response, the amplifier bias current and offset voltage as well as the photodiode dark current are negligible (Table 1). In order to prevent environ-mental effects, the electrical circuitry is sealed with epoxy resin (EER2001RP250G, Electrolube, UK).
2.2. Measurements of sensor characteristics
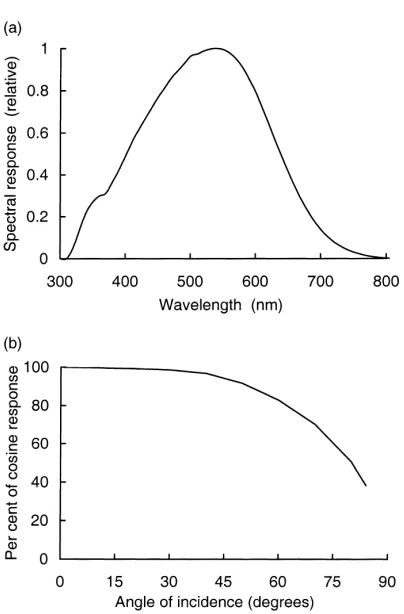
Since only the peak value of the spectral response and the half power angle of the angular response of the photodiode were given by the manufacturer, measure-ments were carried out to obtain these characteristics more comprehensively.
2.2.1. Spectral response
Fig. 2. Measured characteristics of photodiode sensor (a) relative spectral response and (b) relative deviation of angular response from cosine response.
2.2.2. Angular response
The measurements of the relative angular response of the test photodiode were made using a 1000 W quartz–tungsten–halogen (QTH) lamp as a light source. The lamp and the photodiode were mounted on an optical rail and were aligned on the optical axis by using an alignment laser. The distance be-tween the light source and the photodiode was 1.5 m. Two baffles were used to reduce the effect of the scattered light. The angle of incidence of the light beam onto the photodiode was alternated by using a high-accuracy rotating table. The photodiode was mounted on the rotating table so that the axis of rota-tion was through the center of the active area. Three measurement runs of the relative angular response of the photodiode were performed. The step angle was 2◦ and the range of angle was from 0 to±90◦. The ratio of the readings and the cosine response in relative values is shown in Fig. 2b.
2.3. Calibration
The sensors were calibrated in sunlight using quan-tum sensor LI-190SA with an LI-190SB millivolt adapter (LI-COR Ltd., NE, USA) as a reference. An absolute response of 10 mV/2000mmol m−2s−1 is
given with a 5% uncertainty for the reference sensor. Because of deviations in the responsivities between the measuring channels, a correction factor was given to each channel. The calibration was checked after a 4-month period of measurements within the canopy and 6 months in store. The average difference be-tween the correction factors was 3.6% and standard deviation was 3.2%. Long term stability of sensors with similar characteristics has been reported, e.g. by (Aaslyng et al., 1999).Cosine correction for direct radiation was performed as follows. The proportion of direct radiationIshwas modeled by
Ish=S0τmsin(γs), (1)
where S0 denotes PAR equivalent of the solar constant=2700mmol m−2s−1 (Weiss and Norman,
1985),m=1/sin(γs) the air mass,τmthe atmospheric transmittance of direct radiation in clear sky condi-tions (Gates, 1980) andγs denotes the sun elevation angle. The proportion of diffuse radiation Idh was modeled by
Idh=α[βS0sin(γs)−Ish], (2) whereαandβ are parameters. The values used forα andβwere 0.5 and 0.91, respectively (see Campbell, 1981). The diffuse radiation field inside the canopy was assumed to be homogeneous and it was assumed to decrease as a function of the cumulative leaf area indexLaccording to the Beer’s law
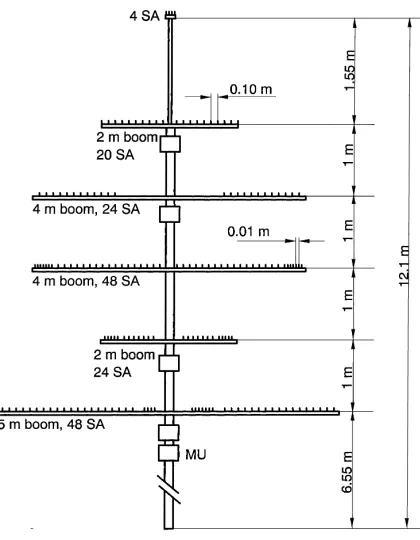
Fig. 3. Set-up for PAR measurements. MU denotes measuring unit and SA denotes sensor–amplifier.
2.4. Mechanical structure
A telescopic mast with cross-booms has been imple-mented providing variable measurement set-ups and lightweight constructions to facilitate transferability and ease in setting up the system. The height of the mast is adjustable within 6–12 m and the maximum length of the booms of aluminum rectangle-profile is 5 m. The booms can be positioned on the mast freely except for a minimum distance of 25 cm between adja-cent booms. One arrangement for PAR measurements is shown in Fig. 3.
2.5. Field measurements
2.5.1. Site
The measurements were carried out within a 35 year old Scots pine stand with an average tree height of 13 m and a total leaf area index of nine at the SMEAR II field measurement station (Station for Measur-ing Forest Ecosystem–Atmosphere Relations), which
is located in Hyytiälä, Southern Finland (61◦51′N, 24◦17′E, 175 m a.s.l.) (see Vesala et al., 1998). The stand is homogeneous for about 200 m in all directions from the measurement site, extending approximately 1.2 km to the north (60◦zone). The terrain is subject to modest height variation. The wood biomass is 47 tons per ha and the tree density is 2500 ha−1.
2.5.2. PAR measurements
The mast was erected in the middle of the stand and the sensor array was laid out in a north–south direction. The booms were 5, 4 and 2 m long. The main part of the sensors was placed symmetrically on both sides of the mast with 0.1 m distance between each sensor. The remainder of the sensors were placed in sets of 4–6 sensors at 1 cm distances in three of the booms as shown in Fig. 3. On top of the mast at 12 m there were four sensors for measuring PAR above the canopy. A sunny day 26 June was selected for the analysis. This analysis includes measurements between 9.00 a.m. and 3.00 p.m. recorded every 7 s.
3. Results and discussion
3.1. Spatial variation
Fig. 4. Instantaneous point by point measurements of PAR at (a) 6.6 m and (b) 8.6 m. Dotted line denotes instantaneous average PAR obtained with four sensors on top of the mast. Measurements: 10.00, 12.00 and 14.00 h, 26 June 1998.
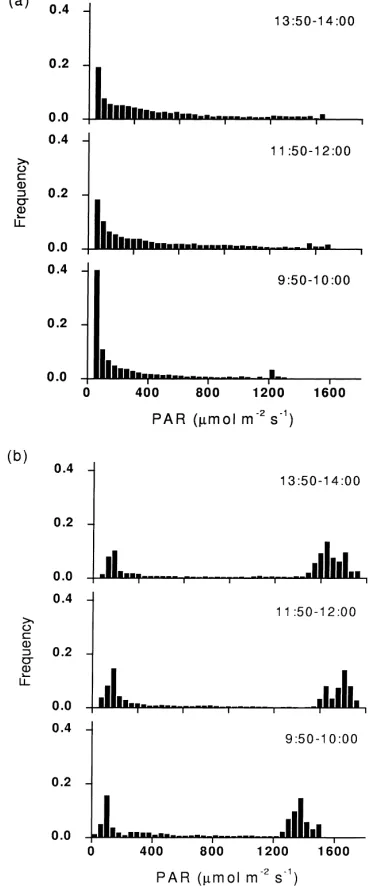
Fig. 5. Frequency distributions of instantaneous PAR measurements at (a) 6.6 m and (b) 8.6 m. Measurements: 9.50–10.00, 11.50–12.00 and 13.50–14.00 h, 26 June 1998.
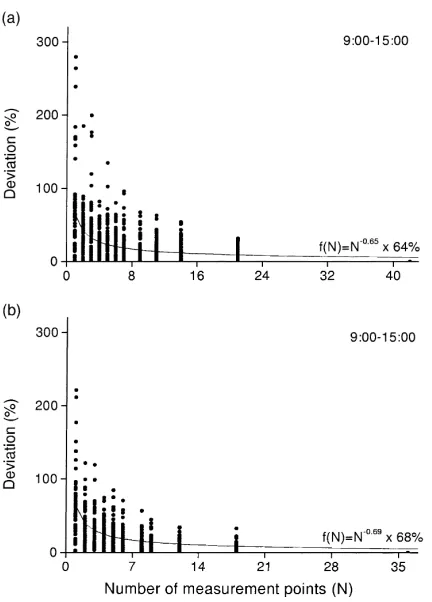
Fig. 6. Relative deviations of average PAR obtained with a variable number of sensors (N) from average PAR with maximum number of sensors (a) at 6.6 m and (b) at 8.6 m. Deviations are in absolute values. Curved line represents fit of functionf(N) in mean value of deviations. Measurements: 9.00–15.00 h, 26 June 1998.
of the instantaneous measurements ranged from 280 to 470mmol m−2s−1and the standard deviation from
330 to 440mmol m−2s−1at 6.6 m, and for 8.6 m these
ranges were 850–1100 and 560–690mmol m−2s−1.
3.2. Number and distribution of measuring points
The effect of the number and distribution of the measuring points on the estimation of the average PAR was evaluated. The two 48-sensor booms were ana-lyzed separately. Only the sensors at 10 cm spacing were included in this analysis resulting in a maximum number of 41 sensors at 6.6 m and 36 sensors at 8.6 m. In the following analysis, PARave denotes the average of PAR obtained with various number of sensors and PARrefdenotes the average PAR obtained by using the maximum number of sensors.
Fig. 7. Positions of 1, 2 and 4 m 10-sensor sub-arrays.
The importance of the measuring point number was studied by selecting a variable number (N) of mea-suring points with even distances of maximum length between the measuring points for calculating PARave. Relative deviations of PARave from PARref are pre-sented in absolute values as a function ofNin Fig. 6. A single measuring point was excluded from the fit of the functionf(N)=N−a×bin the mean value of the
deviations since the position of a single sensor in the boom had a considerable effect on the values of the parameters a and b obtained by this fit.
Fig. 8. Relative deviations of average PAR obtained with 1, 2 and 4 m 10-sensor sub-arrays from average PAR with maximum number of sensors at (a) 6.6 m and (b) 8.6 m. Columns include 50% of the values of the instantaneous measurements, medians of measuring periods are denoted by transverse lines and aver-ages over measuring period 9.00–15.00 h are denoted by points. Measurements: 9.00–15.00 h, 26 June 1998.
the maximum difference is 54%. It can be noted from Fig. 8 that some of the columns corresponding to the 1 and 2 m sub-arrays are positioned entirely above and some are positioned entirely below the point of the zero deviation. For example, the column correspond-ing to sub-array B2 is above the zero deviation point, which means that the values of PARave were mainly higher than PARref. As a consequence, PARave aver-aged over the 6 h measuring period differed consid-erably, by 27%, from PARref. In the case of the 2 m sub-arrays, the temporal averaging provided a maxi-mum difference of 15% between PARave and PARref and in the case of 4 m sub-arrays the maximum dif-ference was as low as 3%.
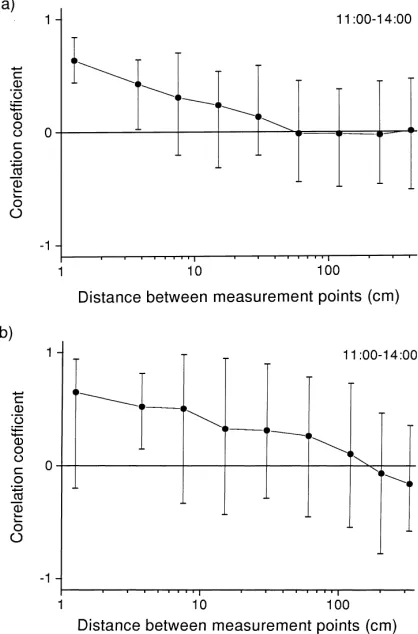
Fig. 9. Correlations between sensor readings as a function of dis-tance at (a) 6.6 m and (b) 8.6 m. The correlations of the instan-taneous measurements are within vertical lines and averages over measuring period 11.00–14.00 h are denoted by points. Measure-ments 11.00–14.00 h, 26 June 1998.
Correlations of instantaneous measurements be-tween each pair of sensors over the period 11.00–14.00 were calculated. In Fig. 9, the averaged correlation values are presented as a function of the distance between the sensors. In this study, also the sensors at 1 cm spacings were included. Already at the 1 cm spacings there is large variability in the values of the correlation coefficients ranging from 0.9 to−0.2
crown base (Smolander, 1984). In those measure-ments, the correlation coefficient became negative after a distance of 18 cm with 5 min averaging peri-ods. In the present study, the negative values appear at such close distances that there is obviously a need for higher measurement resolution to obtain a more detailed analysis.
4. Concluding remarks
A flexible multipoint measuring system of pho-tosynthetically active radiation (PAR) has been de-signed and operated within a Scots pine canopy. This system provides a tool for versatile studies of PAR characteristics within tree dimensions with a maximum number of 32 measuring units of 24 sensor–amplifiers. The measuring units connected with a common serial communications line can be synchronized for measurements within a 20 ms time window. The 24-sensor sampling sequence of a sin-gle measuring unit takes about 1 ms. With the used set-up of 168 sensors recorded every 7 s, the system is capable of continuous data collection over a 3-week period. Measurement configurations are alterable with respect to the measuring point number, spatial distri-bution of measurements with minimum distance of 10 mm between the 1.6 mm2 measuring points and arrangements of measuring units into groups with a variable number and spatial positioning. The whole system is also easily relocated.
The usefulness of the system has been demon-strated with field measurements. The first measure-ments within a Scots pine canopy have already been reported in a previous study dealing with the effect of spatial and temporal averaging of PAR measurements in estimating the CO2exchange (Vesala et al., 2000). In this study, the effect of the number and distribution of the measuring points on the estimation of the aver-age PAR was analyzed with a boom at 6.6 m close to the crown base and another at 8.6 m in the mid part of the crown. Two sensor arrays of 4 m in length com-prising about 40 sensors were divided into 10-sensor sub-arrays of 1, 2 and 4 m in length. Simultaneously, measured PAR averages over the sub-arrays differed considerably from the 4 m reference arrays. The max-imum difference was 100% in the case of the 1 m sub-arrays, 80% in the case of the 2 m sub-arrays
and 54% in the case of the 4 m sub-arrays. When averaged over the 6 h measuring period around noon, the respective maximum differences were 27, 15 and 3%.
In this study, we have introduced a new tool for measuring spatial and temporal characteristics of PAR within canopies. The system may be adapted to various measurement situations. The first results demonstrate the feasibility of the distributed tree scale multipoint measuring system.
References
Aaslyng, J.M., Rosenqvist, E., Høgh-Schmidt, K., 1999. A sensor for microclimatic measurements of photosynthetically active radiation in a plant canopy. Agric. For. Meteorol. 96, 189–197. Baldocchi, D., Collineau, S., 1994. The physical nature of solar radiation in heterogeneous canopies: spatial and temporal attributes. In: Caldwell, M.M., Pearcy, R.W. (Eds.), Exploitation of Environmental Heterogeneity by Plants. Academic Press, San Diego, pp. 21–71.
Baldocchi, D., Hutchison, B., Matt, D., McMillen, R., 1986. Seasonal variation in the statistics of photosynthetically active radiation penetration in an oak-hickory forest. Agric. For. Meteorol. 36, 343–361.
Brown, G.W., 1973. Measuring transmitted global radiation with fixed and moving sensors. Agric. Meteorol. 11, 115–121. Campbell, G.S., 1981. Fundamentals of radiation and temperature
relations. In: Lange, O.L., Nobel, P.S., Osmond, C.B., Ziegler, H. (Eds.), Physiological Plant Ecology. I. Responses to the Physical Environment. Springer, Berlin, Heidelberg, pp. 11–40. Chazdon, R.L., Field, C.B., 1987. Photographic estimation of photosynthetically active radiation: evaluation of a computerized technique. Oecologia 73, 525–532.
Cohen, S., Fuchs, M., 1987. The distribution of leaf area, radiation, photosynthesis and transpiration in a Shamouti orange hedgerow orchard. Part I. Leaf area and radiation. Agric. For. Meteorol 40, 123–144.
Gates, D.M., 1980. Biophysical Ecology. Springer, New York, 611 pp.
Gay, L.W., Knoerr, K.R., Braaten, M.O., 1971. Solar radiation variability on the floor of pine plantation. Agric. Meteorol. 8, 39–50.
Gutschik, V.P., Barron, M.H., Waechter, D.A., Wolf, M.A., 1985. Portable monitor for solar radiation that accumulates irradiance histograms for 32 leaf mounted sensors. Agric. For. Meteorol. 33, 281–290.
Hari, P., Nilson, T., Salminen, R., Kaipiainen, L., Korpilahti, E., Ross, J., 1984. Nonlinear dependence of photosynthetic rate on irradiance and its consequences for estimates of the amount of saccharides formed. Photosynthetica 18 (1), 28–33.
Mukammal, E.I., 1971. Some aspects of radiant energy in a pine forest. Arch. Meteorol. Geophys. Bioklimatol. 19, 29–52. Myneni, R.B., Ross, J., Asrar, G., 1989. A review on the theory
of photon transport in leaf canopies. Agric. For. Meteorol. 45, 1–153.
Norman, J.M., Jarvis, P.G., 1974. Photosynthesis in sitka spruce (Picea sitchensis(bong.) carr.). III. Measurements of canopy structure and interception of radiation. J. Appl. Ecol. 11, 375– 398.
Palva, L., 1998. Measurement of photosynthetically active radiation within canopies: development of a novel method and technique. Helsinki University of Technology, Applied Electronics Laboratory, Series B: Research Reports B2, 27 pp. Palva, L., Garam, E., Siivola, E., Hari, P., Sepponen, R., 1998. Quantifying spatial variability of PAR within canopies using a multipoint measuring system of PAR. Agric. For. Meteorol. 92 (3), 163–171.
Pearcy, R. W., 1989. Radiation and light measurements. In: Pearcy, R.W., Ehleringer, J.E., Mooney, H.A., Rundell, P.W. (Eds.), Plant Physiological Ecology: Field Methods and Instrumentation. Chapman & Hall, London, pp. 97–116. Péch, G., 1986. Mobile sampling of solar radiation under conifers.
Agric. For. Meteorol. 37, 15–28.
Reifsnyder, W.E., Furnival, G.M., Horowitz, J.L., 1971. Spatial and temporal distribution of solar radiation beneath forest canopies. Agric. Meteorol. 9, 21–37.
Ross, J., Sulev, M., Saarelaid, P., 1998. Statistical treatment of the PAR variability and its application to willow coppice. Agric. For. Meteorol. 91, 1–21.
Salminen, R., Hari, P., Kellomäki, S., Korpilahti, E., Kotiranta, M., Sievänen, R., 1983. A measuring system for estimating the frequency distribution of irradiance within plant canopies. J. Appl. Ecol. 20, 887–895.
Sheehy, J.E., Chapas, L.C., 1976. The measurement and distribution of irradiance in clear and overcast conditions in four temperate forage grass canopies. J. Appl. Ecol. 13, 831–840.
Sinclair, T.R., Knoerr, K.R., 1982. Distribution of photosynthetically active radiation in the canopy of a loblolly pine plantation. J. Appl. Ecol. 19, 183–191.
Smolander, H., 1984. Measurement of fluctuating irradiance in field studies of photosynthesis. Acta For. Fenn. 187, 56. Vesala, T., Haataja, J., Aalto, P., Altimir, N., Buzorius, G., Garam,
E., Hämeri, K., Ilvesniemi, H., Jokinen, P., Keronen, P., Lahti, T., Markkanen, T., Mäkelä, J.M., Nikinmaa, E., Palmroth, S., Palva, L., Pohja, T., Pumpanen, J., Rannik, Ü., Siivola, E., Ylitalo, H., Hari, P., Kulmala, M., 1998. Long-term field measurements of atmosphere–surface interactions in boreal forests combining forest ecology, micrometeorology, aerosol physics and atmospheric chemistry. Trends in Heat Mass Momentum Transfer 4, 17–35.
Vesala, T., Markkanen, T., Palva, L., Siivola, E., Palmroth, S., Hari, P., 2000. Effect of variations of PAR on CO2
exchange estimation for Scots pine. Agric. For. Meteorol. 100, 337–347.