Landslide susceptibility mapping by combining the three methods
Fuzzy Logic, Frequency Ratio and Analytical Hierarchy Process in Dozain basin
Esmaeil Tazik a., Zahra Jahantab b, Mohsen Bakhtiari a, Abdolali Rezaei a, Seyed Kazem Alavipanah a
a Dept. of RS&GIS, Faculty of Geography, University of Tehran, Iran
b Dept. of RS&GIS, Faculty of Environment, Islamic Azad University, Iran - [email protected]
KEY WORDS: Landside susceptibility, Fuzzy Analytical Hierarchy Process, frequency ratio
ABSTRACT:
Landslides are among the most important natural hazards that lead to modification of the environment. Therefore, studying of this phenomenon is so important in many areas. Because of the climate conditions, geologic, and geomorphologic characteristics of the region, the purpose of this study was landslide hazard assessment using Fuzzy Logic, frequency ratio and Analytical Hierarchy Process method in Dozein basin, Iran. At first, landslides occurred in Dozein basin were identified using aerial photos and field studies. The influenced landslide parameters that were used in this study including slope, aspect, elevation, lithology, precipitation, land cover, distance from fault, distance from road and distance from river were obtained from different sources and maps. Using these factors and the identified landslide, the fuzzy membership values were calculated by frequency ratio. Then to account for the importance of each of the factors in the landslide susceptibility, weights of each factor were determined based on questionnaire and AHP method. Finally, fuzzy map of each factor was multiplied to its weight that obtained using AHP method. At the end, for computing prediction accuracy, the produced map was verified by comparing to existing landslide locations. These results indicate that the combining the three methods Fuzzy Logic, Frequency Ratio and Analytical Hierarchy Process method are relatively good estimators of landslide susceptibility in the study area. According to landslide susceptibility map about 51% of the occurred landslide fall into the high and very high susceptibility zones of the landslide susceptibility map, but approximately 26 % of them indeed located in the low and very low susceptibility zones.
corresponding Author, 09197739987
1. INTRODUCTION
Global climate change and the increasing human population over the past few decades have deeply affected the geo-environment [Wang et al, 2013]. Landslide is a major cause of substantial damages that lead to property and loss of life in many countries across the world every year. It is a major geohazard and can be triggered by earthquakes, volcanic eruptions, flood, or indeed by man-made activities. Landslide susceptibility is defined as the proneness of the terrain to produce slope failures, and it is usually expressed in a cartographic way. A landslide susceptibility map depicts areas likely have landslides in the future by correlating some of the principal factors that contribute to landslides with the past distribution of slope failures [Brabb et al., 1984]. Up to now, several algorithms and models have been proposed for generating the Landslide Susceptibility that mainly include Analytical Hierarchy Process ( AHP) [khazeri et al., 2010],logistic regression[Carrara et al.,1983],fuzzy-logic[Gee et al., 1991],artificial neural network analysis[Canani et al ,2008] modeling approaches[Perriello Zampelli et al ,2012] , Fuzzy Analytical Hierarchy Process (FAHP) [Shadman Roodposhti et al., 2010], Geographically weighted principal component analysis [Faraji Sabokbar et al., 2014] etc, that most of which are related to the weight of landslide factors. Above studies demonstrate that many techniques have been used for landslide susceptibility mapping and have achieved excellent results. Therefore, FAHP, as a common and important technique, for landslide susceptibility mapping, was used to create a landslide susceptibility mapping for Dozein basin, Iran. The main
difference between present study and the approaches described before is that we combined three model AHP, Fuzzy logic and frequency ratio to calculate landslide susceptibility hazard in Dozein basin. Therefore, it is predicted to have better results rather than past studies.
2. Materials and Methods
2.1 Study area
The study area is located east of Golestan province in north Iran, It covers an area of about 5041 ha between longitudes 55°32′E and 55°38′E, and latitudes 37°3′N and 37°09′N. In this area several landslides have occurred in the past and now (Fig. 2). The altitude varies from 500 to 2420 m, and it decreases from the northwest to the southeast. Mean annual precipitation and temperature within the study area is 881 mm, 17C°, respectively. Location map of the study area is shown in Fig 1.
Figure 2. Photos of Landslide in Study area recognized as primary effective factors on landslide occurrence.
Aspect
Despite the fact that some authors (Greenbaum et al., 1995) mentioned that aspect has no significant influence on land sliding, several researchers have reported a relationship between slope orientation and landslide occurrence (DeGraff et al., 1980, Marston et al. 1998). Aspect-related parameters such as exposure to sunlight, drying winds, rainfall (wetness or degree of saturation) and discontinuities may control the occurrence of landslides .In this study slope aspect is divided every 45°. Thus there are 8 intervals
Slope
Slope is one of the major factors in landslide susceptibility map because slope have direct effect on landslide process, therefore it is frequently used in landslide susceptibility map [Ayalew et al., 2005, Jordan et al, 2000] between landslide activity and elevation is still unclear, hence it requires further studies. However, in most regions of the Northern Hemisphere, relations between elevation and the rainfall is directly but in some area such as the southern slopes of the Alborz Mountains this relation is inversly, on the other hand elevation have a direct relation with temperature of air, so that by changing these two parameters (rainfall and temperature), amount of storage water, vegetation and evapotranspiration ,etc. Is change that these parameters have negative or positive affect on landslide In this study elevation is divided for every 500 m; thus there are 4 categories
Land cover
Landslides are natural occurring phenomena and will occur whether people are there or not. However, human practice may accelerate the occurrence or play a significant role in the occurrence of landslides [Cheng et al, 2007]. Land cover is mainly dominated by various types of woods, rangeland, grassland residential area and cultivated land [Dai et al, 2001].
Lithology
It has been widely recognized that lithology greatly influences the occurrence of landslides, because lithological and structural variations often lead to a difference in the strength and permeability of rocks and soils [Champati ray et al ,2007]. Lithology is one of the main factors for landslide susceptibility zonation [Kayastha et al ,2013].
Distance from faults
Faults are the structural features, which describe a zone of weakness with relative movement, along which landslide susceptibility is higher [Pourghasemi et al ,2009]. It has generally been observed that the probability of landslide occurrence increases as the mentioned distance decreases, which not only affect the surface material structures but also make contribution to terrain permeability causing slope instability [Iovine et al, 2008]
Distance from road
The distance to road parameter reflects human activities [Pourghasemi et al., 2009]. In other words, landslides may occur on the slopes intersected by roads [Nielsen et al, 1979]. According to recent studies, cutting slopes for highway construction and frequency vibrations caused by cars would induce landslides (Mittal et al., 2008).Distance from river Generally, potential of landslides increases by decrease in distance to rivers, because streams may adversely affect stability by eroding the slopes or by saturating the lower part of material, resulting in water level increases [Ercanoglu et al., 2004].
Precipitation
Most of the landslides occur after heavy rainfall; so that water infiltrates rapidly upon heavy rainfall and increases the degree of saturation and potential of landslide occurrence [Pourghasemi et al., 2009]. Annual total rainfall in this basin is 881 mm thus precipitation is one of major parameters in the area study.
2.3 Data
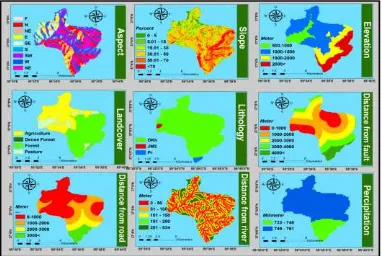
In this study, a spatial database considering landslide-related factors(Fig.3) based on extensive field work and previous inventory maps, such as topography, geology, and land cover, was used. Land cover was detected from satellite images such as TM images. The landslide map is in the form of point coverage, the topographic map in the form of line and point coverage at a scale of 1:50,000, the geological map in the form of polygon coverage at a scale of 1:50,000. Nine factors, extracted from the constructed spatial database, were considered when calculating the probability.
Contour and survey base points that have an elevation value were extracted from the topographic map was made using the elevation value. The slope, aspect, and elevation were obtained from the Digital Elevation Model (DEM) using IDW model. The distance from river and road was calculated using the topographic map. A lithology and fault map of the study area is digitized from the existing geology map at the scale of 1:100,000 from the geological survey of Iran (GSI). Finally, land cover data was classified from a LANDSAT TM image using the supervised (maximum likelihood) classification method. Overall, the Dozein basin data set comprised of 283 rows by 251 columns, with a total cell number of 71033
2.4 Analysis
The analytic hierarchy process (AHP) is one of the most commonly used methods of assessment which works base on a premise that decision making of complex problems can be handled by structuring the complex problem into a simple and comprehensible hierarchical structure. Despite of its wide range of applications, the conventional AHP approach may not fully reflect a style of human thinking, in which human’s judgments are represented as exact numbers. However, in many practical situations, decision makers usually feel more confident to give interval judgments rather than expressing their judgments in the form of exact numeric values. Therefore, AHP technique involves subjectivity in pair-wise comparisons and vagueness and uncertainty dominate in this process. Combining AHP into the fuzzy system brings the fuzzy number of the fuzzy set theory directly into the pair-wise comparison matrix of the AHP. The purpose is to solve vague problems, which occur during the analysis of criteria and the judgment process. FAHP should be able to tolerate vagueness or ambiguity, and should thus be more appropriate and effective than conventional AHP in real practice. A fuzzy set is a class of objects with continuous grades
of membership which represents the degree of truth as an extension of valuation. Fuzzy sets generalize classical sets while the indicator functions of these sets are special cases of the membership functions of fuzzy sets for the latter only take values 0 or 1. Therefore, fuzzy analytic hierarchy process (FAHP), a fuzzy extension of AHP, was developed to solve the hierarchical fuzzy problems. In the FAHP procedure, the pairwise comparisons in the judgment matrix are fuzzy numbers that are modified by the designer’s emphasis.
In order to create the landslide susceptibility map, the frequency ratio model was first used for calculate fuzzy membership. As previously mentioned, the frequency ratio is the ratio of the area where landslides occurred in the total study area, and also is the ratio of the probabilities of a landslide occurrence to a non-occurrence for a given attribute [Bonham, 1994]:
(1)
Where:
Di: is the area of landslide of the ith category
Ai: is the area of the ith category in a certain parameter N: is the category number of the parameter
Factor class Percentage of
landslide pixels
Percentage pixels no landslide
FR Fuzzy
membership Distance from
fault(m)
0-1000 28.57 13.39 2.13 1
1000-2000 35.71 22.12 1.61 0.75
2000-3000 28.57 23.42 1.21 0.57
3000-4000 7.14 20.42 0.34 0.16
4000< 0 18.69 0 0
Distance from road (m)
0-1000 78.57 37.29 2.1 1
1000-2000 14.28 25 0.57 0.27
2000-3000 7.14 15.24 0.46 0.22
3000< 0 22.44 0 0
Elevation (m) 500-1000 21.42 11.23 1.9 1
1000-1500 71.42 51.03 1.4 0.73
1500-2000 7.14 18.61 0.38 0.2
2000< 0 19.11 0 0
Slope (%) 0-5 0 2.99 0 0
5-15 7.14 9.24 0.77 0.49
15-30 21.42 24.23 0.88 0.56
30-50 50 42.12 1.55 1
50-70 21.42 22.26 0.98 0.61
70< 0 9.13 0 0
Aspect North 14.2 15.2 0.93 0.38
Northeast 21.42 8.8 2.43 1
Southeast 0 7.21 0 0
South 0 7.57 0 0
Southwest 7.14 9.75 0.73 0.3
West 7.14 11.97 0.59 0.24
Northwest 21.42 14.36 1.49 0.61
South 28.57 25.05 1.14 0.46
Distance from river(m)
0-50 42.85 19.03 2.25 0.9
50-100 28.57 13.03 2.19 0.88
100-150 21.42 8.62 2.48 1
150-200 7.14 6.19 1.15 0.46
200< 0 53.11 0 0
Land cover dense forest 0 0.07 0 0
Sparse forest 21.42 48.96 0.43 0.26
pasture 14.28 11.8 1.2 0.73
agriculture قطانم ینوکسم
64.28 39.15 1.64 1
Pr 0 1.62 0 0
DKh 100 97.47 1.02 1
Precipitation 730 -750 7.142 20.167 0.35 0.3
750< 92.85 79.83 1.63 1
Table 1. Spatial relationships between each factor and landslide and fuzzy membership values
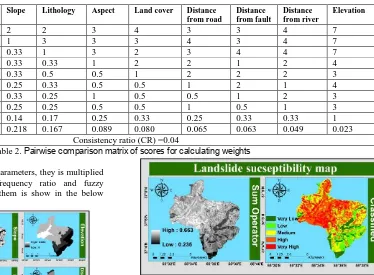
The AHP methodology consists of pairwise comparison of all possible pairs of factors and try to synthesize the judgments to determine the weights (Saaty, 2001).in this study the relative rating for the dominance between each pair of factors was guided by expert knowledge. A comparison matrix of scores was created (Table 2). In this study, the value of CR is obtained by the ratio between the values of the indexes CI [matrix's consistency index, whose expression is shown in Eq. (2)] and a
random index RI, which is the average consistency index. a CR lower than 0.1 would be acceptable (Ayalew et al. 2004), although this depends on the objective of the study.
(2)
Where λ_max is the maximum eigenvalue of comparison matrix, and m is the number of factors (nine in this study)
Weight-decision matrix
Precipita tion
Slope Lithology Aspect Land cover Distance from road
Distance from fault
Distance from river
Elevation
Precipitation 1 2 2 3 4 3 3 4 7
Slope 0.5 1 3 3 3 4 3 4 7
Lithology 0.5 0.33 1 3 2 3 4 4 7
Aspect 0.33 0.33 0.33 1 2 2 1 2 4
Land cover 0.25 0.33 0.5 0.5 1 2 2 2 3
Distance from road 0.33 0.25 0.33 0.5 0.5 1 2 1 4
Distance from fault 0.33 0.33 0.25 1 0.5 0.5 1 2 3
Distance from river 0.25 0.25 0.25 0.5 0.5 1 0.5 1 3
Elevation 0.14 0.14 0.17 0.25 0.33 0.25 0.33 0.33 1
Weights 0.243 0.218 0.167 0.089 0.080 0.065 0.063 0.049 0.023
Consistency ratio (CR) =0.04
Table 2. Pairwise comparison matrix of scores for calculating weights
After obtaining weight of each parameters, they is multiplied in the map calculated by frequency ratio and fuzzy membership and the result of them is show in the below figure in the Fig 4.
Figure 4. FAHP maps of input data layers
At the end maps obtained using FAHP of the each factor was incorporated to have the landslide hazard zonation map based on the most susceptible fuzzy operator (Malekian et al, 2012)
(3)
Where is the fuzzy membership function for its map, and
i = 1, 2... n maps are to be combined(zimerman,1996). Then, the final map was classified into five classes based on standard deviation (Fig 5)
Figure 5. Landslide susceptibility maps Validation
Figure 6. ROC curve for the susceptibility maps produced in this study
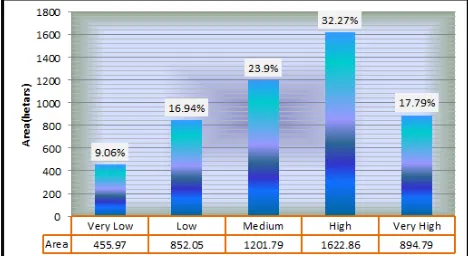
Result of this final landslide susceptibility map is shown in the Fig 7
Figure7. Histogram of calculated landslide susceptibility
map showing the relative areas for each susceptibility class ((susceptibility classes are labelled with the percent of total
area accordingly
in According to Fig7 about 51 percent (2517 ha) of the study area fall into the high and very high .In addition about 27% of total area fall into the low and very low susceptibility zones which covers approximately about 1308 hectares of study area.
3. CONCLUSION
Landslide is one of environmental phenomenon’s, which sometimes occur in some parts of Golestan province. Therefore, creation of one regional strategy is very necessary to reduce its damages and maintains natural and human resources. In this study, based on Fuzzy Logic, Frequency Ratio and Analytical Hierarchy Process model and nine data layers the landslide susceptibility in the Dozein basin was assessed, then using ROC, curve these results were verified. The validation results showed that the area under the curve for this study is 7354. The assessment results show that the relatively safe areas that more than 51 % of landslides are distributed in the “very high” and “high” areas, while less than 27 % of landsides occurred in the “Very low” and
“Low” areas. According to Landslide susceptibility map, most agriculture (residential areas) together with the pasture fall in both very high and high susceptible zone, and most of very low and low class fall into dense forest area that indicating that human activities played an important role in the landslide occurrence. Therefore, the results of such studies can be used for mitigating the hazard and is very helpful to planners and engineers for choosing suitable locations to carry out developments. To prevent or reduce the risks of landslide in the study area, it is recommended to prevent of degradation and change in natural vegetation.
REFERENCES
Ayalew L, Yamagishi H, Ugawa N., 2004, Landslide susceptibility mapping using GISbased weighted linear combination, the case in Tsugawa area of Agano River, Niigata Prefecture, Japan. Landslides 1(1):73–81
Ayalew L,Yamagishi H., 2005, The application of GIS-based logistic regression for landslide susceptibility mapping in the Kakuda–Yahiko Mountains, Central Japan. Geomorphology 65(1/2):15–31
Bonham-Carter GF., 1994, Geographic information systems for geoscientists, modeling with GIS. Pergamon, Oxford, 398 pp
Brabb, E.E., 1984. Innovative approaches to landslide hazard mapping. Proceedings of Fourth International. Symposium on Landslides, Toronto, pp. 307–324.
Brenning, A., 2005. Spatial prediction models for landslide hazards: review, comparison and evaluation. Natural Hazards and Earth System Sciences 5, 853–862.
Caniani D, Pascale S, Sado F, Sole A., 2008, Neural networks and landslide susceptibility: a case study ofthe urban area of Potenza. Nat Hazards 45:55–72
Carrara A., 1983, A multivariate model for landslide hazard evaluation. Math Geol 15:403–426
Champati ray,P.K; Dimri, Suvarna; Lakhera, R. C.; Sati, Santosh., 2007 Fuzzy-based method for landslide hazard assessment in active seismic zone of Himalaya; Landslides, 4:101–111
Cheng Z, Wang J., 2007, Landslide hazard mapping using logistic regression model in Mackenzie Valley,Canada. Nat Hazards 42:75–89
Creighton R., 2006, A Report of the Irish Landslides Working Group; Geological Survey of Ireland 2006;pp1-109
Dai FC, Lee CF, Li J, Xu ZW., 2001, Assessment of landslide susceptibility on the natural terrain of Lantau Island, Hong Kong. Environ Geol 43(3):381–391
DeGraff, J., Romesburg, H., 1980. Regional landslide susceptibility assessment for wildland management: a matrix approach. In: Coates, D., Vitek, J. (Eds.), Thresholds in Geomorphology. George Allen and Unwin, London, pp. 401–414.
(West Black Sea Region, Turkey). Eng Geol 75(3–4):229– 250
Faraji Sabokbar H; Shadman Roodposhti,M; Tazik,E., 2014, Landslide susceptibility mapping using geographically-weighted principal component analysis , Geomorphology, InPress
Fawcett, T., 2006. An introduction to ROC analysis. Pattern Recognition Letters 27, 861–874.
Gee. M.D., 1991, Classification of landslide hazard zonation methods and a test of predictive capability, Landslides, Balkema, Rotterdam, 947- 952.
Greenbaum, D., Tutton, M., Bowker, M., Browne, T., Buleka, J., Greally, K., Kuna, G., McDonald, A., Marsh, S., O’Connor, E., Tragheim, D., 1995. Rapid Methods of Landslide Hazard Mapping: Papua New Guinea Case Study. British Geological Survey. Technical Report WC/95/27.
Hatamifar, R; Mousavi, S.H; Alimoradi, M., 2012., Landslide hazard zonation using AHP model and GIS technique in Khoram Abad City; Geomorphology and environmental planning, 23(3): 43-60
Jordan, C., O’Connor, E., Marchant, A., Northmore, A., Greenbaum, D., McDonald, A., Kovacik, M., Ahmed, R., 2000. Rapid landslide susceptibility mapping using remote sensing and GIS modelling. Proc. 14th International Conference on Applied Geologic Remote Sensing, Las Vegas, pp. 113–120
Kayastha,P; Dhital, M.R; Smedt, F. De., 2013, Application of the analytical hierarchy process (AHP) for landslide susceptibility mapping: A case study from the Tinau watershed, west Nepal; Computers & Geosciences 52, 398– 408
Khezri, Saeed., 2010, Landslide susceptibility in the Zab Basin, northwest of Iran, Procedia - Social and Behavioral Sciences ;19;726-731
Iovine G., 2008, Mud-flow and lava-flow susceptibility and hazard mapping through numerical modelling,GIS techniques, historical and geo-environmental analyses. In: Proceedings of the iEMSs 4th biennial meeting, international congress on environmental modelling ANS software: integrating sciences and information technology for environmental assessment and decision making (iEMSs2008), vol 3, pp 1447–1460
Malekian A., Oftadegan Khuzani A. Ashurnejad Q., 2012, Flood Hazard Zoning in Watershed Scale using Fuzzy Logic (Case study: Akhtar Abad Watershed), Physical Geography Research Quarterly, No. 176, PP. 131-152.
Marston, R., Miller, M., Devkota, L., 1998. Geoecology and mass movements in the Manaslu Ganesh and Langtang-Jural Himals, Nepal. Geomorphology 26, 139– 150.
Mittal, S.K.,Singh, M., Kapur, P.,Sharma, B.K., Shamshi, M.A., 2008. Design nd development of instrument network for landslide monitoring, an issue an early warning. Journal of Scientific &Industrial research 67,361–365.
Nielsen TH, Wrigth RH, Vlasic TC, Spangle WE., 1979, Relative slope stability and land-use planning in the San Francisco Bay region, California. US geological survey professional paper 944
Perriello Zampelli S, Bellucci Sessa E, Cavallaro M., 2012, Application of a GIS-aided method for the assessment of volcaniclastic soil sliding susceptibility to sample areas of Campania (Southern Italy).Nat Hazards 61(1):155–168
Pourghasemi, Hamid Reza; Moradi, Hamid Reza; Fatemi Aghda, said mahmood; Mahdavifar, mohammad Reza; Mohammdi, majid., 2009, andslide Hazard Assessment Using Fuzzy Multi Criteria Decision- Making Method; Iranian Jornal of Watershed Management Science&Engineering, 3(8): 51-62
Remondo, J., Gonzàlez-Diez, A., Dìaz de Teràn, J.R., Cendrero, A., 2003. Landslides susceptibility models utilising spatial data analysis techniques. A case study from the lower Deba Valley, Guipùzcoa (Spain). Natural Hazards 30, 267–279.
Saaty LT, Vargas LG., 2001, Models, methods, concepts, and applications of the analytic hierarchy process. Kluwer Academic, Boston, p 333
Saito, Hitoshi; Nakayama, Daichi; Matsuyama, Hiroshi., 2009, Comparison of landslide susceptibility based on a decision-tree model and actual landslide occurrence: The Akaishi Mountains, Japan; Geomorphology 109 (2009) 108– 121
Shadman Roodposhti.M, Rahimi. S, Jafar Beglou. M., 2012, PROMETHEE II and fuzzy AHP: an enhanced GIS-based landslide susceptibility mapping, Nat Hazards DOI 10.1007/s11069-012-0523-8
Wang L J, Sawada,K; Moriguchi, S., 2013, Landslide susceptibility analysis with logistic regression model based on FCM sampling strategy, Computers &Geosciences57,81– 92