Bart Czernicki
Create a rich, visual platform for
real-time business insights
Silverlight 4
Business Intelligence
Software
Silverlight 4 Business
Intelligence Software
Bart Czernicki
All rights reserved. No part of this work may be reproduced or transmitted in any form or by any
means, electronic or mechanical, including photocopying, recording, or by any information
storage or retrieval system, without the prior written permission of the copyright owner and the
publisher.
ISBN-13 (pbk): 978-1-4302-3060-1
ISBN-13 (electronic): 978-1-4302-3061-8
Printed and bound in the United States of America 9 8 7 6 5 4 3 2 1
Trademarked names, logos, and images may appear in this book. Rather than use a trademark
symbol with every occurrence of a trademarked name, logo, or image we use the names, logos,
and images only in an editorial fashion and to the benefit of the trademark owner, with no
intention of infringement of the trademark.
The use in this publication of trade names, trademarks, service marks, and similar terms, even if
they are not identified as such, is not to be taken as an expression of opinion as to whether or not
they are subject to proprietary rights.
President and Publisher: Paul Manning
Lead Editor: Jonathan Hassell
Technical Reviewer: Ivan Dragoev
Editorial Board: Clay Andres, Steve Anglin, Mark Beckner, Ewan Buckingham, Gary Cornell,
Jonathan Gennick, Jonathan Hassell, Michelle Lowman, Matthew Moodie, Duncan
Parkes, Jeffrey Pepper, Frank Pohlmann, Douglas Pundick, Ben Renow-Clarke, Dominic
Shakeshaft, Matt Wade, Tom Welsh
Distributed to the book trade worldwide by Springer Science+Business Media, LLC, 233 Spring
Street, 6th Floor, New York, NY 10013. Phone 1-800-SPRINGER, fax 201-348-4505, e-mail
[email protected], or visit
www.springeronline.com.
For information on translations, please e-mail
[email protected], or visit
www.apress.com.
Apress and friends of ED books may be purchased in bulk for academic, corporate, or
promotional use. eBook versions and licenses are also available for most titles. For more
information, reference our Special Bulk Sales
–
eBook Licensing web page at
www.apress.com/info/bulksales
.
Contents at a Glance
About the Author ...xv
About the Technical Reviewer...xvi
Introduction ...xvii
Chapter 1: Business Intelligence 2.0 Defined...1
Chapter 2: Advantages of Applying Business Intelligence 2.0 Using Microsoft
Silverlight...27
Chapter 3: Silverlight as a Business Intelligence Client ...53
Chapter 4: Adding Interactivity to Business Intelligence Data...97
Chapter 5: Introduction to Data Visualizations ...135
Chapter 6: Creating Data Visualizations for Analysis...175
Chapter 7: Enhancing Visual Intelligence in Silverlight ...219
Chapter 8: Applying Collective Intelligence ...251
Chapter 9: Predictive Analytics (What-If Modeling)...283
Chapter 10: Improving Performance with Concurrent Programming ...317
Chapter 11: Integrating with Business Intelligence Systems ...367
Chapter 12: Mobile Intelligence ...391
Chapter 13: Surfacing Silverlight Business Intelligence in SharePoint ...423
Chapter 14: Using the Silverlight PivotViewer ...443
Appendix A: Prototyping Applications with Dynamic Data ...473
Appendix B: Creating a Bullet Graph User Control ...487
Contents
About the Author... xv
About the Technical Reviewer ... xvi
Introduction ... xvii
Chapter 1: Business Intelligence 2.0 Defined ...1
The Need to Make Better Decisions...1
Decision Support Systems...2
Business Intelligence Is Born...3
Business Intelligence Defined ...4
BI Terms ... 4
Architecture of a Business Intelligence System ...6
Component Overview of a BI Architecture... 6
Business Intelligence 1.0 Implementation...12
BI 1.0’s Intended Audience... 12
Applications ... 14
System Design... 18
Business Intelligence 2.0 Implementation...18
How BI 2.0 Came to Be ... 19
BI 2.0’s Intended Audience... 21
Applications ... 23
System Design... 24
Comparison of Business Intelligence 1.0 and 2.0...25
Chapter 2: Advantages of Applying Business Intelligence 2.0 Using Microsoft
Silverlight ...27
Industry Trends...28
Delivery to Multiple Platforms ... 28
Value in Services ... 31
Virtualizing Resources on the Cloud ... 31
What Is Silverlight?...33
The Silverlight Solution... 33
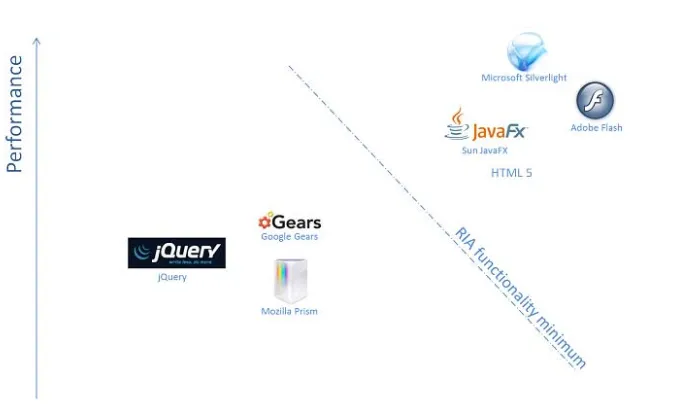
Silverlight vs. Other RIA Technologies...39
Current State of RIA Technology... 39
Silverlight’s Position Among RIAs... 41
Silverlight vs. HTML 5... 42
Silverlight: The Business RIA ...44
Lessons from the Past ... 45
Leveraging Existing Development Investments... 45
Moving to the Cloud More Easily ... 45
Integrating with Microsoft Products ... 46
Overcoming Silverlight’s Weaknesses... 48
The Microsoft Business Intelligence Platform and Silverlight ...48
SQL Server BI... 48
Microsoft Office BI ... 49
What Does Silverlight Have to Offer BI? ... 49
Summary ...50
Chapter 3: Silverlight as a Business Intelligence Client ...53
Client Distributed Architecture ...54
Distributed Architectures Defined ... 54
Problems with N-Tier Architecture ... 56
Is Business Intelligence on the client viable?... 60
Business Logic on the Silverlight Client ... 66
Common Scenarios Handled with Silverlight...70
Coding Scenario: Working with Business Data... 71
Coding Scenario: Decoupling Business Algorithms... 79
Coding Scenario: Persisting Local Data... 87
Summary ...96
Chapter 4: Adding Interactivity to Business Intelligence Data ...97
User Interactivity...98
Importance of Good User Interactivity ... 98
Touch Interactivity ... 98
Silverlight and Interactivity Support ... 100
Interactivity with Business Intelligence Data...101
Types of Data Interactivity... 101
Applying Interactivity in Business Intelligence with Silverlight ...105
Common Silverlight Controls for Data Lists... 105
Coding Scenario: Lazy Loading List Box Data... 108
Coding Scenario: Interactive Data Paging with the Slider Control... 119
Coding Scenario: Fluent Data Filtering with the Slider Control ... 127
Coding Scenario: Searching Data with the AutoCompleteBox Control ... 130
Summary ...133
Chapter 5: Introduction to Data Visualizations ...135
What Are Data Visualizations? ...136
Characteristics of a Data Visualization ...137
Respect the Data ... 137
Simple and to the Point ... 138
Animations and Transitions ... 139
Widgets and Dashboards... 142
Data Visualizations and Business Intelligence 2.0...142
BI for the Masses... 142
Controlled Analysis ... 142
Ease of Use... 142
Rich Interfaces... 143
Challenges of Implementing Data Visualizations...143
Custom Controls ... 143
Need for Designers... 143
Reinventing the Insight Wheel... 144
Presenting Proper Insight ... 144
Not Knowing the Target Audience ... 144
Data Visualizations Might Not Be Enough... 144
Data Visualizations and Silverlight ...145
Out-of-the-Box Data Visualizations ... 145
Rich Rendering Engine and Design Tools ... 146
Data-Centric Processing... 147
Integration with Microsoft Enterprise Services ... 148
Descry Framework ... 149
Coding Scenarios...151
Chart Data Visualizations... 151
Building a Tag Cloud... 158
Using Geographic Visualizations... 164
Summary ...174
Chapter 6: Creating Data Visualizations for Analysis ...175
Choosing a Visualization for Analysis ...176
Determining Types of Analysis for Silverlight Visualizations... 179
Word-Sized Chart Visualizations...206
Types of Word-Sized Chart Visualizations ... 206
Other Candidates for Word-Sized Charts... 217
Summary ...217
Chapter 7: Enhancing Visual Intelligence in Silverlight...219
Workflow Visualizations...220
Workflows in Silverlight... 221
Using Graphical Symbols ...222
Creating Graphical Assets ... 223
Visualization Layout... 225
Creating Composite Visuals for Analysis ...227
Creating a Cross-Tab Data Visualization ... 227
Silverlight Cross-Tab Implementation ... 228
Improving the Implementation ... 234
Visualizations for the Environment ...236
Comparing Non-Silverlight Solutions...238
Other Development Environments ... 239
Visual Intelligence Vendors ... 239
Silverlight as a Visual Intelligence Engine ... 240
Coding Scenario: Providing the User Visualization Options ...240
Lessons Learned... 249
Possible Improvements ... 249
Summary ...250
Chapter 8: Applying Collective Intelligence ...251
What Is Collective Intelligence?...252
Collective Intelligence and Web 2.0... 252
Collective Intelligence as BI 2.0 Applied... 257
Collecting and Displaying User Content...259
Collecting User-Generated Data . ... 260
Displaying User-Generated Data . ... 265
Example of Collective Intelligence in Blogs . ... 268
Collective Intelligence UIs with Silverlight. ... 269
Collective Intelligence in the Enterprise . ... 270
Coding Scenarios...271
Coding Scenario: Working with the Rating Control. ... 271
Summary ...281
Chapter 9: Predictive Analytics (What-If Modeling) ...283
What Is Predictive Analytics? ...284
Predictive Analytics Overview . ... 284
Delivering Predictive Analytics Faster with BI 2.0 . ... 288
Choosing Correct Data Sets for Predictive Models . ... 290
Implementing the Proper Tier for Predictive Analysis . ... 290
Benefits of Applying Predictive Analytics ...291
Bringing Out Additional Value to Existing Data . ... 291
Translating Assumptions into Decisions. ... 292
Being Proactive Instead of Reactive . ... 292
Gaining Competitive Advantage. ... 293
Applying Forward-Looking Models in Silverlight ...293
Using a Functional Language (F#) . ... 294
Designing Predictive Models Using Silverlight . ... 294
Deployment Using the Plug-In Model . ... 301
Coding Scenario: Applying a Statistical Model to Predict Future Behavior ...301
Part 1: Creating the UI and Applying a Static Predictive Model. ... 303
Part 2: Creating an Interactive and Visual Predictive Model. ... 311
Possible Improvements ... 316
Summary ...317
Chapter 10: Improving Performance with Concurrent Programming...317
Concurrent Programming Defined ...318
Processor Architecture Shift to Multiple Cores... 318
Taking Advantage of Multicore Architectures ... 321
Multithreading vs. Parallelism ... 322
Silverlight Concurrent Programming Features ...327
Multithreading Support... 327
Concurrency and Rendering ... 334
Silverlight Concurrent Programming Limitations ... 337
Coding Scenarios...340
Coding Scenario: Improving the Performance of the UI... 340
Coding Scenario: Improving Computational Processing Performance ... 352
Additional Coding Scenarios on the Companion Web Site... 365
Summary ...365
Chapter 11: Integrating with Business Intelligence Systems ...367
Architecting for Business Intelligence Systems ...368
Infrastructure and Software Requirements ... 368
New BI 2.0 Applications... 373
Integrating with Existing BI Investments ... 375
Silverlight in the SaaS Model...380
SaaS for BI... 380
SaaS Features Implemented in Silverlight ... 380
Summary ...389
Chapter 12: Mobile Intelligence ...391
What Is Mobile Intelligence?...392
Silverlight Mobile Intelligence Platforms ...394
Windows Phone 7 ... 395
Windows XP OS and Windows 7 OS Tablets... 397
Windows Embedded Compact 7... 398
Other Platforms ... 398
Implementing Silverlight Mobile Intelligence ...399
Adding Interactivity... 399
Word-Sized Visualizations ... 401
Mobile Dashboards... 402
Leveraging Microsoft Services and Components ... 404
Coding Scenarios...404
The Bing Maps Silverlight Control on Windows Phone 7... 404
Concurrent Programming on Windows Phone 7... 410
Summary ...421
Chapter 13: Surfacing Silverlight Business Intelligence in SharePoint ...423
Why SharePoint for Business Intelligence? ...424
SharePoint 2007 Business Intelligence Capabilities... 424
SharePoint 2010 Business Intelligence Capabilities... 425
SharePoint 2007 and Silverlight Integration ...427
Object HTML Tag ... 427
Custom Web Parts ... 428
SharePoint 2010 and Silverlight Integration ...430
Implementing Silverlight Business Intelligence Scenarios in SharePoint...434
Adding Silverlight to an existing SharePoint BI SharePoint Site... 434
Exposing Complete Silverlight BI tools in SharePoint... 435
Communication Between Silverlight Web Parts ... 437
Coding Scenarios...438
Summary ...442
Chapter 14: Using the Silverlight PivotViewer...443
What Is the PivotViewer? ...444
Which Pivot Technology Is this? ... 444
PivotViewer Components & Architecture... 446
Installing the PivotViewer Platform ... 447
Running the Sample Silverlight PivotViewer Application... 448
PivotViewer User Interface ...449
PivotViewer User Interface Components ... 449
PivotViewer Collections ... 458
PivotViewer and Business Intelligence 2.0 ...471
Summary ...472
Appendix A: Prototyping Applications with Dynamic Data ...473
Blend’s Dynamic Data Tools ...473
Defining New Sample Data... 474
Customizing Sample Data Sources... 476
Customizing Properties... 479
Customizing Collections ... 479
Generating data from image collections... 481
Behind the Scenes of Dynamic Data...483
Autogenerated Files... 483
Using the Dynamic Data ... 485
Summary ...486
Appendix B: Creating a Bullet Graph User Control...487
What Is a Bullet Graph? ...488
Using the Bullet Graph to Gain Business Intelligence Insight ... 490
Comparing the Bullet Graph to Traditional Gauges ... 492
Implementation Roadmap ... 495
Mashing Up the Control with Silverlight Controls ... 497
Creating a Fluid Layout... 499
Bullet Graph Configuration Properties ... 504
Implementing the Bullet Graph in Silverlight ...514
Bullet Graph Layout and Adding Main Components ... 514
Styling Qualitative Ranges & Adding Dynamic Content ... 519
Implementing Dependency Properties & Design-Time Logic ... 526
Using the Bullet Graph Control ... 531
Alternate Implementations ... 532
Summary ...533
Bart Czernicki is a senior technologist focusing on Rich Interactive Applications and Business Intelligence. Bart is currently employed as a software architect, focusing on bringing business intelligence tools to life using cutting edge technology. Most recently, Bart championed the Silverlight platform across the organization as the foundation for the next-generation set of business intelligence products.
Bart has had a strong online presence for the last several years. He has
authored numerous technical articles on www.silverlighthack.com and other sites.
He remains active as one of the leading contributors to the Silverlight community on www.silverlight.net. Recently he started a web site that will bring BI 2.0 and
Silverlight together www.silverlightbusinessintelligence.com.
About the Technical Reviewer
Ivan Dragoev has over 10 years practical experience in the sphere of information technology and in particular, the Microsoft technologies. He participates in the designing of many enterprise applications in different domains—from building to health services. Four years ago Ivan made his own IT company, which aims to be proactive and to offer its clients innovative integral solutions, based on the
Microsoft technologies. He is a co-founder of www.silverlightshow.net—a
Introduction
It is a very exciting time to be in the software development industry. The governing concepts of developing software are changing and rapidly evolving before our eyes. Skills and frameworks that you may have used even just two years ago could very well be considered obsolete and replaced with
something more efficient. This is why software vendors and the developers of engineering products need to stay on top of emerging technology concepts in order to remain competitive.
Two technologies that are experiencing exponential growth and are quickly becoming in demand are business intelligence (BI) and rich interactive applications (RIAs). Knowing how to use and
implement either of these technologies will be vital in order to develop modern-looking applications in the near future. More importantly, learning how to use BI concepts and bringing them to life with RIA technology will allow you to deliver superior software that is a cut above the competition.
The first core technology this book focuses on is BI. BI can be simply defined as delivering key insight quickly from large data repositories. This information can be presented in the form of reports, charts, analytical aggregates, data grids, and so on. Until recently, BI deployments have not been cheap and often required expensive hardware and enterprise-scale software to perform complex data
calculations. Furthermore, the tools that presented BI information were geared for people with a background in number crunching (statistical analytics). This really limited the scope of BI because in order to use BI tools, you had to have a good understanding of the numbers you were looking at in order to analyze them properly. BI technology’s steep learning curve limits its adoption to larger enterprise organizations. Just like any other technology, BI is maturing as a platform and adopting new concepts from emerging software development methodologies.
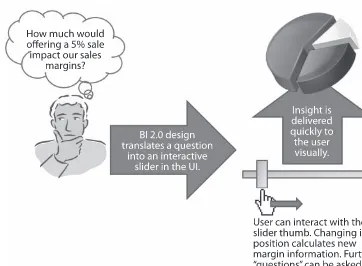
Business intelligence 2.0 (BI 2.0) is improving the way we design and implement BI applications. BI 2.0 is essentially all about bringing technical wisdom to the average user quickly without having to deploy a monolithic infrastructure and not requiring a deep understanding of analytical tools. Therefore, to accomplish this, the visual implementation needs to be simple and easy to understand. In addition, a BI 2.0 application also needs to be lightweight and easy to deploy. A typical user will simply reject anything that takes serious time to download or is packaged in a complex installation. Simple software design and making the analytical tools not feel like business tools broaden the scope of the BI audience beyond technical users.
The second core technology this book focuses on is the rich interactive application (RIA). RIAs are a class of web applications that bring a desktop-like experience to the end user. RIAs are generally superior web user interfaces (UIs) because they can bring additional animations, transitions, and computational processing on the client workstation at much greater speeds than HTML or Ajax. Furthermore, RIA technologies such as Microsoft Silverlight and Adobe Flash/Flex are lightweight and can be fully tailored for ease of use. This makes RIAs ideal UI solutions for architecting applications that need to present complex analytics in BI 2.0 applications.
familiar with BI 2.0 or Silverlight. Next, we will proceed to look at how we can utilize key RIA features like interactivity, animations, visualizations, and client processing in BI 2.0 implementations. The following sections will show you how to bring a Silverlight BI application to life and make it easier for the user to understand. In the latter part of this resource, we will cover emerging technologies like collective intelligence and predictive analytics which are becoming important in BI 2.0 software delivery.
Who Should Read This Book?
Anyone who is interested in applying BI 2.0 concepts using cutting-edge visualization technology like Silverlight should net great value from reading this book. This book is written with an “introduce, then apply concept” philosophy. Chapters 2 through 11 introduce the BI 2.0 concepts and show how they are applied in Silverlight. Coding exercises can be found in a majority of these chapters to further reinforce the introduced topics. Non-technical users will be able to follow along the scenarios and interact with the final coding scenario end product by leveraging the companion web site. The companion web site includes many of the coding scenario applications running live directly on the web not requiring any development environment.
Silverlight Developers or Architects
Developers who are familiar with Silverlight usually need to apply the fundamentals they have learned
into a line-of-business (LOB) application. This book allows developers to see how Microsoft Silverlight
can bring a technology concept to life with its unique RIA features. This is a very important distinction from most Silverlight books out there which tend to concentrate on the Silverlight fundamentals and basic use of the developer tools. This book jumps straight from the concept chapters (Chapters 1 and 2) right into Silverlight BI features in Chapter 3 (i.e., You are out of luck if you want to see a chapter on how to draw a button on a canvas). This book aims to be unique by showing you features in Silverlight used in practical ways to apply BI 2.0 concepts. Silverlight developers will benefit from the C#/Silverlight coding exercises and follow along to learn how to create BI components. Lastly, developers who aren’t familiar with BI 2.0 will gain valuable domain knowledge of the business side of BI implementations.
This audience will achieve the following goals by reading this book:
• You’ll receive important business domain knowledge about BI.
• You’ll be exposed to BI 2.0 fundamentals.
• You’ll see how Silverlight can be applied to LOB applications beyond the basics.
BI Professionals
written with the broader target in mind and can be understood without a deep understanding of Silverlight or C#.
In sum, this audience will achieve the following goals by reading this book:
• You’ll be exposed to the Microsoft Silverlight RIA technology.
• You’ll learn how RIA functionality can extend BI by making tools simpler and
more interactive.
• You’ll see how next-generation BI makes some of the tools you currently use
obsolete.
Strategic Decision Makers in Technology
Executive-level professionals who have an interest in BI can net a different perspective from understanding the topics covered in this book. This is a real exciting time when these relatively new technologies are coming together and will leverage each other in reshaping next-generation BI software. This book aims to provide senior management with the key strategic ideas and fundamentals to be able to gauge the use of new BI concepts in their deliverables. Decision makers do not have to be part of a BI software vendor to get a valuable return from this information. For example, you may have an existing product that you want to enhance with next-generation BI. This book is the guide that can provide ideas on how to achieve that. It goes without saying: the content provided in this book aims to include cutting-edge material, and senior managers should be able to utilize it to gain a competitive advantage.
By reading this book, this audience will achieve the following goals:
• You’ll learn how to take advantage of Silverlight with BI 2.0 to form a competitive
advantage in terms of content, delivery, and adoption.
• You’ll amass ideas on possibly extending current applications with lightweight
Silverlight BI modules.
• You’ll understand how simple, interactive, and easy-to-learn analytical tools can
broaden the audience of BI products.
Technical and Nontechnical Audiences
The preceding list may leave you scratching your head, as few technical books can claim that they can effectively target a broader audience beyond a technical reader (i.e., developer or architect). If you fall into the nontechnical audience, you may be rightfully skeptical by my claim that this book is right for you. How do I plan on targeting a nontechnical audience? The key word I want to focus on in the first
statement in this paragraph is effectively. In a nutshell, this book aims to cover the implementation of
business concepts applied with a technical framework. Therefore, at a high level, I plan on striking a balance between the BI 2.0 concepts and the technical Silverlight content.
The following list describes the details of how this book strikes a technical and nontechnical balance:
• Beginning with the Chapter 2, each chapter has an introduction that explains how
• For each chapter, takeaway goals will be provided for the three different audiences.
• Working demos of the examples are provided on the companion website
(www.silverlightbusinessintelligence.com). For nontechnical readers that cannot build the source code using Visual Studio, they can simply navigate to the link provided and interact with working examples.
• Before jumping blindly into exercises, I explain the approach being taken in the
implementation using language you would normally hear during a functional/design meeting.
• Each chapter includes notes, sidebars, and most importantly, visuals that will help
guide you in understanding the information as well as relating it to concepts that you may have used many times previously.
■
Note
The Internet includes numerous open-source resources that will act as additional resources that amplify
the core content in this book.
I believe that my having written this book with those features in mind allows its scope to go beyond just a technical audience. Obviously, technical consumers of this book who are familiar with Silverlight fundamentals will be able to take additional advantage of this book, as they will be able to follow along with the technical exercises. However, as you can see, I have taken the business audience into serious consideration when choosing the material to cover. The technical audience that invests in this resource will broaden their business intelligence knowledge. Conversely, the non-technical audience will learn about how Silverlight can be leveraged for business intelligence scenarios.
Why Should You Invest in This Book?
I am the epitome of someone who loves to harvest more and more information about technology. In my opinion, there is not enough time during the day to soak in all the information available! I love to get valuable information from any resource, whether it’s a book, a periodical, the Internet, a webcasts, or anything else. Each resource has its benefits and flaws. For example, the Internet is a great resource to get the most up-to-the-minute information and updates to anything. However, much of the information on the Internet tends to be poorly researched, and the Internet has a high rate of providing incorrect information. Furthermore, it is very hard to find complete technical or deep business concepts on the Net. A book, on the other hand, has a well-researched foundation, and the information tends to have fewer errors. However, books that focus on technologies rather than overall concepts tend to be
Chapter Roadmap
Chapter 1 is an introductory chapter to BI. This chapter will introduce BI and the new wave of BI 2.0. It will show how BI is evolving and embracing new software development advancements. This chapter will contrast classic BI and BI 2.0 by showing numerous examples of current software offerings. Lastly, this chapter will define the core concepts of BI 2.0 that will be implemented throughout this book using Silverlight.
Chapter 2 introduces the Microsoft RIA technology: Silverlight. This chapter is dedicated to analyzing the current Microsoft BI product offering and providing opinions on why Silverlight is a good fit for implementing BI tenets. After reading this chapter, you will understand the key enterprise and business integration features of Silverlight that will be discussed in this book.
Chapter 3 looks at what makes an effective BI client. It goes on to specifically detail Silverlight tools and features that can be used to create a fantastic functioning analytical experience. The chapter goes into specific functionality such as LINQ data queries, business algorithm implementations, and local storage.
In Chapter 4, the information from the previous chapters is used to show how to use Silverlight to bring interactivity to BI applications. This chapter will teach by example on how to add simple interactions that can make a BI client easier to use and feel more fluid. It concludes with how these concepts can be leveraged for future designs with multitouch screens to create the ultimate interactive experience.
Chapter 5 is the first chapter in a series of chapters about visual intelligence. The content in this chapter will show the empirical advantages of creating a visual representation of data (data
visualizations) versus classic tabular layouts. This chapter shows how visualizing data has matured and grown over the last several years. The concept of natural visualizations is introduced by defining the different characteristics and Silverlight implementations.
Chapter 6 continues to build on the visual intelligence topic by showing how to enhance data visualizations with features to turn them into analytical tools. This chapter will show you how to create advanced visualizations by extending the default Silverlight data visualization presentation.
Chapter 7 is the last chapter that focuses on creating complex composite data visualizations. You will also see how Silverlight as a professional visual intelligence environment can implement BI 2.0 functionality.
Chapter 8 introduces collective intelligence as a form of social BI. This chapter defines the
importance of collective intelligence on the Web today. Furthermore, you will see how Silverlight can be used to gather collective intelligence and surface it to users.
Chapter 9 will describe how to integrate forward-looking data structures into your client logic to perform what-if scenarios. This chapter will also show how statistics used on aggregates can deliver instant insight on future events.
Chapter 10 is an advanced chapter that covers additional enhancements that can be gained by using multiple cores to aid in BI calculations. You will see how you can enhance the performance of BI
modules by leveraging Silverlight’s advanced CPU and GPU programming features.
Chapter 11 will show you how to apply the concepts that you have learned and integrate them into new solutions or existing BI systems. This chapter covers Silverlight in a SaaS delivery model as well as Silverlight web parts.
Chapter 12 introduces mobile intelligence as a paradigm for delivering business intelligence to mobile and tablet devices. In this chapter, you will apply the knowledge in the previous chapters towards the Windows Phone 7 development environment.
Chapter 14 focuses on the Silverlight PivotViewer control. This section will show you a great example of how Microsoft is utilizing a highly interactive and visual PivotViewer control to deliver business intelligence insight.
Appendix A includes a short primer on prototyping data applications in Microsoft Expression Blend 4. This short section provides a quick overview on how to use Blend’s dynamic data feature to quickly create and add data to UI functionality without having to spend time architecting databases and services. This is a powerful tool to prototype BI 2.0 analytical modules without needing access to large-scale data repositories.
Appendix B demonstrates how to create a bullet graph user control. This control has several advantages over a traditional business intelligence gauge visualization and you will see how to easily create one in this section.
What Is
Not
Covered in This Book?
This book is intended to be a BI 2.0 concept book applied using Silverlight technology. Obviously, not every possible aspect and feature of BI can be covered. This book strictly focuses on delivering intelligence to the end user. Therefore, middle-tier and back-end BI concepts like data warehousing, master data management, service orientation, ETL, and so on are not covered. While those concepts are very important, they are well beyond the scope of this material. Furthermore, important Silverlight architectural concepts like the MVVM design pattern, Management Extensibility Framework (MEF), PRISM are not covered either. I felt this would overcomplicate even simple scenarios.
This book covers the core information of BI 2.0 and has step-by-step instructions on how to create the examples included. However, this book is not meant to be a substitute for an introduction to either technology (Silverlight or BI). If you are a Silverlight novice, you may need to supplement your
knowledge with some of the many resources available to gain a solid foundation of the Silverlight framework.
Why Aren’t Data Services Covered in This Book?
As just mentioned, data services are not covered in this book. Data services are an integral part of BI applications, and without them, you cannot deploy a proper Silverlight BI solution. So why isn’t the data service layer covered in this book?
Microsoft Silverlight version 4 has several data access methods that allow for consuming data services. Unfortunately, Microsoft is quickly evolving these methodologies in a LOB framework called WCF RIA Services which is based on ADO.NET Data Services. WCF RIA Services is scheduled to be released in the summer of 2010. Furthermore, the Visual Studio 2010/.NET 4.0 development stack improves data access methodologies with enhancements to the OR/M (object/relational mapping), WCF REST–based design, asynchronous programming, and ADO.NET Services. Therefore, I felt it was not correct to write a book showing best practices of BI data access when the technologies were evolving rapidly and would be fundamentally different in a matter of months.
■
Note
If you are familiar with BI and want additional clarification on what BI tier is covered, please see Chapter
1.
Following the Coding Exercises in the Book
This book includes many technical exercises that aim to reinforce key principles of BI.As aforementioned, you don’t need to follow along with all of the exercises to net all the knowledge from this book, as all of the examples are online on the companion web site. This allows non-developers to follow along with the concepts implemented in this book without having knowledge of compiling source code. This amplifies that this book is a resource for more than just developers, as most books only provide source code that requires development knowledge.
■
Note
If you would like to see the available demos online, go to
www.silverlightbusinessintelligence.com/demos.aspx
If you are not a developer or do not want to go through manually coding the exercises, you will see links provided before each coding scenario or sample with a direct link to the demonstration.
■
Note
Not all of the coding scenarios are available as demos on the companion site to this book. The Windows
Phone 7 examples require an active emulator, which cannot be run on the web. Furthermore, the SharePoint 2010
examples would require a SharePoint 2010 Internet site, which I do not host.
Software You Need to Follow the Exercises
If you are a developer and would like to compile and follow the exercises, you will need the following core Silverlight development software:
• Visual Studio 2010 (Any of the Express, Premium, Ultimate, or Team System
versions will work.). Visual Studio 2008 cannot be used for Silverlight 4 development.
• Silverlight 4 SDK and Visual Studio 2010 Developer Tools
• Silverlight Control Toolkit (April 2010 release or newer)
Links to this core Silverlight development software are updated constantly. The main page for
getting started with Microsoft Silverlight, at http://silverlight.net/getstarted, provides a complete
set of links to install all the required components.
In addition to the core Silverlight development software above, the Delivering Mobile Intelligence with Silverlight (Chapter 12) requires the following software:
• Windows Phone 7 Developer Tools (includes Expression Blend for Windows
Phone)
Links to this Windows Phone 7 software are updated constantly. The main page for getting started
with Windows Phone 7 development, at http://developer.windowsphone.com, provides a complete set of
links to install all the required components.
In addition to the core Silverlight development software, the Silverlight Business Intelligence in SharePoint 2010 (Chapter 13) requires the following software:
• SharePoint 2010 development tools for Visual Studio 2010 installed
• SharePoint 2010 Server installed
In addition to the core Silverlight development software, the Working with Pivot Collections (Chapter 14) requires the following software:
• Silverlight PivotViewer control, which can be downloaded at
www.getpivot.com/silverlight
■
Note
While Visual Studio 2010 Express Editions, Silverlight 4 SDK, Silverlight Control Toolkit, and the Silverlight
4 runtime can be attained for no cost, Expression Blend 4 is a rather expensive product. There are a couple of
different ways I would recommend acquiring this at minimal cost to you. As of this book’s publication, Microsoft
offers a 60-day trial of its Expression Blend product. This will probably satisfy the need to access Expression Blend
4 for the duration of reading this book. Expression Blend 4 is also provided with some of the higher-tier MSDN
subscriptions. If you are a paying subscriber, please feel free to download the product from the MSDN site.
Also, all of these exercises can be done in other ways without the Expression Blend tool. Furthermore, in Visual
Studio 2010, the designer provides a rich design canvas for Silverlight applications. However, I have decided to
use Expression Blend for the visual and prototyping exercises in this resource. In addition, Expression Blend is a
first-class design tool, and it is necessary for delivering enterprise-level applications.
Companion Web Site
learn by seeing the implementations of the material with live examples. The companion web site is
located at www.silverlightbusinessintelligence.com.
Figure Intro-1. The main page of the companion site for this book
The companion site includes several key important resources:
• A blog that includes updated articles related to the material covered in this book
• A page that contains live demonstrations of coding scenarios and samples of
Silverlight business intelligence tools
• Updated source code for the book
• An external resources page, which includes many links to books, articles and
samples on the web for business intelligence
• An errata & best practices page that includes any changes, updates and fixes to the
content that has been published
What about Silverlight 3 Support?
Many of the principles, conventions, code and best practices will apply to the Silverlight 3 development environment. Version 1.0 and 2.0 of the source code on the companion site is compatible with Silverlight 3 and Visual Studio 2008. It does not include all of the examples covered in this book. However, almost all of the examples through the first eleven chapters are included in a Silverlight 3 project.
■
Note
The previous edition of the book explicitly targets Silverlight 3 and Visual Studio 2008 explicitly.
Author on the Internet
I have a pretty unique name. Therefore, you can find me on the Internet by doing a simple search. Chances are, if you search my name and you find something that deals with technical content about .NET, you’ve probably found me. In addition, the following list provides my e-mail address and the places I am most active currently on the Internet:
• Name: Bart Czernicki
• E-mail address: [email protected]
• Companion web site: www.silverlightbusinessintelligence.com • Blog/web site: www.silverlighthack.com
• Follow me on Twitter: www.twitter.com/bartczernicki
• Silverlight Business Intelligence on Twitter: www.twitter.com/silverlightbi
Business Intelligence 2.0 Defined
What is business intelligence 2.0? This is the question this chapter aims to answer definitively. Before you dive into implementing the different concepts associated with business intelligence (BI), you need to understand it. This chapter is dedicated to demystifying what constitutes BI. As you will soon see, the
term BI is very loose in that it can be attributed to a series of technologies, data, and practices, which
makes its raw definition very ambiguous. Therefore, the sections of this chapter are designed to build on each other, fluidly progressing with details about BI. After you complete this chapter, the components of BI will become clear and you will have enough knowledge to understand what we will be implementing in the following chapters.
This chapter will cover the following:
• How the success and innovation of decision support systems in large enterprise
deployments laid the foundation for BI
• Definitions of business intelligence 1.0 (BI 1.0) and business intelligence 2.0 (BI
2.0)
• How the challenges of BI implementations helped evolve into BI 2.0
• How to identify the differences between BI 1.0 and BI 2.0
• How BI 2.0 is transforming the intelligence landscape beyond the enterprise
• A comparison of BI 1.0 and BI 2.0
Note
Additional resources to this chapter can be found on the book’s companion site
http://silverlightbusinessintelligence.com/BookResources/ExternalResources/BusinessIntelligence20.aspx.
The Need to Make Better Decisions
If only one term had to be used to describe the competitive business environment, it would be cutthroat.
No matter what the industry or its size, every company is constantly trying to get a competitive
advantage over its adversaries. Companies have been trying to one-up each other for hundreds of years, and this is nothing new, even in current times. One way an organization can attain an edge over its competition is by making decisions that have an increased positive impact and contain less risk.
piece of information could easily affect the case for selecting one decision path. Not too long ago, tough business decisions were made by long-time industry experts who had intimate knowledge of the business. These decisions were largely made on past historical or financial situations and rarely took into account data models. This led to high levels of failure, and some successful decisions could be attributed more to luck than effective decision-making techniques.
Processes for making decisions started to involve computers in the ’60s and ’70s. As the computer revolution started making its way from academia and government projects to mainstream businesses, people started leveraging computers to do continuous number crunching. Computers could process more data, and this eliminated some of the human error factors involved with complex statistics. This is where computers have an empirical advantage over humans, as they are tailored for mathematical computations and can be harnessed to run almost 24 hours per day. However, even enterprise-level computers in those days were not even close to the power of what we are used to today. Most of them couldn’t do much more than today’s programmable scientific calculator. The early horsepower of computer systems had to be specifically tailored for basic mathematical computations on data, as anything complex as artificial intelligence (AI) was completely out of the question.
Organizations quickly saw the benefit of having computer systems aid them in their everyday business processes. Even though the early computers weren’t that powerful, they could be used to garner vast amounts of data and perform complex business algorithms on it. The resultant data could then be used in the boardroom to shape corporate strategies via actionable decisions from executive information systems (EISs), group decision support systems (GDSSs), organizational decision support systems (ODSSs), and so on.
Decision Support Systems
The need for company executives to make better decisions and the rapid evolution of computing power
led to the birth of decision support systems (DSSs). A DSS is a type of computer information system
whose purpose is to support decision-making processes. A well-designed DSS is an interactive software system that helps decision makers aggregate useful information from raw data, documents, and business models to solve problems and make decisions.
While these systems were first implemented in executive circles, they have quickly grown to be used by trained professionals as well. Various remnants of DSS software implementations can be found everywhere from the Internet to your local bank branch. For example, when you go to a bank and apply for a loan, complex DSS software is used to determine the risk to the bank based on your financial history. The result of this information will aid the loan officer as to whether the bank should make the decision to loan you money.
Note
One of the first large-scale implementations of a DSS was the Gate Assignment Display System (GADS).
This DSS was implemented at Chicago’s O’Hare Airport in 1987 in order to reduce travel delays significantly.
Hundreds of computers and servers were used in order to synchronize relevant information from airplane
reservations to displaying flight information to travelers.
the government, and the automobile and health care industries. These systems were very successful and delivered tremendous return on investment.
Early DSS projects, while largely successful, did have some challenges however:
• Customizability: DSS software did not exist in the way it does today. A vendor couldn’t simply download a tool or customize a preexisting system. Usually, these tools had to be designed and programmed from scratch.
• Multiple vendors: Implementations of early DSSs were a mix of software, hardware, servers, networking, and back-end services. In the ’80s and early ’90s, there wasn’t a single company that could provide all of the necessary components of complex systems at once. Multiple vendors usually worked on a single project together on a single DSS implementation.
• Uniqueness: Early DSS software was unique and often the first of its kind. This
usually meant that a great deal of planning had to be done to get concepts moved
from theory into a working information system. Architects and programmers in the early days of DSS couldn’t rely on how-to guides to implement a unique custom system.
• Long deployments: Projects that included custom software and hardware from multiple vendors obviously led to implementations that took a long time to complete.
• Expensiveness: DSS systems in the ’80s and ’90s were very expensive and easily carried budgets of tens of millions of dollars.
DSSs allowed for entire organizations to function more effectively, as the underlying software powering those organizations provided insights from large amounts of data. This aided human decision makers to apply data models into their own decision-making processes.
DSS software at its start was considered a luxury, as only the largest of organizations could afford its power. Since the software was custom and worked with the cooperation of multiple vendors, it was hard to apply these systems as reusable and resalable deployments. Tens of thousands of hours were invested in making these systems come to life. In the process of designing these complex systems, many
innovations and great strides were made in the young software industry. These innovations were screaming to be let out into the wild and used in conjunction with other pieces of software.
The demand for DSS software was ripe and the vendors were beginning to taste the huge amounts of potential profits. If only they could make the software a little more generic and resalable, they could start selling smaller DSS implementations to a much larger audience. This idea led to applying the core innovations of complex DSS software into many smaller principles like data mining, data aggregation, enterprise reporting, and dimensional analysis. Enterprise software vendors started delivering pieces of DSS as separate application packages, and the early seeds of BI were sown.
Business Intelligence Is Born
The new “DSS extension” software ranged from mainframe computers that performed analysis on large numerical data sets to software that created visual reports. Even though the software was provided by a variety of vendors implemented on different hardware and provided various functionalities, it still was being used for the single purpose in aiding business processes.
All of these pieces of software that shared the common goal of what they provided did not have a collective name. Each vendor described its software differently, and this added to the confusion. In 1996, the Gartner Group stamped a label on the collective technology that was being used, calling it business
intelligence. Here is the exact quote from the report: “Data analysis, reporting, and query tools can help
business users wade through a sea of data to synthesize valuable information from it—today these tools collectively fall into a category called ‘Business Intelligence. ”
Note
As of 2001, the Gartner Group is now known as Gartner, Inc. (
www.gartner.com). It is a publicly traded
company that specializes in research of technology concepts. Its specialty areas lie with large companies as well
as the government. Gartner’s research services are used by many executives to gain insight on upcoming industry
trends and in what technologies those executives should be investing.
Business Intelligence Defined
BI defines a category of applications, practices, and presentations that help users make sense of a mountain of data. In my opinion, Gartner’s definition of BI is correct; however, to someone unfamiliar with BI, it still leaves many questions unanswered. BI does not have an explicit definition, and this gives many people a little trouble when trying to comprehend it initially.
In a nutshell, the term business intelligence is an umbrella term for not just applications, but also for
intangible practices and skills that are constantly evolving. Therefore, it is hard to grasp the term properly unless the whole context can be evaluated. Trouble with comprehending BI fully can also be amplified when business users use the term improperly.
Note
The definition of
Internet
is similar to the term
business intelligence
, as it is not simple to define. If you
had to describe to someone what the Internet was, what would you say? You might have been using the Internet
for over a decade and still not be able to properly articulate it in layman’s terms. For example, in 2006, senator
Ted Stevens (Alaska) referred to the Internet as a “series of tubes,” and this led many people to label him as
someone who did not understand technology. In my opinion, his definition is a pretty good one of what the Internet
is at its core. But as you can see with ambiguous or umbrella terms, it is very hard to be correct without the purist
community pointing out a flaw.
BI Terms
section in the Introduction. However, since this book is targeting several audiences that may not have a good grasp of what BI is, I wanted to do it after the intro.
• Business intelligence (BI) in this book refers to the industry concept as a whole,
similar to the way Gartner defined it. The scope of the term business intelligence
includes the software, best practices, data algorithms, and so on that can be used in aiding business users in their work.
• Business intelligence 1.0 (BI 1.0) in this book refers to BI applications, practices,
and so on that have been implemented using a specific feature set (which I will define later in this chapter). Similarly to the way we define software versions, it applies a version of 1.0 to define the feature scope explicitly. BI 1.0 applications have been around since 1996.
• Business intelligence 2.0 (BI 2.0) in this book refers to BI applications, practices,
and so on that have been implemented using a specific feature set (which I will define later in this chapter) leveraging newer software design practices. BI 2.0 is an extension of BI 1.0 and aims to evolve the feature set of BI. Similarly to the way we define software versions, it applies a version of 2.0 to define the feature scope explicitly. Unlike BI 1.0, BI 2.0 applications have just started making their way into the mainstream.
Note
Business intelligence 1.0 is also referred to as
classic business intelligence
, as some of its core
implementation concepts are becoming obsolete. Furthermore, BI 1.0 is being substituted by BI 2.0, and this is
another reason for the “classic” reference.
Note
Business intelligence 2.0 is also referred to as
next-generation business intelligence,
as some of its
principles and tenets are still being refined. Once formally defined, these concepts will be driving next-generation
BI software. This book and the examples and concepts it covers in the chapters ahead will be applying BI 2.0
concepts.
The distinction between the BI terms is very important to understand. Right now, what you should
understand is that the term business intelligence refers to the technology of aiding business users in their
respective organizations. When the term business intelligence is used, it encompasses both BI 1.0 and BI
2.0 implementations. BI 1.0 and BI 2.0, on the other hand, are implementations of business intelligence
Note
The term
BI 2.0
has its roots in the popularity of the semantic term
Web 2.0
. Web 2.0 is discussed in the
“How BI 2.0 Came to Be” section later in this chapter.
Architecture of a Business Intelligence System
At this point, you should understand the core definition of BI and the theory behind the technology. However, understanding a definition of a technology that you may not be familiar with does not mean much. You can only claim to truly understand a technology concept when you start thinking about implementation scenarios. When you start thinking about how you could use it to aid you in your everyday work or how it can improve a business process, then you have grasped more than just the theory behind it.
A fully implemented BI system has a lot of moving data, modules, processes, and components. BI systems tend to be some of the most complex pieces of software implemented in an organization because of the involvement of many disconnected systems. Therefore, an important concept to understand is that a BI implementation is a lot more than just the software that surfaces the BI data to the user.
In order to make this clearer, we will take a look at a mock BI system a consulting company may use. By laying out the high-level architecture, I will show the pieces that go into a complete BI
implementation. Furthermore, you will be able to clearly see how the BI system comes together and why it is fairly complex to implement properly.
Component Overview of a BI Architecture
In this section, we will look at the major components of the BI architecture. The four main tiers of a BI implementation are the data feeds, the extract-transform-load process, the data warehouse, and the presentation layer. The example I decided to use while describing these components is a high-level implementation at some fictitious consulting company.
The consulting industry deals with lots of information on a daily basis. A large consulting company (over 100 consultants) needs to keep track of a great deal of information in order to be efficient and maximize profits. It is hard to attain key insights from different systems with large amounts of data that changes rapidly. This example will show how a consulting company can leverage BI into improving the health of its business.
Data Feeds
A BI system is nothing without a valid data source. When designing a BI system, we first need to determine what data we want to consume for analysis. Most organizations have various information systems that aid them in their day-to-day operations. Internal data from a system that aids in everyday operations of an organization is usually a good candidate for a BI project. Data can also come from external or even public data sources as well. These data sources that provide the information that drives
a BI implementation are referred to as data feeds.
Data feed sources can be anything that provides the required data in a well-structured format. They can be exposed in a variety of formats, such as databases, XML files, CSV files, and even API (application programming interface) service calls. There is no one-size-fits-all format type for a data feed. For example, XML files are good sources for smaller data that doesn’t change much. However, data that changes rapidly and is large might be better sourced from a database. In some cases, the BI architect might not have a choice when consuming external data. For example, if you want to consume public data from a web site that provides guidance on salary information, you may have to use that site’s API. A vendor that provides data as a service is unlikely to make available a backup of its entire database nightly; however, it is more likely to provide an external-facing API as a service.
Figure 1-1 shows three separate feeds going into our BI system. Two feeds are internal and are sourced via database repositories. In addition, we are consuming a web service API data feed on salary information for consultants. We don’t know how the data is getting there, but we have architecturally defined what data we want to consume.
Note
Time entry and HR systems are highly transactional with multiple updates happening every minute. Using
the underlying databases directly as the source for data is not a good idea. The data feed sources need to pull data
that is transitionally accurate, and pulling them from a live system does not guarantee that. Furthermore,
large-scale data pulls can adversely affect the performance of the underlying system.
Most BI implementations use a snapshot or a backup of the data that happens at a given point in time. The
snapshots can be in the form of synchronization that can give an almost real-time feed to the data; alternatively,
snapshots of the data can be taken at monthly intervals. This allows the data feed to “bridge” itself from the
operations and transactions of the system.
Extract-Transform-Load Process
Now that we have isolated the data we want to expose in our BI system, we need a process to move it into our BI platform. This process can be implemented using a multitude of different methodologies. I will focus on a couple of them. The three data feeds make up our global source in this example. We need a process to transform the data and a destination for that transformed data.
The process of converting the data into something usable by BI software is called an
extract-transform-load (ETL) process. The ETL process has a source and a destination. The data feeds are the source and the data warehouse (which I’ll talk about in detail in the next section) is the destination. The name itself gives away the three main components of an ETL process:
• Extract: This refers to the action that performs the extraction of the raw data from
the data feed. For example, for a database, this could be a select statement on a
table. If the data source is an API, this could call a method that extracts all your contractor names.
• Transform: This refers to the action of transforming the data into the required layout in the data warehouse or data mart. This is where the heavy lifting of the ETL process takes place and is usually the part that takes the most time to complete. The data source is rarely in the format that we want for making BI operations easy. Therefore, it is advantageous to perform different types of transforms to prepare the structure of the data in such a way that it can be consumed inside a BI visualization without the need for these complex structural manipulations. Typically, the transform portion of ETL focuses on several main tasks: vertical partitioning, horizontal partitioning, aggregations, and other less time-consuming tasks like sorting or splitting up tables.
Vertical partitioning refers to filtering the data sets and stripping off unwanted rows from the data. For example, if we had information in our data feed that spanned the years 1950 to 2010 and only the last decade were relevant, we could simply avoid processing the older years to the destination.
those columns. The benefit would be that less space would be taken up in our data warehouse.
Aggregation is essentially taking related data for input and returning a single scalar result (e.g., if we wanted to sum up all the hours our consultants worked in a given time period).
• Load: This refers to taking the output of the transformation step and placing it into
the appropriate location in the data warehouse, which could be a database or an in-memory data structure. The transform step “massages” the data structure so that it will easily fit into the destination tables.
Note
In Figure 1-2, note that the example consultant entity is being horizontally partitioned (by removing the No
rows from the IsEmployed column) and vertically partitioned (by removing the City column) before being
transferred into the BI data warehouse.
Note
There are many enterprise ETL tools on the market such as SQL Server Integration Services (which is
included in SQL Server 2005 and 2008) that provide a visual way of designing, debugging, deploying, and
managing data management processes.
Consultant Entity Consultant Entity Modified by ETL Process
Figure 1-2. Example of an ETL transform
The Data Warehouse
The data warehouse is a storage repository for data that is used in BI software. The end result of the ETL process is a data repository that is highly optimized for analysis and querying.
The data warehouse can be the primary repository that communicates with BI tools in the
presentation layer or it can be used as a staging area for further data transformations. For example, from our data warehouse, we could create a set of Analysis Services cubes for multidimensional analysis or create secondary smaller data marts for reporting or querying.
Note
A
hub-and-spoke
architecture includes a central data hub (usually a data warehouse) that feeds data into
separate spokes (usually data marts). The hub is a very large data warehouse that is too cumbersome to satisfy all
of the BI needs. It is used as a staging area and further broken down into smaller data marts, or spokes, that better
satisfy the query needs of BI operations.
The BI Presentation Layer (Presentation of Knowledge)
The presentation layer is a logical tier in the architecture where BI client software is used by the business users. The responsibility of these visual tools is to surface the data cleanly from a data warehouse or data
mart to the user. This tier is sometimes referred to as the presentation of knowledge, as it is responsible
for presenting not just data but insight in an easy-to-consume format.
In a typical BI implementation, usually there isn’t just one type of presentation software used. BI client software includes specific tools for different audiences. For example, a company executive may be interested in a high-level overview of the business and prefer looking at the data in a highly visual format such as a dashboard or a report. Conversely, a financial analyst who is very familiar with the data might prefer the power of a spreadsheet-like format, forgoing some of the simplicity of charts and graphs. This is why most BI software implementations provide a mixed bag of tools that is tailored to not only specific tool functionality but the audience as well.
Presentation tools can take many different forms, including web, desktop, and mobile.
Furthermore, they can be homegrown, custom-developed pieces of software or third-party pieces of software that sit on top of data warehouse structures. For example, Microsoft Performance Point Server is a piece of software that exposes multidimensional data that is found in Analysis Services cubes.
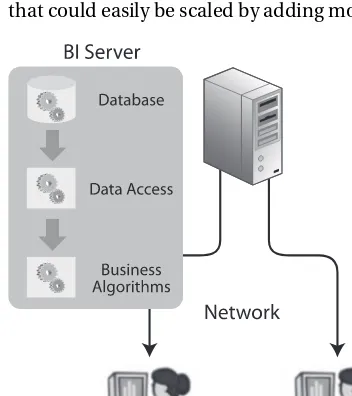
Challenges of Bringing the BI Tiers Together
The four core BI components come together and form a complete BI solution. Each tier plays an important role in keeping the system current and running. As you can probably guess, implementing and maintaining a system like this is not easy and is fairly complex.
Very simple errors in the first tiers could have a ripple effect into the entire system, making pieces of the implementation meaningless. Developing on an existing piece of BI software is not trivial. The BI system has a total of four complex tiers that need to communicate with each other effectively. Adding a business requirement to add another piece of data changes the logic in all four tiers of the
implementation. Figure 1-3 shows the four different tiers that make up the full BI implementation. Handling changes and maintaining a clean BI environment are the two main obstacles facing BI architects in creating a successful BI implementation. Not being able to handle these obstacles
Figure 1-3. The four main tiers of a BI implementation
Business Intelligence 1.0 Implementation
Now that you have a general idea of BI, let’s look at how it was implemented in BI 1.0. As mentioned earlier, BI 1.0 software implementations developed in the late ’90s through the present have shared similar attributes. This has allowed this type of software to be labeled with a 1.0 “version.”
The features of BI 1.0 can be broken down into three main perspectives: the intended audience, applications, and system design. Since the mid-’90s, the BI “version 1.0” concepts have matured and are generally thought of as an accepted standard when talking about BI.
BI 1.0’s Intended Audience
You already know that BI is software that aids business professionals in their everyday work. However, who are the “business professionals” that specifically use BI tools?