IOP Conference Series: Earth and Environmental Science
PAPER • OPEN ACCESS
Interpretation of Self-Potential anomalies for
investigating fault using the Levenberg-Marquardt
method: a study case in Pinggirsari, West Java,
Indonesia
To cite this article: Fajriani et al 2017 IOP Conf. Ser.: Earth Environ. Sci.62 012004
View the article online for updates and enhancements.
Related content
Dry spell frequency in West Java, Indonesia
V I Purnaningtyas, R Boer and A Faqih
-Evaluating solar radiation on a tilted surfaces - a study case in Timis (Romania) C Vasar, O Prostean and G Prostean
-Comparison of INAR(1)-Poisson model and Markov prediction model in forecasting the number of DHF patients in west java Indonesia
Atina Ahdika and Novyan Lusiyana
1234567890
Southeast Asian Conference on Geophysics IOP Publishing
IOP Conf. Series: Earth and Environmental Science 123456789062 (2017) 012004 doi :10.1088/1755-1315/62/1/012004
Southeast Asian Conference on Geophysics IOP Publishing
IOP Conf. Series: Earth and Environmental Science 62 (2017) 012004 doi :10.1088/1755-1315/62/1/012004
Interpretation of Self-Potential anomalies for investigating
fault using the Levenberg-Marquardt method: a study case in
Pinggirsari, West Java, Indonesia
Fajriani, Wahyu Srigutomo, and Prihandhanu M Pratomo
Earth Physics and Complex System Research Group, Faculty of Mathematics and Natural Sciences, Institut Teknologi Bandung, Ganesha 10 St., Bandung 40132, Indonesia
Email: [email protected]
Abstract. Self-Potential (SP) method is frequently used to identify subsurface structures based on electrical properties. For fixed geometry problems, SP method is related to simple geometrical shapes of causative bodies such as a sphere, cylinder, and sheet. This approach is implemented to determine the value of parameters such as shape, depth, polarization angle, and electric dipole moment. In this study, the technique was applied for investigation of fault, where the fault is considered as resembling the shape of a sheet representing dike or fault. The investigated fault is located at Pinggirsari village, Bandung regency, West Java, Indonesia. The observed SP anomalies that were measured allegedly above the fault were inverted to estimate all the fault parameters through inverse modeling scheme using the Levenberg-Marquardt method. The inversion scheme was first tested on a synthetic model, where a close agreement between the test parameters and the calculated parameters was achieved. Finally, the schema was carried out to invert the real observed SP anomalies. The results show that the presence of the fault was detected beneath the surface having electric dipole moment K = 41.5 mV, half-fault dimension
a = 34 m, depth of the sheet’s center h= 14.6 m, the location of the fault’s center xo = 478.25 m, and the polarization angle to the horizontal plane θ = 334.52ᵒ in a clockwise direction.
1. Introduction
The self-potential method is a geophysical method which is used for measuring naturally occurring potential differences expressed in mV between two points at the surface. The measured data are potential anomalies caused by natural subsurface electrical phenomena. SP anomalies can be generated through several mechanisms such as diffusion and membrane potentials, bioelectric potential, streaming potential, and mineral potential. SP Method has been widely applied in the exploration of sulfides, hydrogeology, volcanic activity and geothermal systems, hydrocarbon exploration, archeology, and environmental geophysics.
2
1234567890
Southeast Asian Conference on Geophysics IOP Publishing
IOP Conf. Series: Earth and Environmental Science 123456789062 (2017) 012004 doi :10.1088/1755-1315/62/1/012004
Southeast Asian Conference on Geophysics IOP Publishing
IOP Conf. Series: Earth and Environmental Science 62 (2017) 012004 doi :10.1088/1755-1315/62/1/012004
require current density, resistivity and depth approximation but only SP data, and the interpretation are fast and accurate.
Several methods have been developed to estimate the model parameters (shape, depth, angle of polarization, and the electric dipole moment) of buried structure from based on SP anomaly profiles. Those include, for example, using the characteristic points, distances, curves and nomograms method [1,2], least-squares method [3,4], derivatives analysis method [5], spectral analysis approach using Fourier transform and wave number domain [6], and non-linear inversion method [7,8].
In this study, the author proposes an implementation of non-linear inversion technique using Levenberg-Marquardt (LM) method, applied in fixed geometry model of the sheet structure. In the field, sheet structure can be considered as the subsurface condition with fault structures. Because the fault can frequently be associated with the presence of mineral or fluid’s flow path, an inclined conductive plane will be formed between the layers.
2. Theoretical Formulation
2.1. Forward modeling
SP anomaly (V) due to an inclined sheet structure (Figure 1) at a point P(x) along a profile perpendicular
to the structure’s strike is given by the following formula:
2 (m), respectively. An inclined sheet structure was modeled by a set of five model parameters, namely electric moment dipole
K
KI
/2
where I is the current density and
is the resistivity of the surrounding medium, abscissa of the center of the xo, depth of the center h, the half-width of the sheet a, and inclination angle θ. The general equation of SP anomaly V(x) at any point P on a profile perpendicular to the strike of inclined sheet is written as follows [9,10]:
Figure 1. Geometry of sheet which is clock-wisely inclined by θ
2.1.1. Levenberg-Marquardt Inversion
1234567890
Southeast Asian Conference on Geophysics IOP Publishing
IOP Conf. Series: Earth and Environmental Science 123456789062 (2017) 012004 doi :10.1088/1755-1315/62/1/012004
Southeast Asian Conference on Geophysics IOP Publishing
IOP Conf. Series: Earth and Environmental Science 62 (2017) 012004 doi :10.1088/1755-1315/62/1/012004
of the solution. It takes the advantages of Gauss-Newton method which is fast but having uncertain convergence and Steepest-Descent method which is very slow but having certain convergence [11].
In this problem, the model parameters and data are related a non-linear system of equations:
G(m)
d (3)
Where d is a vector containing data of M observations, m is a vector of n model parameters which will be estimated (K, a, h, xo, and θ), and G is mathematical model or kernel matrix that relates the data
d to the parameters m.
Assuming measurement errors are normally distributed thus error can be minimized using their data standard deviation:
In the LM method, equations for successive iterations are expressed as:
mk TJmk I m J
mk TFmkI is identity matrix, and λ is a damping parameter to maintain the inversion convergence stability.
F(m) is a vector containing differences between observed data and calculated data:
Therefore, updated parameters equation is given by:
k T k
k T k generated from the forward calculation of test parameters. The aim is to validate the accuracy of the inversion scheme in reconstructing the model parameters. The parameters used to create synthetic data are depth of sheet = 25 m, half-length of the sheet = 15 m, inclination angle = 30o, electric dipole moment4
1234567890
Southeast Asian Conference on Geophysics IOP Publishing
IOP Conf. Series: Earth and Environmental Science 123456789062 (2017) 012004 doi :10.1088/1755-1315/62/1/012004
Southeast Asian Conference on Geophysics IOP Publishing
IOP Conf. Series: Earth and Environmental Science 62 (2017) 012004 doi :10.1088/1755-1315/62/1/012004
Figure 2. Results of LM inversion using synthetic data: profile of observed vs. calculated data and obtained model parameters (K, a, h, xo, and θ).
In Figure 2, it is shown that synthetic data were inverted using LM inversion with the same standard deviations for all data, which was assumed to be one mV. The estimated parameters agreed well with observed parameters, and the synthetic data were successfully recovered by the calculated data. Based on the fitness between the synthetic data and the calculated data and similarity between the test parameters and the inverted parameters, the inversion scheme was considered ready to be applied to field data.
3. Observed Data
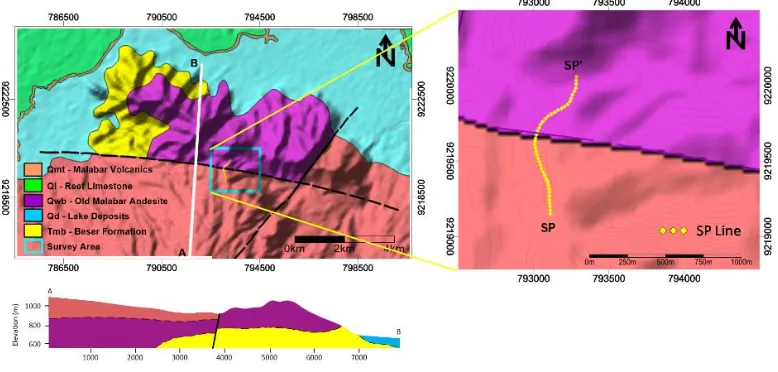
Fault structures can be characterized based on lithological differences which are visible on the surface, and on the difference in depth of subsurface structure with the same lithology seen from the geological cross section. Information of the fault presence was obtained from the geological map of Garut and Pameungpeuk quadrangle, Java (Figure 3). The field data acquisition was undertaken on 24 May 2016 in Pinggirsari village, West Java, Indonesia. The measurement line was set by crossing fault structures with South-North direction regarding the geological cross section. The length of acquisition line was more than 1 km, with a distance between electrodes of 25 m.
1234567890
Southeast Asian Conference on Geophysics IOP Publishing
IOP Conf. Series: Earth and Environmental Science 123456789062 (2017) 012004 doi :10.1088/1755-1315/62/1/012004
Southeast Asian Conference on Geophysics IOP Publishing
IOP Conf. Series: Earth and Environmental Science 62 (2017) 012004 doi :10.1088/1755-1315/62/1/012004
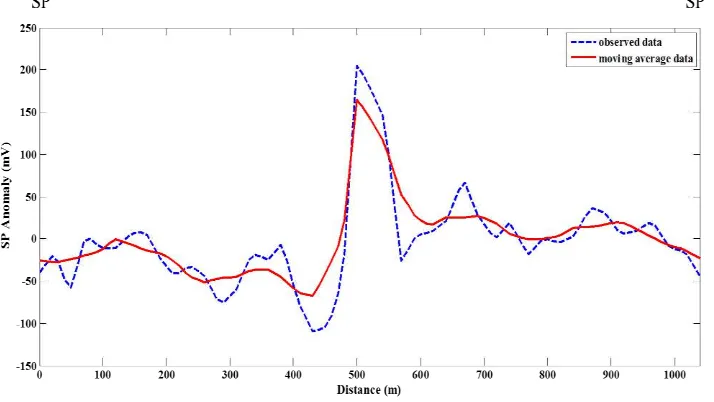
From the field data acquisition, SP anomalies were obtained as shown in Figure (3). It is shown that anomalies values are fluctuating, this is probably due to differences in soil condition along the acquisition line, either contrast porosity or dissimilarity on fluid content of rocks. From the measured anomalies, it can be seen that there is a sharpening anomaly which is estimated to be attributable to the presence of a fault.
Figure 4. SP anomaly profile from measurement in SP-SP′ line
Furthermore, data smoothing of observed SP anomaly data was performed using moving average. Its purpose was to sharpen anomaly effect and eliminate soil heterogeneity effect. Thus it obtained smoothed data as shown by the red curve in Figure 4. In the inversion process, the observed data to use was data resulted from the smoothing process.
4. Result and Discussion
From the results of field data acquisition using SP method (Figure 4), the observed SP anomaly showed the presence of anomalous potential difference located between 400 m - 600 m with maximum values (Vmax) of 162.70 mV and minimum values (Vmin) of -69.88 mV. This anomaly is estimated to be caused
by their fault structure below the earth's surface.
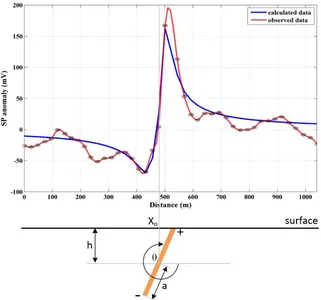
In the inversion process, interpreted electric dipole moment K = 41.5 mV, half-fault dimension a =
34 m, depth of the sheet’s center h = 14.63 m, the location of the fault’s center xo= 478.25 m, and the
polarization angle to the horizontal plane θ = 334.52ᵒ in a clockwise direction. Inversion results in Figure 4 show the data calculation curve was successfully following the pattern of the field data.
The inversion codes were constructed in MATLAB and executed using a CPU with 1.70 GHz processor and 8.00 GB RAM. The time needed for running program was 0.0725 seconds. We used standard error (SE) as statistical criteria for comparing the observed data to the inverted data using the above approaches,
n m
x V x D
SE m
i
i i
12
)] ( ) ( [
6
1234567890
Southeast Asian Conference on Geophysics IOP Publishing
IOP Conf. Series: Earth and Environmental Science 123456789062 (2017) 012004 doi :10.1088/1755-1315/62/1/012004
Southeast Asian Conference on Geophysics IOP Publishing
IOP Conf. Series: Earth and Environmental Science 62 (2017) 012004 doi :10.1088/1755-1315/62/1/012004
Where D(xi) is the observed SP anomaly at a discrete points xi , m is the number of points and n = 5
(i.e., K, a, h, xo, θ), V(xi) denotes the SP anomaly data calculated using the interpreted parameters. The
obtained value of standard error for this method (SE)was 5.43. Standard error represent incompatibility the observed and calculated data about 5.43%. This mismatch data is rated low so that the parameters of the calculation can be accepted, and its inversion results can be seen in Figure 5.
Figure 5. The results of observed data inversion anomaly SP using LM
5. Conclusion
The fault in Pinggirsari village was identified using SP method. The Levenberg-Marquardt method was used for quantitative interpretation of self-potential anomalies due to the fault structure to determine model parameters (electric dipole moment, depth, half-length, location midpoint, and inclination angle). This method was applied to synthetic data where a good agreement between the observed and the calculated data was achieved. To further evaluate the performance of this method, interpretation of SP field anomalies using the method were then carried out. The result shows that calculated data followed the pattern of anomalies, and the recovered model parameters were realistic and physically logical. Based on the measured SP anomaly which has only minimum to maximum value of about 230 mV, the reconstructed depth of the fault is considerably shallow having only length of 2a or 68 m.
References
[1] Murthy B V S and P Haricharan 1985 Nomogram for the Complete Interpretation of Spontaneous Potential Profiles Over Sheet-like and Cylindrical 2-D Source Geophysics50 1127-1135 [2] Rao D A and Babu H V R 1988 Rapid Graphical Method For The Interpretation of the
Self-Potential Anomaly Over A Two-Dimensional Inclied Sheet Of Finite Depth Extent
1234567890
Southeast Asian Conference on Geophysics IOP Publishing
IOP Conf. Series: Earth and Environmental Science 123456789062 (2017) 012004 doi :10.1088/1755-1315/62/1/012004
Southeast Asian Conference on Geophysics IOP Publishing
IOP Conf. Series: Earth and Environmental Science 62 (2017) 012004 doi :10.1088/1755-1315/62/1/012004
[3] Abdelrahman E M and Sharafeldin S M 1997 A Least-Square Approach to Depth Determination From Residual Self-Potential Anomalies Caused by Horizontal Cylinders and Sphere
Geophysics62 44-48
[4] Abdelrahman E M, Saber H S, Essa K S and Fouda M A 2004 A Least-Square Approach to Depth Determination From Numerical Horizontal Self-Potential Gradients Pure and Applied
Geophysics161 399-411
[5] Abdelrahman E M, Ammar A A, Hassanein H I and Hafez M A 1998 Derivative Analysis of SP Anomalies Geophysics63 890-897
[6] Rao D A, Babu H V R and Sinha G D J S 1982 A Fourier Transform Method for The Interpretation of Self-Potential Anomalies Due to Two-Dimensional Inclined Sheets Of Finite Depth Extent
Pageoph120 355-374
[7] Srigutomo W, Agustine E and Zen M H 2006 Quantitative Analysis of Self-Potential Anomaly: Derivative Analysis, Least-Square Method and Non-Linear Inversion Indonesian Journal of Physics17 49-55
[8] Sharma S P and Biswas A 2013 Interpretation of Self-Potential Anomaly Over a 2d Inclined Structure Using Very Fast Simulated-Annealing Global Optimization – An Insight About Ambiguity Geophysics78 wb3-wb15
[9] Asfahani J and Tlas M 2005 A Constrained Nonlinear Inversion Approach to Quantitative Interpretation of Self-Potential Anomalies Caused by Cylinders Spheres and Sheet-like Structures Pure Appl. Geophys.162 609-624
[10] Sundararajan N, Rao P S and Sunitha V 1998 An Analytical Method to Interpret Self-Potential Anomalies Caused by 2-D Inclined Sheets Geophysics Vol. 63 1551-1555
[11] Marquardt D W 1963 An Algorithm for Least-Square Estimation of Nonlinear Parameters
Journal of the Society for Industrial and Applied Mathematics11(2) 431-441
[12] Alzwar M, Akbar N and Bachri S 1992 Peta Geologi Lembar Garut dan Pameungpeuk, Jawa
Pusat Penelitian dan Pengembangan Geologi
Acknowledgement