162
The Impact of Viral Marketing through Social Media
on
BCD’s
Consumer Brand Knowledge
Levina Kusumadjaja
International Business Management Program, Petra Christian University Jl. Siwalankerto 121-131, Surabaya
E-mail: [email protected]
ABSTRACT
Due to the continous increase in viral marketing’s popularity phenomenon that causes viral marketing to later become a strategic requirement for marketers worldwide, a necessity to assess the effectiveness of viral marketing in achieveing its objectives in leveraging brand and products has emerged. This research was accomplished to study the impact of viral marketing through social media on consumer brand knowledge of a franchised Taiwanese bubble tea company, BCD. The company utilizes viral marketing through social media platforms to boost consumer brand knowledge. Therefore understanding the impact of viral marketing on consumer brand knowledge will help derive the most effective management approaches for the company.
The different social media platforms examined are Facebook, Twitter and Instagram. In total, data from 134 respondents was gathered through simple random sampling and further analyzed using the multiple regression method. The results concluded that the company’s viral marketing activities through social media simultenously have significant impact on its consumer brand knowledge and individually does not give significant impact to the company’s consumer brand knowledge.
Keywords: Viral Marketing, Social Media, Consumer Brand Knowledge, Platform
ABSTRAK
Oleh karena fenomena viral marketing yang semakin populer, yang membuat viral marketing menjadi bagian dari strategi pemasaran masa kini, munculah kebutuhan untuk mengevaluasi efektivitas viral marketing dalam mencapai objektif strategi pembangunan merk dan produk. Penelitian ini dilakukan untuk mempelajari dampak viral marketing melalui media sosial terhadap pengetahuan merk konsumen tentang sebuah perusahaan lisensi teh mutiara dari Taiwa n, BCD. Perusahaan ini menggunakan viral marketing melalui media sosial untuk meningkatkan pengetahuan merk konsumen. Oleh karena itu, memahami dampak viral marketing terhadap pengetahuan merk konsumen dapat memberi pedoman bagi perusahaan tersebut dalam membuat keputusan manajemen yang efektif.
Media sosial yang dianalisa adalah Facebook, Twitter dan Instagram. Total data yang terkumpul didapatkan dari 134 responden dengan menggunakan metode simple random sampling, dimana data tersebut kemudian dianalisis lebih lanjut dengan regresi berganda. Hasil analisa menunjukkan bawah viral marketing melalui media sosial secara keseluruhan memberikan dampak signifikan terhadap pengetahuan merk konsumen, namun secara individu tidak memberikan dampak signifikan ter hadap pengetahuan merk konsumen perusahaan tersebut.
Kata Kunci: Viral Marketing, Media Sosial, Pengetahuan Merk Konsumen, Platform
INTRODUCTION
The prominent growth of networking through social media has shifted the trends in the branding industry. Once merely just another tool to connect with, social media has now become a significant and vital part of consumers’ day-to-day communication process. This is where viral marketing comes in, the process of encouraging
and exchanging positive information about certain products of brands by consumers in and throughout the digital sphere or environment of buyers (Helm, 2000; Wiedermann, 2007; Dobele, 2005).
163 University of Massachusetts Dartmouth, where they found out of all companies included within Fortune 500, 77% are actively engaging in an online community using their corporate Twitter accounts, 70% on Facebook, 69% are on Youtube and 8% are on Instagram (Barnes, 2013). In Asia, out of all the top brands in originated from this continent, 81% use social media. Not only that, 89% of Asian companies use Facebook, 66% use Twitter and 64% use Youtube (Social Digital Mobile in Asia, 2012, October). The use of viral marketing through social media is shown by having 75% of brands in Asia running social media marketing activities throughout 2012 (We Are Social, 2012).
For Indonesia’s case, the need to utilize viral marketing through social media to engage with consumers is vital. Indonesia is named as the 4th
largest market population on Facebook and 5th
largest on Twitter (Redwing, 2013). Social media users in Indonesia reached 43.8 million people, representing social media penetration in 2012 in Indonesia that reached 18%, with only 3% difference from Asian average (We Are Social, 2012). Thus, what is crucial for Indonesian companies to understand in ensuring effective future investments in viral marketing is the effectiveness of their viral marketing efforts through social media. However, the benchmark used to measure the effectiveness of one company’s viral marketing cannot be generalized from one company to another. Companies’ efforts to conduct successful viral marketing through social media sites are directed towards various objectives (Raditya, 2014).
A franchised bubble tea company in Indonesia has also recognized the need to implement viral marketing through social media to reach out to customers in Indonesia. It has developed its online market presence via Facebook, Twitter and Instagram. The company’s purpose of making investments in viral marketing through Social Media is to communicate and engage its brand with consumers in Indonesia, focusing on building strong consumer brand knowledge. However, having invested so much in the implementation of viral marketing to reach out to customers, the significance of using viral marketing as the tool to build consumer brand knowledge is yet to be measured. There is an urgent need to evaluate its viral marketing effectiveness as discussed in the previous paragraphs that future investments in viral marketing should be made based on this evaluation. Based on these issues, two questions in relation to the company’s viral marketing and its efforts to leverage and boost consumer brand knowedge arise, which is whether viral marketing through social media platforms has significant
effect on consumer brand knowledge of the company.
From the question above, two predictions arise, which are first, viral marketing through social media sites (Facebook, Twitter and Instagram) as a whole influences its consumer brand knowledge, and second, viral marketing through social media sites (Facebook, Twitter and Instagram) individually influences its consumer brand knowledge. These predictions will serve as the main hypotheses evaluated in this research.
LITERATURE REVIEW
This research will investigate how the different indicators of viral marketing as conducted through the different social media sites influence consumer brand knowledge.
A journal written by Godfrey Themba and Monica Mulala from University of Botswana’s Department of Marketing was found to be relevant for this research. The second hypothesis of this journal is that overall, brand-related electronic word-of-mouth has a positive and significant influence on purchase decisions (Themba & Mualala, 2013). The concept of brand-related electronic word-of-mouth, which is the process of creating and sharing product or brand related information online through specific social networking environments (Themba & Mualala, 2013), is closely related to the definition of Viral Marketing, which is the spread of brand or product related information within a digital network of buyers (Dobele et al., 2005). The journal suggests that electronic word-of-mouth activities influences consumers’ response towards certain brand or product through their purchase decisions, while this research also suggests that viral marketing through social media influences consumers’ response towards certain brand or product through their consumer brand knowledge.
164 availably to other consumers through the internet (Jalilvand & Samiei, 2012), is closely related to the definition of Viral Marketing, which is the spread of brand or product related information within a digital network of buyers (Dobele et al., 2005).
Other relevant points from a different journal were also found in the two objectives of the study, which are to study the influence of brand or product related information available on social media platforms on consumers’ purchasing behavior and to verify whether consumers’ social media communication affects their decision making. The writer’s objective in conducting this research is also to understand the impact of viral marketing on consumer brand knowledge of a specific brand. Consumers’ purchasing behavior and consumer brand knowledge is closely related as measuring consumer brand knowledge includes the indicator of experience, which represents consumer’s behavior in purchase and consumption related to the brand (Keller, 2003).
Viral Marketing
Viral marketing is defined as “a communication and distribution concept that relies on customers to transmit digital products via electronic mail to other potential customers in their social sphere” (Helm, 2000). The trend of spreading brand or product related information through a digital network of buyers began growing alongside the rapid development of information and communication technology, such as the Internet (Helm, 2000). This technology advancement plays a significant role in changing the way consumers interact and engage with one another, moving them from the traditional and physical environment to online communities (Palka et al., 2009). The scope of viral marketing can be determined based on the platforms used to conduct the viral marketing activities, such as social networking sites, where customers can engage and connect with fellow customers via social networking platforms (Leskovec et al., 2007).
The indicators of viral marketing that will be used throughout this research are based on the determinants of successful viral marketing campaigns, consisting of information, participation, used reach and conversion rate (Hinz et al., 2011). Information is defined as consumers’ source of information, where successful viral marketing means consumers receive the message about the marketing activities from another consumer (Hinz et al., 2011). Participation refers to consumers’ active participation in the viral marketing activities, whether they share any brand and/or product related information obtained from/or through viral marketing platforms and/or
activities to other consumers (Hinz et al., 2011). Used reach represents the number of consumers that have been informed about any brand and/or product related information through the viral marketing platforms (Hinz et al., 2011). And the last indicator is conversion rate that represents whether any brand or product related information obtained from/or through viral marketing platforms and/or activities cause consumers to make a purchase decision (Hinz et al., 2011).
Social Media
Social media is a network that revolves around various kinds of online communication platforms, such as social media sites, blogging platforms, public chat rooms, discussion forums and many more (Hollensen, 2011). The main point of social media does not lie in its platform, but rather in the exchange of content and information among individuals or groups within a particular online sphere that facilitate the communication process (Odhiambo, 2012). These facilities can be presented in any form, such as text, images, videos and audio, where all of these tools are aimed to ease and smoothen the process of content sharing done by the users of the social media platforms (Hollensen, 2012; Odhiambo, 2012).
In this research, the three social media platforms that will be used are Facebook, Twitter and Instagram. Facebook was a social media site that was found in 2004 by Mark Zuckerberg (Krivak, 2008). Users on Facebook can engage with other users through many activities, such as photo sharing, instant messaging, groups and communities, online games, information sharing and many more. Meanwhile, Twitter is a microblogging platform, which refers to a digital platform where users can share a form of electronic information within a network of users (Jansen et al., 2009). The information shared by users on Twitter can only be accessed on Twitter, with a limit of 140 characters per post (Mancini, 2009). Finally, Instagram focuses on visual presentations, presenting itself as an online photo and video-sharing social media platform established by Kevin Systrom and Mike Krieger in 2010 (Heffernan, 2013). Instagram is accessible to users through a mobile app that allows users to take, crop, filter, post and comment on pictures and videos on the Instagram community (Heffernan, 2013) and also send to other Instagram users personally using its “direct” feature (Myers, 2012).
Consumer Brand Knowledge
165 consumers receive, both descriptive and evaluative. The understanding of brand knowledge is important for companies because brand knowledge represent consumers’ overall judgment upon a certain brand or product, such as their feelings, opinions and actual responses, therefore this understanding can help companies to solve their brand management problems and develop a more effective brand management strategies (Keller, 2003). In this research, consumer brand knowledge will be measured using several dimensions of brand knowledge as the indicators, which are awareness, attributes, benefits, images, thoughts, feelings, attitudes and experiences (Keller, 2003).
Awareness is defined as the identification and differentiation of one brand with another (Keller, 2003). Awareness is an important indicator because it increases the probability of consumers making a purchasing decision; so the more aware and familiar they are with the brand, the more likely they are to purchase the related brand (Hussein, 2012).
Attributes are defined as the intrinsic and extrinsic features that describe the character of certain brands or products (Keller, 2003). Successful consumer brand knowledge building will be reflected through consumers’ ability to describe the features that characterize the brand (Doss, 2011).
Benefits are defined as the values consumers find in certain brands or products in relation to the brand or product’s attributes (Keller, 2003). Benefits serve as another important indicator to measure consumer brand knowledge, because consumers will be able to experience the full benefits of a brand once they have the full understanding of what the brand has to offer (Glynn et al., 2007).
Images are defined as brand or product-related information that consumers receive visually (Keller, 2003). It represents how consumers visualize the brand according to what they believe and perceive about the brand, which can be attached to certain symbolisms, functionality and many more (Kathiravana et al., 2010), where this will later be used by consumers as information to support their purchase decision (Francoeur, 2004).
Thoughts are defined as consumer’s cognitive responses after obtaining or coming in contact with any brand-related information (Keller, 2003). Such cognitive responses are actually driven and affected by the brand or product-related knowledge that consumers have (Malar et al., 2011).
Attitudes defined as consumer’s overall perception upon any brand-related information (Keller, 2003). it has also been discussed that
attitudes are formed and developed by being exposed and interacting with the brand or product, or any brand or product-related information, over time that results in an overall favorable or unfavorable perception upon the brand (Kathirivanaa et al., 2010).
Experiences defined as consumer’s behavior in purchase and consumption related to the brand (Keller, 2003). Consumers who are considered as experienced consumers are those who have gone through the process of attaining sufficient information about the related brand or product until making an actual purchasing decision (Choi et al., 2011).
RESEARCH METHOD
There are two different categories of variables used in this research, which are dependent variables and independent variables. The dependent variable that will be studied in this research is consumer brand knowledge. The independent variable of this research will be viral marketing through different social networking sites (Facebook, Twitter and Instagram).
The sub-variables of consumer brand knowledge (Y) are as stated below:
a. Awareness:
Consumers can differentiate BCD from other brands because of the information obtained from BCD Surabaya’s account on social media sites.
b. Attributes:
Consumers can identify BCD’s product attributes (types, price range, taste, quality, etc.) because of the information obtained from BCD Surabaya’s account on social media sites.
c. Benefits:
Consumers understand BCD’s product values and benefits because of the information obtained from BCD Surabaya’s account on social media sites.
d. Images:
Consumers find visual promotional tools used by BCD Surabaya’s account on social media sites informative.
e. Thoughts:
Consumers think positive thoughts about BCD’s brand and product offering because of the information obtained from BCD Surabaya’s account on social media sites. f. Feelings:
Consumers feel connected to BCD’s brand and products because of the information obtained from BCD Surabaya’s account on social media sites.
166 Consumers perceive BCD’s brand and products as satisfactory because of the information obtained from BCD Surabaya’s account on social media.
h. Experiences:
Consumers purchase and consume BCD’s products because of the information obtained from BCD Surabaya’s account on social media.
The different social media sites will be assessed based on the indicators of viral marketing, as stated below:
a. Information (FB 1/ TW 1/ IG 1):
Consumers know about the company’s account on Facebook/ Twitter/ Instagram from another customer.
b. Participation (FB 2/ TW 2/ IG 2):
Consumers participate (post, mention, comment, etc) on the company’s account on Facebook/ Twitter/ Instagram.
c. Used Reach (FB 3/ TW 3/ IG 3):
Consumers share information from the company’s account on Facebook/ Twitter/ Instagram to other consumers.
d. Conversion Rate (FB 4/ TW 4/ IG 4): Consumers purchase the company’s products because of the information obtained from its account on Facebook/ Twitter/ Instagram.
This research will use primary data from the distribution of research questionnaires to respondents in Surabaya and secondary data in a form of journals, textbooks, handbooks, newspaper articles and so forth, and mainly used for the supporting data in building the theoretical background of this research.
The sampling method used will be the simple random sampling, with people in Surabaya that know the company’s brand and products and have accounts on all Facebook, twtter and Instagram as the population of this research. The depth of knowledge that respondents need to have upon the company’s brand and products basically covers the general knowledge about its main product, which is Taiwanese bubble tea drink.
There are no specific numbers that can reflect the exact number of consumers who are involved in the viral marketing activities on social media, therefore the minimum sample size of this research is 74, as determined by Tabachnick and Fidell’s (2007) method to calculate sample size:
N > 50 + 8m Where:
N = Sample size
m = Number of independent variable(s)
The questionnaires will be distributed at the company’s outlets in all over Surabaya by coordinating with its management team.
Thereafter, the validity of the data collected will be tested using the corrected item-total correlation test based on the r-value and t-test and its reliability of will be measured based on the Cronbach’s Alpha. The value of Cronbach’s Alpha must fall under the range of zero to one, with the value of 0.60 higher as acceptable reliability (Ghozali, 2011).
Multiple regression is the chosen statistical method to test the hypotheses of this research. The five assumptions that must be tested before conducting the multiple regression analysis are linearity, heteroscedasticity, normality, multicollinearity and autocorrelation.
The linearity between the independent and dependent variables as the first assumption is tested using scatterplot. The assumption of linearity will hold true if the scatterplot plot are randomly distributed in the positive and negative area, with zero as the center. Heteroscedasticity as the second assumption will be tested the Spearman’s Rank Correlation test. The Spearman’s Rank Correlation test will be conducted with a 5% of significance level based on the t-distribution and with the help of SPSS program. The decision rule in testing the hypotheses for the Spearman’s Rank Correlation test are as stated below (Ghozali, 2011):
Reject H0 if Significance (2-tailed) is less
than the significance level of 5%
Accept H0 if Significance (2-tailed) is greater
than the significance level of 5%
The third assumption regarding normal probability distribution of residuals is tested using Smirnov test. The Kolmogorov-Smirnov test will be conducted with a 5% of significance level and with the help of SPSS program. The decision rule in testing the hypotheses for the Kolmogorov-Smirnov test are as stated below (Ghozali, 2011):
Reject H0 if the asymptotic significance for
two-tailed is less than the significance level of 5%
Accept H0 if asymptotic significance for
two-tailed is greater than the significance level of 5%
The fourth assumption regarding the multicollinearity is to be tested on the variance inflation factor, where the variance inflation factor should not be greater than 10. The fifth assumption regarding the independency of the observations’ residuals, or autocorrelation, is tested using the Runs Test statistics. The decision rule in testing the hypotheses are as stated below (Ghozali, 2011):
167 Accept null hypothesis if Asymp. Sig.
(2-tailed) value is greater than 0.05 significance value
The use of multiple regression in this research will yield the outcome of adjusted R2, or coefficient of
multiple determination, each independent variables’ regression coefficient, as well as F-test and t-test. The general model of multiple regression is as written below:
Y = β0+ β1X1+ β2X2+ … + βnXn + ε
Y = dependent variable Xi = ith independent variable
β0 = a constant, value of Y when all Xi = 0
βi = the regression coefficient of the ith independent variable
k = number of independent variables ε = random error
The least square method is used to find the coefficients in the multiple regression equation (Lind et al., 2010).
The hypotheses will be tested at .05 significance level using a two-tailed test, as indicated by the way the hypotheses are stated (Lind et al., 2010). The first set of hypotheses is as stated below:
H0: β1 = β2 = β3 = 0
H1: β1 ≠β2 ≠β3 ≠0
The first set of hypothesis will be tested using the F-distribution, or more commonly known as the global test (Lind et al., 2010). The decision rule will be based on the p-value of the F-test represented under the column of sig. in the multiple regression analysis results, where the null hypothesis will be rejected if p-value is less than the significance value of 0.05 and the null hypothesis will be accepted if p-value is greater than the significant value of 0.05 (Lind et al., 2010).
The second set of hypotheses is as stated below:
H0: βi = 0
H1: βi ≠ 0 Where
i = 1,2,…n.
The second set of hypothesis will be tested using the t-distribution. The decision rule will be based on the p-value of the t-test represented under the column of sig. in the multiple regression analysis results, where the null hypothesis will be rejected if p-value is less than the significance value of 0.05 and the null hypothesis will be accepted if p-value is greater than the significant p-value of 0.05 (Lind et al., 2010).
RESULTS AND DISCUSSION
A total of 134 questionnaires were qualified to be analyzed further in the research. To ensure that the data collected are eligible to be used as the basis of this research’s analysis, the data must past validity, reliability and assumptions tests before being analyzed further with the multiple regression analysis.
The validity of the data collected will be tested using the corrected item-total correlation test based on the r-value and t-test and its reliability of will be measured based on the Cronbach’s Alpha.
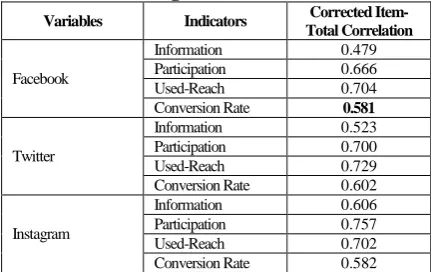
For validity, this research has 95% confidence level therefore the r-value can be obtained from the r table with 5% significance level. From the r-value caltculation based on the r table, it is found that the r-value for this research is at 0.17728. Hence, in order for the indicators of viral marketing and consumer brand knowledge to pass the validity test, the value under its Corrected Total Correlation column from the Item-Total Statistics table must be greater than 0.17728. Based on Table 1, we can see that all data collected are valid because all indicators have corrected item-total correlation value greater than 0.17728.
Table 1. Item-Total Statistics of Facebook, Twitter and Instagram
Variables Indicators Corrected Item-Total Correlation
Information 0.479 Participation 0.666 Used-Reach 0.704 Conversion Rate 0.581
Information 0.523 Participation 0.700 Used-Reach 0.729 Conversion Rate 0.602
Information 0.606 Participation 0.757 Used-Reach 0.702 Conversion Rate 0.582
For reliability, the value of Cronbach’s Alpha must fall under the range of zero to one, with the value of 0.60 higher as acceptable reliability (Ghozali, 2011). Based on Table 2, all variables’ Cronbach Alpha is higher than 0.60, therefore all variables are reliable.
Table 2. Reliability Statistics of Facebook, Twitter and Instagram
Variables Cronbach’s Alpha N of Items
Facebook 0.792 4
Twitter 0.815 4
Instagram 0.832 4
168 throughout the quadrant, both in the positive and negative area of the Y-axis. Therefore the assumption linearity for this research holds true.
Figure 1. The Scatterplot
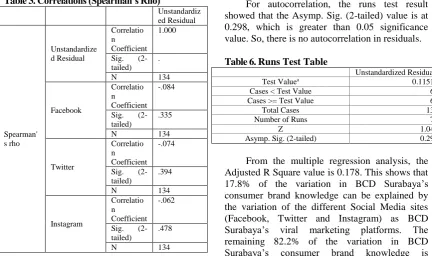
For heteroscedasticity, the values under the column of Unstandardized Residual and rows of Significance (2-tailed) are all greater than the significance value of 0.05 therefore there is no heteroscedasticity in residuals.
Table 3. Correlations (Spearman’s Rho)
Unstandardiz ed Residual
Spearman' s rho
Unstandardize d Residual
Correlatio n Coefficient
1.000
Sig. (2-tailed)
.
N 134
Correlatio n Coefficient
-.084
Sig. (2-tailed)
.335
N 134
Correlatio n Coefficient
-.074
Sig. (2-tailed)
.394
N 134
Correlatio n Coefficient
-.062
Sig. (2-tailed)
.478
N 134
The Kolmogorov-Smirnov asymptotic significance for two-tailed of this research is at 0.058, which is lesser than 0.05. Therefore the variance of residuals is normally distributed.
Table 4. One-Sample Kolgomorov- Smirnov Test
Unstandardized Residual
N 134
Normal Parameters
Mean .0000000 Std.
Deviation
.61713979
Absolute .115 Most Extreme
Differences
Positive .057 Negative -.115 Kolgomorov-Smirnov Z 1.329 Asymp. Sig. (2-tailed) 0.058
For multicollinearity, the VIF values for all independent variables are below 10. Therefore it can be concluded that there is no multicollinearity among all the independent variables.
Table 5. Multicollinearity Test Table (Coefficients)
Model Correlations Collinearity Statistics
Zero-order
Partial Part Tolerance VIF
1
(Constant)
Facebook 0.355 0.134 0.126 0.352 2.838 Twitter 0.318 0.096 0.089 0.504 1.986 Instagram 0.310 0.053 0.049 0.423 2.363
For autocorrelation, the runs test result showed that the Asymp. Sig. (2-tailed) value is at 0.298, which is greater than 0.05 significance value. So, there is no autocorrelation in residuals.
Table 6. Runs Test Table
Unstandardized Residual Test Valuea 0.11518
Cases < Test Value 67 Cases >= Test Value 67 Total Cases 134 Number of Runs 74
Z 1.041
Asymp. Sig. (2-tailed) 0.298
169 Table 7. Model Summary of Multiple
Regression Analysis Table
From the ANOVA table below, the F value is 6.960 with the probability of 0.000. The p-value under the significance F is smaller than the 0.05 significance value. This shows that the null hypothesis is rejected therefore at least one of the independent variables has significant effect toward the dependent variables.
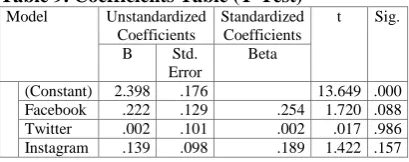
Table 8. The ANOVA Table ANOVAa variables are significantly affecting the dependent variable individually. It was proven that Facebook with p-value of 0.088, Twitter with p-value of 0.986 and Instagram with p-value of 0.157 do not have significant effect toward consumer brand knowledge individually.
Table 9. Coefficients Table (T-Test)
Model Unstandardized regression equation that is constructed for this research would be:
Y = 2.398 + 0.222 Facebook + 0.002 Twitter + 0.139 Instagram
The effect of each independent variable on the dependent variable cannot be determined individually as it is not significant.
Theories suggest when the F-test shows the independent variables simultaneously have significant effect towards the dependent variable and the t-test shows the independent variables individually have no significant effect towards the dependent variable, the tendency is leaning to the condition that there is multicollinearity among all the independent variables (Hair Jr. et al., 2010) However, the assumption test results regarding multicollinearity based on the VIF of independent
variables both before variable transformation and after variable transformation showed that all the VIF values are below 10. Hence, multicollinearity does not exist.
The average frequency percentages of viral marketing indicators shows that on average 24.81% of the respondents strongly disagreed and 38.44% disagreed with the statements relating to the determinants of successful viral marketing campaigns. Only 12.93% respondents on average agreed and 2.79% respondents on average strongly agreed towards the statements that relate to the determinants of successful viral marketing campaigns. Based on those percentages, it is evident that the company’s viral marketing activities through social media platforms have not utilized the social media properties optimally, leading to a less effective viral marketing execution.
Table 10. Average Frequency Percentages of Viral Marketing Indicators platforms for its viral marketing activities has recently been recognized. From June 2013 up to April 2014, the company’s approached to viral marketing activities through social media platforms has been focused on providing information about events, products and promotional offers to consumers. The characteristics of postings made on the various social media platforms are directed towards delivering facts and information about its brand and products through text, with visual aids to further enhance the message delivery.
Walter and Gioglio (2014) concluded that real-time visual content that relates to real settings and real events are those that are most powerful and most engaging among consumers in social media. Visual content that are digitally fabricated are found to be not as engaging as real-time visual content, and is actually considered among the least effective to be used as a booster for a certain brand or product’s viral marketing activities across social media platforms (Walter and Gioglio, 2014).
170 delivery through these social media platforms are still put on the text, when researches have proven the importance of visual content as a part of the effective use of social media. Using digital fabrication images as the main visual aid for viral marketing activities through social media platform is considered as the least effective method compared to using images that represents real events to connect to audiences at a more personal level, initiating a deeper level of engagement between the brand or product with the consumer (Walter and Giogilo, 2014). Therefore it can further explain the results of this research that indicates the company’s viral marketing activities through social media platforms as insignificant to building consumer brand knowledge.
According to Keller (2003), there are four types of secondary sources for consumer brand knowledge, such as people, things, places and other brands. People consist of employees and endorsers. According to the company’s management team, the company’s target market are males and females in Surabaya from the age of 20-24, which covers 309,839 out of the total of 2,611,506 Surabaya citizens (Badan Pusat Statistik, Lembaga Pemerintah Nondepartemen, 2005). However, by April 2014 its social media accounts have only reached 3738 people, consisting of 3290 people on Facebook, 172 on Twitter and 276 on Instagram. This means that it was only able to reach 1.2% of their target market through the social media platforms.
Considering that the company now has 12 stores spread all over Surabaya, covering 10 different sub-districts of Surabaya, it has the advantage to reach consumers through its different outlets as its main distribution channels and employees to communicate and build consumer brand knowledge. Therefore it is logical to find that the company’s viral marketing through social media platforms is insignificant towards consumer brand knowledge.
CONCLUSION
The ANOVA table, showed that the p-value under the significance F significance was 0.000 and this value is below the 0.05 significance level. Hence, it can be concluded that at least one of the independent variables has significant effect towards the dependent variable of this research. All p-value for viral marketing through Facebook, Twitter and Instagramare greater than 0.05 significance level. Therefore, the result of p-value for the T-test showed that none of the independent variables are significantly affecting the dependent variable individually. The three possible reasons behind this phenomena are first, social media platforms has not been utilised as optimally as it
could have been, resulting in not so effective viral marketing activities. The second argument is that the company uses some of the least suggested and effective viral marketing approaches. The third argument is that respondents may have attained prior consumer brand knowledge from other sources with higher touch points than viral marketing through social media.
There are several limitations found within this research. First is non-generalizability of the results and discussion of this research, because the findings only apply to this research’s particular case. Second is respondent’s honesty because the respondents’ decision to be dishonest can lead to a less effective recommendation and managerial insights. Lastly, there are limited journals and theories to help explore the topic in greater depth, where if there were access to more supporting and researches, stronger conclusions and recommendations may be derived. For future researches, it is suggested to expand research scope, such as investigating viral marketing activities across several brands, as well as by looking into other brand dimensions, such as brand loyalty, customer satisfaction, brand equity and so forth.
REFERENCES
Badan Pusat Statistik. (2005). Jumlah Penduduk menurut Kelompok Umur, Jenis Kelamin, Provinsi, dan Kabupaten/Kota, 2005. Sensus Penduduk Antar Sensus. Surabaya: Badan Pusat Statistik.
Barnes, N. G., Lescault, A. M. & Wright, S. (2014). 2013 Fortune 500 - UMass Dartmouth. Retrieved February 26th, 2014 from UMassD Website.
Choi, Y. G., Ok, C. & Hyun, S. S. (2011). Evaluating relationships among brand experience, brand personality, brand prestige, brand relationship quality, and brand loyalty: an empirical study of coffeehouse brands. Unpublished format presentation report, University of Massachusetts Amherst Libraries.
Cooper, D. R. & Schindler, P. S. (2011). Business research methods. New York: McGraw-Hill.
Dobele, A., Toleman, D. & Beverl (2005). Controlled infection! Spreading the brand message through viral marketing. Business Horizons, 48 (2), pp. 143--149.
171 Francoeur, B. (2004). Brand image and Walt
Disney: a qualitative analysis of magical gathering. Journal Of Undergraduate Research, 4 (1), pp. 1--8.
Ghozali, I. (2011). Aplikasi analisis multivariate
dengan program IBM SPSS 19. (5th
edition). Semarang, Badan Penerbit Universitas Diponegoro.
Glynn, M. S., Motion, J. & Brodie, R. J. (2007). Sources of brand benefits in manufacturer-reseller B2B relationships. Journal Of Business & Industrial Marketing, 22 (6), pp. 400--409.
Hair, J. (2010). Multivariate data analysis (1st ed.). Upper Saddle River, NJ: Prentice Hall.
Helm, S. (2000). Viral marketing-Establishing customer relationships by'word-of-mouse'. Electronic Markets, 10 (3), pp. 158--161. Hinz, O., Skiera, B., Barrot, C. & Becker, J. U.
(2011). Seeding strategies for viral marketing: an empirical comparison. Journal Of Marketing, 75 (6), pp. 55--71. Heffernan, V. (2013). Instagram. Wired, Iss. 5 p.
n/a.
Hollensen, S. (2011). Global Marketing:5th Revised edition. Harlow: Financial Times Prentice Hall.
Hussein, A. (2012). Customer's Satisfaction and Brand Awareness. Undergraduate. Haaga-Helia University of Applied Sciences. Retrieved March 5th, 2014 from Open Repository of the University of Applied Sciences.
Jalilvand & Samiei, N. (2012). The effect of electronic word of mouth on brand image and purchase intention: An empirical study in the automobile industry in Iran. Marketing Intelligence & Planning, 30 (4), pp. 460--476.
Jansen, B. J., Zhang, M., Sobel, K. & Chowdury, A. (2009). Twitter power: Tweets as electronic word of mouth. Journal Of The American Society For Information Science And Technology, 60 (11), pp. 2169--2188. Kathiravanaa, C., Panchanathamaa & Anushanb,
S. (2010). The Competitive Implications of Consumer Evaluation of Brand Image, Product Attributes, and Perceived Quality in Competitive Two-Wheeler Markets of India. Serbian Journal Of Management, 5 (1), pp. 21--38.
Keller, K. L. (2003). Brand synthesis: The multidimensionality of brand knowledge. Journal Of Consumer Research, 29 (4), pp. 595--600.
Krivak, T. (2008). Facebook 101: Ten things you need to know about Facebook. Information Today, 25 (3), p. 1.
Leskovec, J., Adamic, L. A. & Huberman, B. A. (2007). The dynamics of viral marketing. ACM Transactions On The Web (TWEB), 1 (1), p. 5.
Lind, D., Marchal, W., & Wathen, S. (2010). Statistical Techniques in Business and Economics (14th ed.). New York: McGraw-Hill.
Malar, L., Krohmer, H., Hoyer, W. D. & Nyffenegger, B. (2011). Emotional brand attachment and brand personality: the relative importance of the actual and the ideal self. Journal Of Marketing, 75 (4), pp. 35--52.
Mancini, J. F. (2009). 8 Things You Need to Know about Twitter and Business. Infonomics, 23 (5), p. 18. Retrieved March 11th, 2014 from AIIM International. Myers, A. B. (2012). The Instagram Effect. Wired,
Iss. 1 p. n/a.
Odhiambo, M., Adhiambo, C. & Others (2012). Social Media as a Tool of Marketing and Creating Brand awareness: Case study research. Vaasan Ammattikorkeakoulu University of Applied Sciences.
Palka, W., Pousttchi, K. & Wiedemann, D. G. (2009). Mobile word-of-mouth--A grounded theory of mobile viral marketing. Journal Of Information Technology, 24 (2), pp. 172--185. Open University Press. Pallant, J. (2005). SPSS survival manual (1st ed.).
Maidenhead, Berkshire. U.K.
Raditya, A. Personal Interview. February 10th. 2014.
Redwing. (2013). Social media - Redwing. Retrieved Feb 26th, 2014 from:
http://redwing-asia.com/market-data/social-media-2/
Sharma, S. & Rehman, A. (2012). Assessing the impact of web 2.0 on consumer purchase decisions: Indian perspective. International Journals Of Marketing And Technology, 2 (7), pp. 125--138.
Tabachnick, B. G. & Fidell, L. S. (2007). Using multivariate statistics. Boston: Pearson/Allyn & Bacon.
Themba, G. & Mulala, M. (2013). Brand-Related eWOM and Its Effects on Purchase Decisions: An Empirical Study of University of Botswana Students. International Journal Of Business & Management, 8 (8).
We Are Social Singapore. (2012). Social Digital and Mobile in Asia. Retrieved February
26th, 2014, from
http://wearesocial.sg/blog/2012/10/social-digital-mobile-asia/
172 Videos, and Social Media to Market Your Brand (1st ed.). McGraw-Hill Education. Wiedermann, D. G. (2007). Exploring the Concept