M E D I A I N F O R M A S I , P R O F E S I , D A N K O M U N I K A S I P E R E N C A N A A N P E M B A N G U N A N
MA J A L A H T R I W U L A N l E D I S I 0 1 / TA H U N X V I I / 2 0 1 1 l I S S N 0 8 5 4 - 3 7 0 9T
Penguatan Tanggungjawab Sosial
Masyarakat: Studi Kasus Desa Pesisir
T
Revisiting ‘Pro-Poor Growth‘ Concept
T
Indeks Kesengsaraan dan Kondisi
International Tourism Strategy for
Indonesia
Desy Anisya Farmaciawaty
Daya Saing Produk Ekspor
Manufaktur Indonesia dengan
Metode RCA Dinamis
Mochammad Rizky M dan Amalia
Adininggar Widyasanti
Penguatan Tanggungjawab Sosial
Masyarakat: Studi Kasus Desa
Pesisir
Bustang
Stormwater Reuse Scheme for
Jakarta: an Option to Ensure Water
Sustainability
Tirta Sutedjo
Pembangunan Hukum Berbasis
Kearifan Lokal
Hendra Wahanu Prabandani
Public Procurement Reform:
Re-Organizing Public Rocurement in
Indonesia
Khairul Rizal
2
12
16
24
29
34
Analisis Pengukuran Efektifitas Diklat
Haryanto
Kontekstualisasi Evaluasi Kinerja
Pembangunan Daerah dalam
Penyusunan RKP
Darmawijaya
Paradigma Pengurangan Risiko
Bencana
Endang Indriati S
Upaya Mengelola Hutan Indonesia
Amor Rio Sasongko
Revisiting ‘Pro-Poor Growth ‘ Concept
Mohammad Roudo
Reforma Agraria yang Berkeadilan
bagi Pembangunan Nasional
Hernydawaty
Model Pembinaan Jabatan
Fungsional Perencana: Tinjauan Awal
Kajian Retrospektif
Guspika
Peran Kepemimpinan Nasional
dalam Implementasi Pancasila
Iwan Nugroho
38
44
49
54
60
66
71
77
Penanggung Jawab : Sekretaris Kementerian PPN/Sestama Bappenas, Pemimpin Umum : Dida Heryadi Salya, Budi
Hidayat Pemimpin Redaksi : Herry Darwanto Dewan Redaksi : Hanan Nugroho, Leonardo Adypurnama al. Teguh Sambodo, Tatang Muttaqin, Rizang Wrihatnolo, Rudi Arifiyanto Desain Grafis : Tri Wisnuasih Pratiwi, Sarono Santoso
Sekretariat : Yunhri Trima Vibian, Wildawati, Myda Susanti, Budi Cahyono, Endah Widyastuti, Sovi Dasril, Mohammad
Fahmy Fadly Distribusi : Ali Sahbana, Saleh MHD, Rusmawel Zuharmirza, Nasan Tata Letak : Riduan
Alamat Redaksi Jalan Taman Suropati No. 2 Gedung Sayap Timur Lantai 3 Jakarta Pusat Telp. (021) 3905650 Ext. 3545
Telp./Fax.(021) 3161762 [email protected] websitehttp://www.bappenas.go.id
Nomor STT 1685/SK/Ditjen PPG/STT/1991 Nomor ISSN 0853-3709
M E D I A I N F O R M A S I , P R O F E S I , D A N K O M U N I K A S I P E R E N C A N A A N P E M B A N G U N A N
Beberapa tahun yang lalu, Indonesia diantisipasi akan masuk ke dalam kelompok negara BRIC (Brazil, Rusia, India, dan China) yaitu negara-negera berkembang yang maju (emerging countries). Namun dalam sidang tahunan BRIC kali ini, justru Afrika Selatan yang diundang masuk ke dalam kelompok itu. Manfaat memasukkan Indonesia mungkin tidak cukup besar untuk mengangkat kekuatan tawar BRIC dalam berhadapan dengan kelompok negara maju G-8. Beda dengan Afrika Selatan, walaupun dari jumlah penduduk dan besaran PDB berada di bawah Indonesia, namun Afrika Selatan dianggap mewakili negara-negara Afrika, sehingga semua benua kini terwakili dalam BRICS.
Munculnya BRICS tidak terlepas dari pemikiran Jim O’Neill dari Goldman Sachs pada tahun 2001. Pada saat itu ia memperkirakan bahwa negara-negara Brazil, Rusia, India dan China akan menjadi negara-negara maju di dunia, menggantikan negara-negara kaya di Eropa dan Amerika Utara saat ini. Delapan tahun setelah pemikiran itu muncul, terbentuklah BRIC, yang kemudian menjadi BRICS pada tahun 2011 ini.
Tujuan pembentukan BRIC adalah untuk mencapai
perdamaian, keamanan dan kemajuan bersama. BRICS ingin berkontribusi pada pembangunan umat manusia yang adil dan merata (equitable and fair) di muka bumi. BRICS adalah platform untuk berdialog dan bekerjasama secara pragmatis dalam berbagai bidang, tidak hanya ekonomi, keuangan dan pembangunan; namun juga politik, kebudayaan, teknologi. dll.
Pada pertemuan yang ketiga di China pertengahan bulan April 2011, BRICS membuat deklarasi Sanya (Sanya adalah lokasi pertemuan tahun ini), yang berintikan: akan mengupayakan perkembangan ekonomi dunia yang tinggi, mantab, dan seimbang dalam jangka panjang (long-term steady, sound and balanced growth of the world economy). Kerjasama diantara negara-negara BRICS mencakup bidang-bidang energi, industri penerbangan, telekomunikasi, pangan, statistik, antimonopoli, penelitian, keuangan, koperasi, perkotaan, kepemerintahan lokal, kesehatan, kebudayaan, olahraga, lingkungan, inovasi, farmasi, dan tentunya perdagangan dan investasi, dll.
BRICS juga berencana mengurangi penggunaan dolar dalam transaksi keuangan internasional, untuk membangun sistem perdagangan dan cadangan devisa multicurrency. Ini berarti mereka akan menggunakan mata uang mereka sendiri dalam melakukan perdagangan diantara mereka. Mungkin terkandung juga keinginan untuk menjadikan Yuan menjadi mata uang perdagangan internasional, sebab volume perdagangan China saja dengan negara-negara lain mencapai 40% perdagangan dunia pada tahun 2010. Demikian juga dalam menyalurkan hutang atau hibah ke sesama negara anggota BRICS, akan digunakan mata uang mereka sendiri.
Kendati ada kesamaan tujuan dalam pembentukan kelompok ini, diantara mereka juga terdapat perbedaan kepentingan. India dan
China akan terus bersaing menimbun migas dan bahan mentah lain untuk keperluan domestik dan ekspor di masa depan. Brazil dan Rusia sama-sama menjual hidrokarbon dan barang tambang ke negara-negara lain. Namun, bisa diramalkan persaingan dagang ini akan dapat diselesaikan oleh mereka demi mengejar keuntungan yang lebih besar. Ke depan, mereka mungkin akan membentuk kelompok ekonomi yang formal seperti Uni Eropa. Mereka juga telah, sedang dan akan menjadi kekuatan politik dunia, khususnya jika PBB dan organisasi-organisasi dunia tidak berperan dalam arah yang memihak negara-negara berkembang.
Keberadaan BRICS dapat membawa dampak negatif bagi perekonomian Indonesia. Perdagangan diantara mereka akan semakin meningkat, dalam upaya menghimpun kekuatan yang dapat menandingi Kelompok G-8. Demikian juga investasi diantara mereka akan meningkat, karena rasa aman dan kepastian yang lebih tinggi dibandingkan jika berinvestasi di negara lain. Pertemuan tahunan diantara mereka akan memudahkan persoalan yang terjadi dapat segera diatasi. Karena perdagangan dan investasi diantara negara-negara BRICS akan meningkat, maka perdagangan dan investasi ke negara-negara lain akan dapat berkurang. Ekspor Indonesia ke China dapat menurun karena Brazil dan Rusia dapat menggantikan Indonesia memasok bahan mentah yang akan diolah di China sebelum dijual ke negara-negara lain. Protes Indonesia terhadap perjanjian ACFTA akan semakin mendorong China untuk mengurangi impor dari Indonesia. Demikian juga investasi China ke Indonesia akan dapat menurun, karena China akan terikat untuk mengutamakan India, Brazil atau Afrika Selatan sebagai lokasi tempat
menanamkan modalnya daripada Indonesia.
Jika kekhawatiran di atas benar terjadi, maka Indonesia perlu segera mengalihkan tujuan ekspornya ke negara-negara lain, antara lain ke Eropa dan Amerika Utara. Indonesia juga perlu lebih aktif mengundang investor dari sana dan dari negara-negara lain untuk mengimbangi menurunnya investasi dari BRICS.
Sebagai negara yang ingin sejajar dengan negara-negara yang telah lebih dahulu maju, Indonesia perlu aktif mengikuti perkembangan kerjasama antarnegara. Karena tidak bisa bergabung dengan BRICS, Indonesia dapat membentuk blok serupa bersama dengan negara-negara emerging lain, seperti Meksiko, Turki dan Korea Selatan. Itu semua membutuhkan perencanaan yang matang, agar memberi manfaat bagi negara-negara anggota sekaligus bagi masyarakat dunia.
Majalah Perencanaan Pembangunan edisi pertama tahun 2011 ini menampilkan beragam artikel menarik yang perlu disimak oleh para perencana pembangunan, baik di pusat maupun di daerah. Semoga bermanfaat dan memberi inspirasi dalam merumuskan pemikiran-pemikiran untuk pembangunan bangsa dan negara.
Selamat membaca.
2
E D I S I 0 1 / T A H U N X V I I / 2 0 1 1Desy Anisya Farmaciawaty
I. Introduction
According to the United Nations World Tourism Organization (UNWTO), international tourism, especially inbound tourism, is a key to the development, prosperity, and well-being for countries in the world. As a worldwide major trade category, tourism is ranked fourth after fuels, chemicals, and automotive product (UNWTO, 2010a). Most developing countries’ income depends on tourism as the main sources for foreign exchange. These statements are supported by the fact that over the last few decades, tourism has been the fastest growing service industry in the world. From the following graph, we can see that the international tourist arrivals show an upward trend from 1990 to 2010 with a decrease only in 2009. Around 935 millions of people in 2010 have travelled worldwide with tourism purposes, more than twice of that in 1990, i.e., 438 millions of people.
Graph 1. International Tourist Arrivals and International Tourism Receipts from 1990 to 2010
852 941
935 877 919 901
802
683
533 433
1000 900 800 700 600 500 400 300 200 100 0
1990 1995 2000 2005 2007 2008 2009 2010* 438 533 683 802 901 919 877 264
Arrivals (millions)
Receipt (US $billion) 405 478 679 858 941 852 935 858
679
478 405
264
Asia and The Pacific
Asia and The Pacific
Source: UNWTO, Tourisms Highlight 2010 edition and World Tourism Barometer, January 2011. Note: *2010 results are UNWTO estimates based on data collected as at January 2011
Realizing these facts, many countries have opened up their tourism destinations and invested in tourism development in order to create jobs and enterprises, develop infrastructure, and gain export revenues. These steps have resulted in a considerable contribution to the global revenue. In 2009, international tourisms receipt was US$ 852 billion, more than triple the value in 1990 (US$ 264 billion). The export income generated from international tourism had exceeded US$ 1 trillion in 2009 or nearly US$ 3 billion a day, which accounted for 30% of the world’s export of commercial service and 6% of total export of goods and services (UNWTO, 2010a).
The benefits of tourism are shared into UNWTO five regions, which are Europe, Asia and the Pacific, Americas, Africa, and Middle East. Among these regions, Europe, as the most mature and largest tourism sector, is historically visited by more than half of the international visitors. As a consequence, Europe always enjoys around 50% of the overall world tourism receipts. Even after the incident of global recession and economic crisis in late 2008 and 2009, their share in 2009 was still 48.5% i.e. US$ 413 billion, although their market shares somewhat declined compared to the previous years.
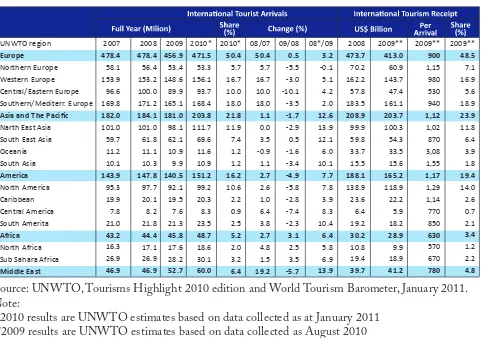
Meanwhile, Asia and the Pacific experienced a steady growth in tourism. See Table 1. Earlier in the 1990s, Asia and the Pacific position of tourist arrivals and tourism receipts were lower than America’s, while currently their position is second to Europe, leaving America behind. In 2010, they showed a remarkable 12.6% growth after the global crisis, and enjoyed 24% of market share.
Table 1. International Tourist Arrivals and Receipts by Region
UNWTO region Asia and The Pacific Narth East Asia
Asia and The Pacific
Source: UNWTO, Tourisms Highlight 2010 edition and World Tourism Barometer, January 2011. Note:
* 2010 results are UNWTO estimates based on data collected as at January 2011 **2009 results are UNWTO estimates based on data collected as August 2010
Nowadays, Asia and the Pacific’s tourism has become the spotlight of the world, since they always experience a double-digit growth rate, boosted by a strong development of the local economies (UNWTO, 2011). Within Asia and the Pacific region, the strongest performance was recorded in the North and South-East Asia sub-regions. From the table above we can see that respectively, the two sub-regions received 11.8% and 6.4% of tourism market share in 2009.
Indonesia, a country within the South East Asia sub-region, was visited by 6.3 million tourists and received US$ 6.3 billion of tourism receipt (UNWTO, 2010a) in 2009. Globally, tourism competitiveness of Indonesia is low. According to Travel and Tourism Competitiveness Report 2009 issued by World Economic Forum, Indonesia’s tourism competitiveness was ranked 81st out of 133 countries, which was lower than Singapore (10st), Malaysia (32st), and Thailand (39st). According to WEF, even though the price competitiveness and the natural resources in Indonesia are rated highly, these advantages are counterbalanced by weaknesses such as underdeveloped infrastructure and concern over tourist safety and security. Tourism competitiveness affects the ability of one country to obtain the tourism market share. With low competitiveness, Indonesia can only have small pieces of Asia and the Pacific tourism market share which was 3.1% in 2009. As a consequence, the tourism ability to enhance foreign exchange revenue, to increase the value-added of Gross Domestic Product (GDP), and to create employment in Indonesia is not optimum.
As a response to the problems above, this paper will discuss Indonesia’s tourism strategy to boost tourism competitiveness by considering information on ongoing and emerging tourism trends in Asia and the Pacific. This paper begins by describing tourism trends in Asia and the Pacific, and Indonesia’s tourism position among other countries. A SWOT analysis is then used to investigate the main issues in tourism sector of Indonesia. Finally, it will provide suggestions and recommendations to solve the problems.
II. Overview of Tourism in Asia and the Pacific
4
E D I S I 0 1 / T A H U N X V I I / 2 0 1 1Table 2. Forecast of International Tourist Arrivals by Region (million)
Asia and The Pacific
1995
Asia and The Pacific
Europe
Source: World Tourism Organization (UNWTO).
Note:* 2010 results are UNWTO estimates based on data collected as at January 2011
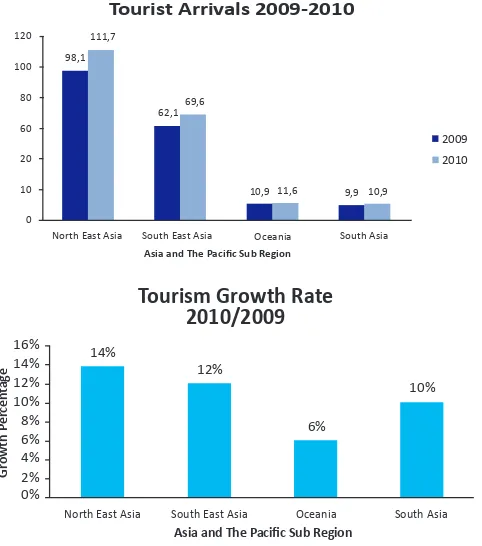
Asia and the Pacific is also known as the most resilient region in term of tourism industry. In late 2008 and 2009, the world was facing an economic downturn caused by the global recession and economic crisis and aggravated by the concerns about the outbreak of the influenza A (H1N1) virus. However, Asia and the Pacific was the first region to recover from the economic hit and in 2010 recorded a truly remarkable 13% growth in tourist arrivals after experienced a decline of -1.7% in 2009 (Table 2).
The extraordinary rebound demonstrated by Asia and the Pacific after the downturn was mainly supported by many countries in North and South-East Asia sub-region, such as China, Hong Kong (China), Korea, Japan, Malaysia, Thailand, Singapore, Indonesia, Australia, etc. Those countries received a larger number of visitors and tourism receipt compared to countries of other sub-region (Graph 2).
16%
North East Asia South East Asia Oceania South Asia
Asia and The Pacific Sub Region
Tourism Growth Rate
North East Asia South East Asia Oceania South Asia Asia and The Pacific Sub Region
2009
Source: World Tourism Organization (UNWTO)
Note: 2010 results are UNWTO estimates based on data collected as at January 2011
In 2010, North East Asia received more than 111 million visitors, increased more than 13 million tourists compared to 2009. Meanwhile, in 2010 tourism in South East Asia has also shown a significant 12% growth and received more than 7.5 million visitors compared to that in 2009. Oceania and South Asia received 11.6 million and 10.9 million of tourists respectively in 2010, and grew by 6% and 10% from 2009 to 2010.
As the largest receiver among other sub-region in Asia and the Pacific, North East Asia also has the largest income from tourism. In 2010, this sub-region received more than US$ 100 billion, which is nearly twice the income of South East Asia, i.e., US$ 54.3 billion. In that year, tourism in Oceania received US$ 33.5 billion, which is more than twice the income of South Asia, i.e., US$ 15.6 billion, even though they were visited by nearly the same number of tourists in 2010.
Graph 4. Tourism Receipts in Asia and the Pacific Sub Region 2009Asia and The Pacific Sub Region
Tourism Growth Rate
Tourist Arrivals 2009-2010Asia and The Pacific Sub Region
0 20 40 60 80 100 120
Source: World Tourism Organization (UNWTO), 2009 based on data collected as at August 2010
III. Comparison of selected individual countries
in Asia and the Pacific
To look more deeply into tourism condition in Asia and the Pacific, we will discuss some selected countries within the sub-regions. These countries are: China, Hong Kong (China), Republic of Korea, Japan, Macao (China) from North East Asia; Indonesia, Malaysia, Singapore, Philippines, Thailand, and Vietnam from South East Asia; India from South Asia; and Australia and New Zealand from Oceania. These countries were selected because they received more than 2 million tourists as well as more than US$ 1 billion tourism receipts in 2009.
In term of tourism receipt, China (US$ 39.7 billion) leads the revenue from tourism as well. However, the second is now occupied by Australia (US$ 25.6 billion) instead of Malaysia, followed by Hong Kong (US$ 16.5 billion), Thailand (US$ 15.9 billion), Malaysia (US$ 15.8 billion), India (US$ 11.1 billion), Japan (US$ 10.3 billion), Republic of Korea (US$ 9.4 billion), Singapore (US$ 9.2 billion), Indonesia (US$ 6.3 billion), New Zealand (US$ 4.4 billion), Vietnam (US$ 3.1 billion) and Philippines (US$ 2.3 billion).
As one of the largest tourist receiver in Asia and the Pacific, China and Malaysia are included in world’s top ten tourist destination, along with France, United States, Spain, Italy, United Kingdom, Turkey, Germany, and Mexico. However, in World’s top ten tourism market share, Malaysia’s position is replaced by Australia. Clearly, China has become the leader of both tourism receiver and generator in Asia and the Pacific, although as an industry, tourism in China was only started after the economic reform and open policy established in 1978. The tourism industry, taken as one of the growth points of the national economy, is playing an increasingly important role in the country’s development (Guangrui, 2006). To ensure the sustainability of tourism long term growth, China has established a five years plan for tourism, and currently they are entering the 12th one. These plans were made to position tourism development strategically as a means of poverty alleviation (UNWTO, 2010b).
Tourist Arrivals in 2009
0 10.000
30.000 40.000 50.000 60.000
Tourism Receipt US$ Billion
5.000 10.000 15.000 20.000 25.000 30.000 35.000 40.000 45.000 39.675
Source: UNWTO 2010, retrieved from World Bank World Development Indicator
Asi
Source: UNWTO 2010, retrieved from World Bank World Development Indicator
Malaysia’s ability to occupy the second place in term of the most visited country by tourists in Asia and the Pacific is a real evidence that their tourism plan has succeeded. Malaysia has raised their commitments towards developing the tourism sector by launching Malaysia Plan that formulated a number of strategies to turn tourism into a top revenue earner for the country, such as introducing Malaysia as Truly Asia into the world that has attracted many tourists. To support these plans, Malaysia has invested millions of dollars for tourism infrastructure in an effort to increase arrivals and receipts. However, the great number of tourist arrival in Malaysia is not compatible with their tourism receipts. Tourist in Malaysia only spent US$ 752.0 per arrival, thus making their tourism receipt is smaller than Australia. Even though Australia was only visited by 5.6 million tourists in 2009, since the tourist spent US$ 4583.5 per arrival, Australia’s tourism receipt was US$ 25.6 billion, thus making Australia as the second largest tourism destination in Asia and the Pacific in terms of money spent.
6
E D I S I 0 1 / T A H U N X V I I / 2 0 1 1To attract tourists to come, Singapore has launched a tourism blueprint titled Tourism 21 that is expected to turn the nation into a world class tourism business centre and the tourism capital (Singh, 2000). To support this plan, the Government also has branded their country as a New Asia (Yue, 2006). In addition, the government also promotes Singapore as the high-end meetings and incentives trade place for business tourism as well as invested in new markets such as sports tourism and casinos (Oxford Analytica, 2008).
Japan in the past was known as the leading in the tourist generator instead of tourist receiver in Asia and the Pacific, since Japan saw tourism as a means to enhance their
international understanding and also to promote their image to the world. However, currently Japan has become a new competitor for other Asia and the Pacific countries because the government has been seriously tried to use tourism as one of their economic booster. As an evidence to this statement, Japan now has an official institution to promote tourism (Koldowski & Yoo, 2006). Yokoso Japan strategy and campaigns are two of this institution’s works that successfully took 3.7% of tourist arrivals and 5.1% of tourism market share.
India, as one country in South Asia, has used tourism as an important means to increase her economic growth. Although their share in term of arrivals is not as big as other countries in North-South East Asia, its market share was bigger than that of Japan or Singapore, since tourists in India were willing to pay more (US$ 2179.7/arrival).
In 2009, Indonesia was able to take 3.5% of Asia and the Pacific arrivals and 3.1% of Asia and the Pacific market share. However, these numbers is far below Indonesia’s neighbour achievement such as Malaysia (13.1% and 7.8%), Thailand (7.8% and 7.8%), and Singapore (4.1% and 4.8%), even though Indonesia is overflowing with wealth in culture and natural beauty. The question of why Indonesia can only take a quarter of Malaysia’s tourist arrivals has become a big concern for Indonesia’s government. To promote tourism and to increase market share, the government has launched a new branding of tourism campaign i.e. Wonderful Indonesia in 2011.
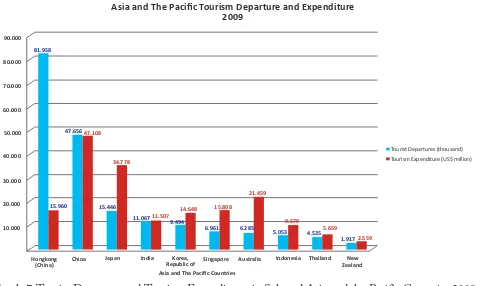
In term of tourist departures, the major tourist generator in Asia and the Pacific in 2009 was Hong Kong (China) with its 82.0 million tourists, followed by China (47.7 million), Japan (15.4 million), and India (11.0 million). Meanwhile, in term of expenditures, the leader in Asia and the Pacific was China (US$ 47.1 billion), followed by Japan (34.8 billion), Australia (US 21.5 billion), Hong Kong (China) (US$ 16.0 billion), Singapore (US$ 15.8 billion), Republic of Korea (US$ 14.7 billion), and India (US$ 11.5 billion). See Graph 7.
81.958
Asia and The Pacific Tourism Departure and Expenditure
2009
China Japan India Korea, Republic of Singapore Asia and The Pacific Countries
Australia Indonesia Thailand New Zealand
Tourist Departures (thousand) Tourism Expenditure (US$ million)
on)
Number of Visitor Arrivals Singapore Unuted States of Anerica Netherlands Germany Philippines Uni Emirat ArabOthers
Visitor Arrivals By Major Markets in Indonesia
Graph 7. Tourist Departure and Tourism Expenditures in Selected Asia and the Pacific Countries 2009 Source: UNWTO 2010, retrieved from World Bank World Development Indicator
The massive number for both tourist departure and tourism expenditure generated by China and Japan has made these countries included in both the World’s Top Ten Tourist Generator and Tourism Expenditure. Therefore, many countries in the world are competing each other with the objective to attract tourists from China and Japan to come to their destination, not only because these countries generate a great deal of tourists but also because the tourists from China and Japan are willing to spent more money in exchange for the benefit they received.
Table 5. World’s Top Ten Tourism Expenditures
Asia and The Pacific Tourism Departure and Expenditure
Japan
Republic of Singapore Asia and The Pacific Countries
Australia Thailand Zealand
on)
Number of Visitor Arrivals Singapore Unuted States of Anerica Netherlands Germany Philippines Uni Emirat Arab Others
Visitor Arrivals By Major Markets in Indonesia
Source: UNWTO 2010, retrieved from World Bank World Development Indicator
Table 6. World’s Top Ten Tourist Departures
Asia and The Pacific Tourism Departure and Expenditure
Japan
Republic of Singapore Asia and The Pacific Countries
Australia Thailand Zealand
Number Countries Departures (Million)
1 Hong Kong SAR, China 81,96
2 Germany 72,30
3 United States 61,42
4 United Kingdom 58,61
5 China 47,66
Number of Visitor Arrivals Singapore Unuted States of Anerica Netherlands Germany Philippines Uni Emirat Arab Others
Visitor Arrivals By Major Markets in Indonesia
IV. Trends of Tourism in Asia and the Pacific
According to a research by UNWTO in 2006, there are some ongoing and emerging tourism trends that currently happen in Asia and the Pacific region. Since the trend will have major impacts on the regional economy, culture, society, environment, and political system to the countries within and outside of the region, then it is very important for the countries to know and understand the trend of tourism development in the region. The ongoing and emerging of tourism trend in Asia and the Pacific region are as follows:
a. Travel has become more activity-interest based rather than destination-based
According to UNWTO, tourists nowadays are deciding what activities they want to take part first, and then decide on the destination that offers them. Therefore, it is important for the destinations to identify themselves with particular unique tourist attraction, such as spa treatment, cruise, wellness/medical treatment, adventure tourism, sport tourism, cultural tourism, etc. In addition, the phenomenon of money-rich and time-poor of the visitor from the Europe has raised demands for an integrated resort, where theme parks, entertainment facilities, hotels, and convention centres are combined in one location.
b. China continue to be the main drivers of tourism industry and tourists generating countries/regions
China’s continuing economic growth has supported the growth of business travel in the world. In 2020, UNWTO predicted that China will need massive resources to support tourism industry, for example in 2020 China will need 2000 new aircraft to accommodate its air transportation needs. China has also become one of the largest tourist generators in the world. UNWTO predicted that in 2020 China will produce 100 million outbound tourists. In addition, tourist from China is also not hesitating to spend more money for tourism. This condition has made Chinese outbound tourists are hotly pursued by countries in the region, particularly by South East Asia and Australia.
c. The development of low cost carriers (LCCs) makes intra and interregional travel more affordable and will change people’s travel habits and patterns
The beginning of LCCs era in Asia has made profound impact on people’s travel habits and patterns. The trend of low airfares is likely to stimulate more travellers in the world as well as to encourage travellers to exchange their annual long-haul leisure trips with several short trips to different destinations. Currently, the LCCs also have served not only the short trip market but also the long haul market. This condition has forced the Full Service Carriers (FSCs) to cut down their operating cost to keep up with the price competition with LCCs.
d. Travel agents transform themselves into travel consultants
These days, travel agents are transforming themselves into travel consultants/advisors who arrange personalized and customized tours for the increasingly experienced travellers. This transformation occurs mainly because their profit are shrinking due to the increase of online bookings and slashing of sales commission from FSCs.
e. Consolidation of social-environmental awareness and consciousness
Nowadays, tourists are more aware and conscious over the environmental impact of tourism as well as the media. Another identified by UNWTO is the possible establishment of an international reference of quality management and environmental management for the tourism industry, which means, the industry will become more regulated in terms of social-environmental requirements.
f. Competition and cooperation among destinations for inbound tourists
According to UNWTO, destinations, regions, and countries are currently competing to pursue hot tourists from China and India. The fierce competitions also have created more cooperation among the countries. The trend of both competition and cooperation is likely to continue as tourists are becoming more experienced, savvy, and look for more diversity. Another trend identified is the regional consolidation that results in a coordinated marketing drive.
g. Asia is becoming a convention hub
Business travel within and to Asia has and will continue to grow fast since Asia become a major recipient of foreign direct investment as well as the increase of many multinational corporations in the region. Therefore, Asia will become the most wanted location for convention. Regarding the convention market, the following trends are observed: a) business market is growing at a faster rate than the leisure market and Asian women business travellers could be the fastest growing segments of the business travel market; b) China’s business travel market is expected to have the highest growth and India is another great potential outbound business travel market to tap; c) the duration of conventions becomes shorter; and d) overall destination appeal is more important than convention facilities when selecting a convention site.
h. Increasing growth of seniors and women travellers boost the demand for cultural and wellness tourism
8
E D I S I 0 1 / T A H U N X V I I / 2 0 1 1people from Japan also prefer short holiday trips than long haul trips. As for women traveller, they are more attracted to shopping, visiting natural and scenic attractions, rest and relaxation, gourmet cuisine sampling, and visiting historic and cultural attractions.
i. Travel safety and health become major concern require timely communication of accurate information to mitigate negative impacts on destinations
Tourists are now more aware and concerned over pandemic outbreaks and terror attacks. In addition, the terrorism attack usually has a more serious impact on business, official mission, and convention travellers. The threat of a pandemic outbreak such as bird flu calls also becomes a concern among destinations and other government agencies. However, timely, accurate and responsible communication is even more important than the outbreak itself because visitors make decisions based not so much on risk itself as on perception of risk. Destination countries therefore should closely monitor media reports to mitigate the negative impact of some irresponsible blanket reports of a pandemic outbreak.
j. Human resources shortage
One of the Asia-Pacific region’s drawing cards is its human resources. However, the increasing demand for tourism in the region has and will continue to create a shortage of human resources in the hospitality and tourism industry. This problem will be more serious in China, Hong Kong SAR, Singapore, Thailand, Indochina and the Middle East.
V. Indonesia in Asia and the Pacific Tourism
Asia and the Pacific is known as the major tourist generator and receiver in the world, however it is still a big question whether Indonesia is able to take some more of the market since Indonesia’s position is not among the top foreign currency earners.
In 2009, it was recorded that the tourist who visited Indonesia was only 6.3 million people. This number is far behind Indonesia’s neighbour such as Malaysia, Thailand, and Singapore, which in the same year attracted 23.6 million, 14.1 million, and 7.5 million visitors respectively. The same condition also applies to tourism receipt. In 2009, Indonesia was only succeeded to book US$ 6.3 billion, while Malaysia, Thailand, and Singapore’s income from tourism was US$ 15.8 billion, US$ 15.9 billion, and US$ 9.2 billion respectively. In term of the number of visitors and tourism income, Indonesia has lost to its neighbour countries in South East Asia, therefore in the future Indonesia’s struggle to obtain more share in Asia and the Pacific tourism would be extremely hard.
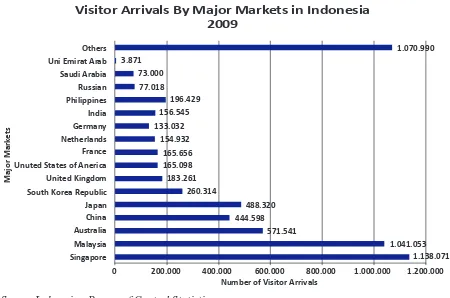
In 2009, Indonesia’s major tourism markets were Singapore and Malaysia, followed by Australia, Japan, and China. In Graph 8, we can see that visitors who came from China and Japan were
only 444.6 thousand and 488 thousand tourists respectively. Compared to the total number of tourists generated by China and Japan in 2009, which were 47.6 million and 15.5 million. Since then, visitors from China and Japan to Indonesia were very small. Therefore Indonesia needs a strategy to attract more tourists from major tourist generators in Asia and the Pacific.
Graph 8. Tourist Arrivals by Major Markets in Indonesia, 2009 Asia and The Pacific Tourism Departure and Expenditure
Japan
Republic of Singapore Asia and The Pacific Countries
Australia Thailand
Number of Visitor Arrivals SingaporeMalaysia Unuted States of Anerica
France
Visitor Arrivals By Major Markets in Indonesia
2009
200.000 0
Source: Indonesian Bureau of Central Statistic
Table 7. Purpose of Visiting Indonesia, 2008-2009
Visitor Share (%) Visitor Share (%)
PURPOSE OF VISIT
o Business 2.115.607 33,93 1.978.434 31,29
o Official Mission 98.474 1,58 104.197 1,65
o Convention 190.970 3,06 205.037 3,24
o Holiday 3.627.861 58,19 3.788.341 59,91
o Education 28.079 0,45 29.532 0,47
Source: Indonesian Bureau of Central Statistic
In 2009, more than half (60.0%) of visitors travelled to Indonesia for a holiday, while a further 32% for the purpose of business. Despite the global recession that hit the world in late 2008 and 2009, the number of visitors to Indonesia for holidays increased considerably, in contrast with the number of visitors for business purposes. This may be caused by the concern of business travellers on travel safety, pandemic outbreak, global economic condition, and travel security such as terrorism activities in Indonesia. Following the serial bombing events in Bali in 2004, bomb attacks at two Jakarta hotels in July 2009 and also the ones that happened recently in 2011 (‘bom buku’), several countries such as Australia, America, and some European countries have issued travel warning to their citizen who wanted to visit Indonesia, which significantly decreased the number of visiting tourist to Indonesia (World Economic Forum, 2009).
Table 8. Tourism Revenue Compare To Other Export Commodities in Indonesia
Commodities Value
(million US$)
1 Gas & petroleum 19.018,30
2 Palm oil 10.367,62
3 Tourism 6.298,02
4 Garments 5.735,60
5 Rubber products 4.870,68
6 Electronic 4.580,18
7 Texiles 3.602,78
8 Paper & paper produc 3.405,01
9 Food products 2.960,73
10 Wood products 2.275,32
11 Chemicals 2.155,41
Rank
2009
act on ct on t on
Source: Indonesian Bureau of Central Statistic
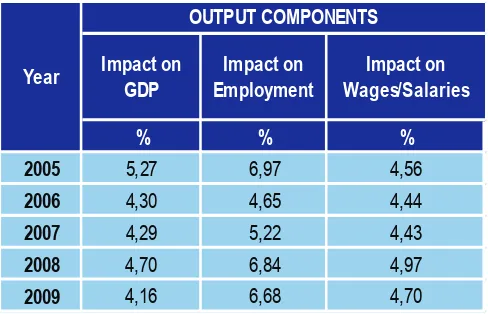
Table 9. The Economy Impact of Tourism in Indonesia, 2005-2009
i
Impact on GDP
Impact on Employment
Impact on Wages/Salaries
% % %
2005 5,27 6,97 4,56
2006 4,30 4,65 4,44
2007 4,29 5,22 4,43
2008 4,70 6,84 4,97
2009 4,16 6,68 4,70
OUTPUT COMPONENTS
Year
Source: The Indonesia Tourism Satellite Account (TSA) 2006-2010
There are some efforts that have been conducted by Indonesian government to increase its tourism competitiveness among Asia and the Pacific countries. The government has conducted cross-sectoral coordination efforts to deal with tourism issues, simplify the process of obtaining visas for foreign tourists by providing the Visa on Arrival (VoA) which covers 63 countries. These efforts are made to encourage more tourists to visit Indonesia.
International marketing and bilateral cooperations with Singapore, Malaysia, and Thailand to increase tourits from China, India and the Middle East is another effort. The joint marketing is conducted in the form of sales cooperation, visa integration, as well as cooperation in cross border management. In addition to these, Indonesian government has also made efforts to increase the total flight seat capacity by increasing flight frequency, considering this mode of transportation has a very big influence for tourism in Indonesia.
One of the efforts to increase the flight seat capacity, especially for the potential markets of Europe, is conducted by inviting a number of Middle East airlines that serves European destinations to extend their flights to Indonesia in addition to the cooperation that has been done with Singapore and
Malaysian’s airlines. Meanwhile, Garuda Indonesia airlines plans to resume its flight to several destinations in Europe such as London, Paris, Frankfurt, and Rome in 2011 since the Europe Union has lifted the ban on flying over European land in July 2009. Hopefully, these efforts may bring positive impacts to increase the number of tourists from Europe and America.
The government has also formulated a policy to liberalize flight business by conducting open sky policy in order to increase the number of alliances among local and international airlines. It could lead to the extension of the flight service scope. Table 10 presents the SWOT analysis of tourism business of Indonesia.
10
E D I S I 0 1 / T A H U N X V I I / 2 0 1 1VI. Strategy to Attract More Tourists From Asia
and The Pacific Region
From the previous analysis on tourism in Asia and the Pacific and especially in Indonesia, there are several strategies that can be proposed to increase the number of visitors to Indonesia as well as the tourism receipt other than maintaining the tourism infrastructure as well as tourist security and safety that is one of the major threatas to tourism in Indonesia, i.e.:.
1. Indonesia needs to be more focused on particular unique tourist attractions, such as marine tourism, adventure tourism, or cultural and heritage tourism; which based on the novel natural beauty of the various destinations in Indonesia. For example, if people around the world want to see to the most beautiful beach on earth, then they will remember Bali and will choose Bali as their top priority to visit. This can be done by establishing certain branding that would significantly related to the tourism attraction that offered by Indonesia. In addition, Indonesia should also consider applying the concept of integrated resorts. This is important to attract tourists from Europe and America who have the characteristic of ‘money-rich and time-poor’.
2. To attract tourists from the largest generator of tourists in Asia and the Pacific, i.e., China and Japan, Indonesia should develop attractions that associated with the characteristics of tourism that preferred by people from China and Japan. For example, Chinese and Japanese would prefer cultural activities rather than shopping
activities since travelling is a form of learning for them. In addition, Indonesia should also develop some more attraction related to Chinese-friendly things, such as culinary and tradition. Active promotion to China and Japan is also considered significant to be conducted as one means to promote tourism. Furthermore, since Indonesia has been granted the approved destination status (ADS) by Chinese government (Pan & Laws, 2003), Indonesia should use this ADS scheme to attract more Chinese tourists by cooperating with certain Chinese operators to arrange, promote and sell travel to specified destinations in Indonesia.
3. Indonesia needs to cooperate with LCCs companies which serves international flights to potential tourism markets such as China and European countries. This cooperation will attract more tourists who consider budget as the higher priority more than services from those countries.
4. To pursue the influx of tourists from major tourists’ generator in the world, Indonesia needs to collaborate with other countries in the term of tourism destinations. For example, Indonesia can collaborate with Singapore and Malaysia so that Indonesia, Singapore and Malaysia regions can be promoted as a single destination in a bundled travelling package. This is important to attract tourists which prefer the combination of short trip rather than one long haul trip as well as to prevent fierce competition with other destinations.
5. Since tourists are more aware and conscious over the environmental impact of tourism, Indonesia needs to develop a sustainable tourism.
6. Indonesia should be well prepared to provide the world class facilities of MICE in cities that have destination appeal, because the overall destination appeal is more important that convention facilities when selecting a convention site. Indonesia should consider this since according to the UNWTO, MICE’s market is growing at a faster rate than the leisure market, and Asian women business travellers are the fastest growing segment of the business travel market. Therefore, in building the facilities to support MICE, Indonesia should take note on the needs of woman travellers, such as providing spa, rest and relaxation areas, shopping centres, natural and scenic attractions, as well as historic and cultural attractions.
7. To overcome skilled human resource shortage in Asia and the Pacific region, Indonesia should promote the quality and quantity of tourism education, and also develop the standard of tourism certification that meets the requirements of the world class standards. By this way Indonesia may export tourism skilled labor to other countries.
VII. Conclusion
From the discussion, we can conclude that the current condition of Indonesian tourism is far below the neighbouring countries in South-East Asia, such as Malaysia, Thailand and Singapore. Therefore, the chance for Indonesia to seize the tourism market share in Asia and The Pacific is considered small. To enhance the opportunity, it is necessary for the Indonesian government to implement various strategies that developed from knowledge about the ongoing and emerging trends in Asia and the Pacific. Some preliminary suggestions have been provided in this article, however, a further enhanced analysis and studies should be conducted to provide more sophisticated solution to the inbound tourism problems in Indonesia, especially from the Asia and the Pacific region. n
Desy Anisya Farmaciawaty adalah Staf Perencana pada Direktorat Kebudayaan, Pariwisata, Pemuda dan Olahraga, Bappenas
References:
Chaisawat, Manat. (2006). Policy and Planning of Tourism Product Development in Thailand: A Proposed Model. Asia Pacific Journal of Tourism Research, 11. Guangrui, Prof. Zhang. (2006). China’s
Outbond Tourism: An Overview. Paper presented at the WTM-Cina Contact Conference. Koldowski, John, & Yoo, Joanne
Jung-Eun. (2006). Seven Dominant Forces Affecting Asia Pacific Travel and Tourism Industry. Journal of Travel and Tourism Marketing, 20(2).
Mak, James, & White, Kenneth. (1992). Comparative Tourism Development in Asia and the Pacific Journal of Travel Research, 31(14).
Oxford Analytica. (2008). SOUTH-EAST ASIA: Tourism reforms will have to wait Oxford Analytica Daily Brief Service.
Pan, Grace W., & Laws, Eric. (2003). Tourism Development of Australia as a Sustained Prefered Destination for Chinese Tourists. Asia Pacific Journal of Tourism Research, 8(1).
Singh, Amrik. (2000). Asia Pacific Tourism Industry: Current Trends and Future Outlook. Asia Pacific Journal of Tourism Research.
UNWTO. (2006). Mega-Trends of Tourism in Asia-Pacific UNWTO. (2010a). UNWTO Tourism Highlights 2010
Edition: UNWTO.
UNWTO (Producer). (2010b). Riding on the boom, China is working on the Strategic Plan for its Tourism Development for 2011-2015. Asia and the Pacific. UNWTO. (2010c). Yearbook of Tourism Statistics,
Compendium of Tourism Statistics and data files, from http://data.worldbank.org
UNWTO. (2011). UNWTO World Tourism Barometer (Vol. 9). World Economic Forum. (2009). The Travel and Tourism
Competitiveness Report 2009.
12
E D I S I 0 1 / T A H U N X V I I / 2 0 1 1PENDAHULUAN
Dampak era globalisasi saat ini terasa cukup besar, karena dengan adanya globalisasi memberikan kesempatan suatu negara untuk dapat membuka diri dengan negara lain dan juga memberikan peluang bagi negara lain untuk memanfaatkan potensi pasar di negara tujuan ekspornya. Menurut Singh (1998) dalam Yustika (2007), terdapat lima karakteristik penting dari globalisasi, yaitu: (1) pertumbuhan transaksi keuangan internasional yang cepat; (2) pertumbuhan perdagangan yang cepat, terutama diantara perusahaan-perusahaan transnasional; (3) gelombang investasi asing langsung (Foreign direct investment), yang mendapatkan dukungan luas dari kalangan perusahaan transnasional; (4) timbulnya pasar global; dan (5) penyebaran teknologi dan berbagai pemikiran akibat sistem transportasi dan komunikasi yang cepat.
Salah satu dampak globalisasi perdagangan yang sangat signifikan adalah meningkatnya arus perdagangan antar negara, dimana arus ekspor dan impor dunia terlihat terus mengalami kenaikkan yang pesat. Di tahun 2002, nilai ekspor dunia adalah sebesar 6.535,5 miliar USD dengan impor sebesar 6.406,2 miliar USD. Kemudian, pada tahun 2008, nilai ekspor dunia mencapai 16.011,9 miliar USD dan nilai impornya mencapai 15.826,0 miliar USD. Yang artinya adalah dalam waktu empat tahun perdagangan dunia naik hampir 3 kali lipat, atau tumbuh hampir 300% (Gambar 1).
Mochammad Rizky M dan
Amalia Adininggar Widyasanti
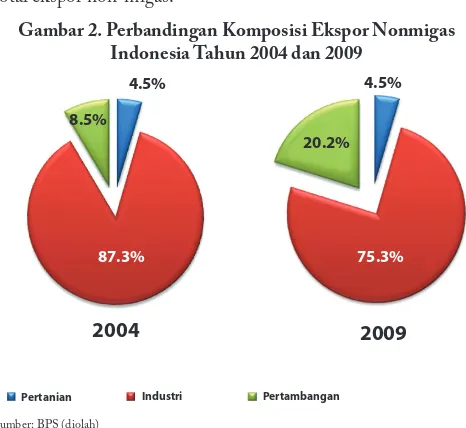
Seiring dengan perkembangan ekspor dunia yang meningkat, ekspor Indonesia juga mengalami peningkatan yang cukup pesat, dimana ekspor produk manufaktur merupakan penyumbang terbesar dalam ekspor non-migas Indonesia. Namun demikian, kontribusi ekspor produk manufaktur terhadap ekspor non-migas terlihat semakin menurun,
sebaliknya kontribusi ekspor komoditas pertambangan semakin meningkat. Pada tahun 2004, nilai ekspor produk manufaktur mencapai sebesar 48,7 miliar USD, dengan proporsi besar sumbangan 87,0 persen dari total ekspor non-migas. Sedangkan pada tahun 2009, nilai ekspor produk manufaktur mencapai 73,4 miliar USD, yang menyumbang sebesar 75,3 persen dari total ekspor non-migas.
Gambar 2. Perbandingan Komposisi Ekspor Nonmigas Indonesia Tahun 2004 dan 2009
Pertanian Industri Pertambangan
Meskipun nilai ekspor industri manufaktur terus mengalami peningkatan seiring dengan semakin meningkatnya pula nilai ekspor non-migas, namun peran dan pertumbuhan ekspor produk manufaktur selama tahun cenderung menurun. Industri manufaktur memiliki peran yang penting terhadap pertumbuhan dan pembangunan ekonomi Indonesia. Selain, menyumbang terbesar terhadap devisa negara melalui ekspor, fokus pengembangan terhadap industri manufaktur
juga disebabkan, antara lain : (1) menyerap tenaga kerja; (2) memenuhi kebutuhan dasar masyarakat; (3) mengolah hasil pertanian dan sumber daya alam; dan (4) memiliki potensi pengembangan ekspor. Sehingga pengembangan industri manufaktur masih sangat perlu dilakukan dalam memberikan nilai tambah dalam perekonomian Indonesia dan mendorong ekspor produk manufaktur yang dapat memberikan efek pengganda yang lebih besar dibandingkan dengan ekspor komoditas. Mengingat pentingnya peran ekspor produk manufaktur terhadap perekonomian Indonesia, tulisan ini akan menyoroti tentang posisi daya saing produk ekspor manufaktur Indonesia di pasar dunia dengan menggunakan metode RCA dinamis. Dengan demikian, dapat diketahui produk manufaktur mana yang memiliki potensi besar untuk didorong ekspornya.
METODOLOGI
Revealed Comparative Advantage (RCA) merupakan salah satu metode praktis untuk mengukur keunggulan yang dapat diperbandingkan dalam suatu daerah atau kawasan. RCA dihitung dengan cara membandingkan kinerja produk ekspor suatu negara dengan ekspor dunia untuk produk tersebut. Konsep ini pertama kali diperkenalkan oleh Ballasa (1965).
Pada perkembangannya metode RCA ini dimodifikasi oleh Valentine dan Krasnick (2000) dan dikenal dengan metode analisis Dinamis RCA (Dynamic of Revealed Comparative Advantage). Rumusan ini sangat bermanfaat untuk
mengkategorikan produk-produk ekspor menjadi enam kategori dengan melihat perbandingan kinerja ekspor domestik negara terhadap proporsi total ekspor dunia. Menurut Valentine dan Krasnick (2000) dalam Edwards (2001), rumus RCA Dinamis dijabarkan, sebagai berikut:
Keterangan :
= Nilai Ekspor Komoditas i di negara j
= Nilai Total Ekspor dari negara j
= Nilai Ekspor Komoditas i di Dunia
= Nilai Total Ekspor Dunia
Tabel 1 Kategori RCA Dinamis
Increasing
Sumber : Valentine dan Krasnick (2000) dalam Edwards (2001)
0
Gambar 1. Pertumbuhan Ekspor dan Impor Dunia
14
E D I S I 0 1 / T A H U N X V I I / 2 0 1 1DATA
Dalam tulisan ini, data yang digunakan untuk melakukan analisis diperoleh dari data UNCOMTRADE (United Nations Commodity Trade), dengan klasifikasi SITC (Standard International Trade Commodity) Rev. 3. Data SITC ini merupakan suatu pengklasifikasian barang-barang yang digunakan untuk mengelompokkan ekspor dan impor dari suatu negara yang dapat dibandingkan dengan negara dan tahun yang berbeda. Klasifikasi berdasarkan kode SITC, saat ini telah di revisi sebanyak empat kali untuk menjadi sebuah standar untuk negara-negara di dunia. Revisi terakhir dilakukan pada tahun 2007.
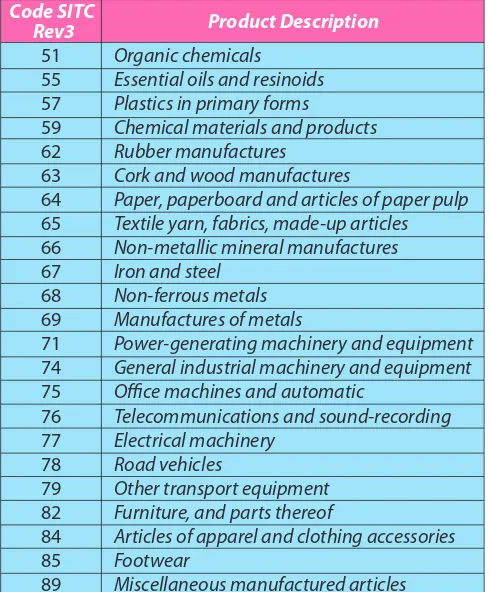
Adapun jumlah komoditas yang diteliti dibatasi pada produk manufaktur yang dikelompokkan ke dalam 23 kelompok SITC (2 digit). Pemilihan kelompok produk manufaktur tersebut didasarkan pada kelompok produk SITC (2-digit) yang memberikan kontribusi ekspor terbesar. Keterangan kelompok produk yang dianalisis dalam tulisan ini dapat dilihat pada Tabel 2.
Tabel 2 Kelompok Produk Manufaktur yang Dianalisis (SITC Rev. 3)
Code SITC Essential oils and resinoids Plastics in primary forms
Chemical materials and products Rubber manufactures
Cork and wood manufactures
Paper, paperboard and articles of paper pulp Textile yarn, fabrics, made-up articles Non-metallic mineral manufactures Iron and steel
Non-ferrous metals Manufactures of metals
Power-generating machinery and equipment General industrial machinery and equipment Office machines and automatic
Telecommunications and sound-recording Electrical machinery
Road vehicles
Other transport equipment Furniture, and parts thereof
Articles of apparel and clothing accessories Footwear
Miscellaneous manufactured articles
Sumber : United Nations Commodity Trade, 2010
HASIL ANALISA
Berdasarkan hasil perhitungan dengan menggunakan RCA dinamis, terlihat bahwa tidak ada kelompok produk manufaktur Indonesia yang masuk ke dalam kategori lost opportunity
maupun lagging opportunity (Tabel 3).
Tabel 3 Hasil Analisis RCA Dinamis
Share Manufactures in Indonesia Export > Share Manufactures in World Export
Increasing RCA
Share Manufactures in Indonesia Export < Share Manufactures in World Export
Decreasing RCA (SITC Rev 3)
Lost
Opportunity Leading Retreat
55 64
Lagging Opportunity
Dilain pihak, beberapa kelompok produk manufaktur Indonesia masuk dalam kategori Rising Star, hal ini berarti produk manufaktur tersebut memiliki keunggulan daya saing terhadap produk manufaktur di dunia, di tengah meningkatnya permintaan ekspor dunia terhadap produk tersebut. Produk manufaktur tersebut antara lain adalah: kimia dan produk kimia (SITC 59), Besi dan Baja (SITC 67), Logam Non Besi (SITC 68), Barang-barang Logam (SITC 69), Peralatan dan Mesin Industri Umum (SITC 74), dan Peralatan Transportasi Lain-lain (SITC 79).
Selain itu, beberapa produk manufaktur Indonesia masuk ke dalam kategori Falling Star, yang artinya adalah share ekspor produk manufaktur tersebut meningkat tetapi di tengah permintaan dunia yang cenderung menurun. Dimana penurunan permintaan dunia ini diindikasikan dengan menurunnya share ekspor dunia untuk produk tersebut (terhadap total ekspor dunia). Produk manufaktur yang tingkat daya saingnya termasuk ke dalam falling star adalah Barang-barang Karet (SITC 62) dan Kendaraan Bermotor (SITC 78).
Manufaktur Lain-lain (SITC 89).
Namun, masih terdapat produk manufaktur Indonesia yang masuk dalam kategori Leading Retreat, dimana penurunan share ekspor produk manufaktur Indonesia tersebut lebih tinggi dibandingkan dengan penurunan permintaan dunia terhadap produk tersebut. Sehingga, Indonesia kehilangan pasar lebih cepat dibandingkan dengan kecepatan penurunan permintaannya. Produk manufaktur yang masuk ke dalam kategori leading retreat adalah Minyak Essential dan Resinoida (SITC 55) dan Kertas, Karton dan barang dari kertas bubur (SITC 64). Meskipun demikian, tidak terdapatnya produk manufaktur Indonesia yang masuk dalam kategori Lost Opportunity dan juga Lagging Opportunity, yang berarti bahwa tidak ada produk unggulan manufaktur Indonesia kehilangan peluang pasar.
KESIMPULAN
Daya saing produk manufaktur yang masuk dalam persaingan ekspor menjadi perhatian yang sangat penting karena peningkatan ekspor produk manufaktur akan menjadi
pendorong penyerapan tenaga kerja dan pertumbuhan ekonomi. Dari hasil analisis ini terlihat bahwa pada umumnya kelompok produk utama ekspor manufaktur (23 kelompok berdasarkan SITC rev 2 digit) memiliki tingkat daya saing yang cukup baik. Bahkan, beberapa diantaranya (kimia dan produk kimia, Besi dan Baja, Logam Non Besi, Barang-barang Logam, Peralatan dan Mesin Industri Umum, dan Peralatan Transportasi Lain-lain) masuk ke dalam kategori rising star.
Mengingat pentingnya ekspor produk manufaktur bagi perekonomian Indonesia, ke depan, pemerintah perlu kiranya memberikan perhatian terhadap upaya-upaya yang bisa mendorong peningkatan ekspor produk manufaktur sehingga kontribusi ekspor produk manufaktur dapat lebih meningkat. Beberapa upaya yang disarankan adalah Penguatan dan pengembangan klaster industri dengan koordinasi lintas sektor yang lebih baik, pengurangan hambatan ekspor terutama hambatan non-tarif di negara-negara tujuan ekspor utama, perbaikan kerangka regulasi standar produk, peningkatan infrastruktur pendukung ekspor, serta peningkatan inovasi dan pemanfaatan teknologi untuk meningkatkan produktivitas industri nasional. n
Mochammad Rizky M adalah mahasiswa Fakultas
Ekonomi-Universitas Brawijaya, Malang yang melakukan kerja praktek di Direktorat Perdagangan, Investasi, dan Kerjasama Ekonomi Internasional, Bappenas pada bulan Juli 2010.
Amalia Adininggar Widyasanti adalah Kasubdit Perdagangan pada Direktorat Perdagangan, Investasi,
dan Kerjasama Ekonomi Internasional, Bappenas.
DAFTAR PUSTAKA
Atmawinata, Achdiat, dkk. 2008. Kedalaman Struktur Industri yang Mempunyai Daya Saing di Pasar Global. Powerpoint IJ-EPA.
Bappenas. 2009. Perdagangan dan Investasi di Indonesia: Sebuah Catatan Tentang Daya Saing dan Tantangan Ke Depan. Jakarta: Bappenas
Basar, Adhy. 2008. Potret Karet Alam Indonesia. Jakarta: BNI Economic Review.
DAI. 2007. Studi Hambatan Kebijakan Bagi Industri Furnitur: Hasil Studi di Jawa Timur dan Jawa Tengah. REDI Darmayanti, Mega. 2007. Analisis Struktur, Kinerja dan Kluster Industri
Logam Dasar Besi dan Baja di Indonesia. Bogor: IPB Edwards, Lawrence and Schoer, Volker. 2001. The Structure and
Competitiveness of South African Trade. Cape Town: TIPS. Hidayat, MS. 2010. Ekspor Pulp dan Paper Harus Naik 100%.
http://okezone.com (Diakses pada Agustus 2010) Kementerian Perindustrian. 2009. Laporan Pengembangan
Sektor Indsutri 2004-2009. Jakarta: Kementerian Perindustrian
Kuncoro, Mudrajad. 2008. Mendongkrak Daya Saing. http:// okezone.com (Diakses pada Agustus 2010) Miranti, Ermina. 2007. Mencermati Kinerja Tekstil Indonesia:
Antara Potensi dan Peluang. Jakarta: BNI Economic Review.
Suratmo, F. Gunarwan. 2000. Prospek dan Tantangan Pengembangan Industri Pulp dan Kertas Indonesia Dalam Era Ekolabeling dan Otonomi Daerah. Jurnal Manajemen Hutan Tropika Vol. 6 No. 2.
Tambunan, Tulus. 2006. Perkembangan dan Daya Saing Ekspor Meubel Kayu Indonesia. Working Paper Series No.5 FE-Universitas Trisakti.
Widyasanti, Amalia Adininggar. 2007. Kinerja dan Prospek Perdagangan Luar Negeri Indonesia. Kertas Kerja (tidak dipublikasikan).
16
E D I S I 0 1 / T A H U N X V I I / 2 0 1 1Abstrak
Penelitian ini berupaya untuk merumuskan strategi peningkatan tanggungjawab sosial dalam rangka pemberdayaan keluarga miskin di desa pesisir. Metode riset yang digunakan adalah survei lapangan ditambah dengan wawancara mendalam pada 62 orang sampel terpilih. Kegiatan penelitian dilaksanakan mulai November 2006 sampai April 2007. Data yang diperoleh dianalisis dengan menggunakan metode korelasi analisis jalur (path analysis). Temuan tersebut menunjukkan bahwa tingkat tanggungjawab sosial masyarakat cukup tingi. Dinamika tanggungjawab sosial sebagai salah satu modal sosial dipengaruhi oleh organisasi lokal, pendapatan, dan pendidikan formal masyarakat. Berdasarkan temuan-temuan tersebut upaya peningkatan tanggungjawab sosial sebagai modal sosial memerlukan fasilitasi dan komitmen yang kuat dari pemerintah dalam bentuk kebijakan. Kebijakan tersebut diharapkan menjadi pemicu untuk mengoptimalisasikan potensi masyarakat sebagai modal sosial dalam pemberdayaan masyarakat miskin perdesaan.
Kata kunci: tanggungjawab sosial, kelembagaan lokal, keluarga miskin
1. PENDAHULUAN
Tanggungjawab sosial seringkali diasosiasikan dalam pengertian kewajiban yang mestinya dilakukan oleh pihak tertentu. Padahal secara substansial/hakekatnya tidak dapat dilepaskan dari kewajiban yang mestinya dilakukan oleh semua komponen masyarakat dan pemerintah. Kondisi ini erat kaitannya dengan proses pelaksanaan dari tanggungjawab sosial sesungguhnya
Bustang
yang meliputi banyak aspek kehidupan yang pada akhirnya berdampak pada kesejahteraan masyarakat secara keseluruhan.
Dalam ajaran agamapun tanggungjawab sosial banyak disebut sebagai kewajiban-kewajiban yang mestinya dilaksanakan oleh setiap ummat beragama. Dalam konteks ini penghargaan agama ditunjukkan oleh para pemeluknya yang dengan sukarela memberikan bantuan kepada kelompok kurang mampu (miskin). Namun demikian, dalam perkembangan selanjutnya, konsepsi tanggungjawab sosial tidak terkait hanya pada salah satu lembaga atau komponen saja. Tanggungjawab sosial hakekatnya menjadi tanggungjawab semua pihak, yang merupakan kolektivitas dalam melakukan tindakan dan upaya-upaya menekan perilaku yang tidak etis, yang secara langsung atau tidak langsung dapat mengancam keamanan dan kenyamanan masyarakat dalam kehidupan sosial (Anonim, 2007). Dengan demikian hakekatnya tanggungjawab sosial harus melingkupi perlindungan terhadap masyarakat atau penduduk lokal dan lingkungan fisik masyarakat dari berbagai ancaman yang dapat merugikan komuniti lokal.
Kotler dan Lee (2005) memandang bahwasanya tanggungjawab sosial merupakan suatu bentuk komitmen untuk meningkatkan kesejahteraan masyarakat melalui praktek atau kegiatan tertentu yang mempergunakan sumberdaya yang mereka miliki. Dalam hal ini terdapat kebebasan yang dimiliki individu atau kelompok masyarakat untuk mewujudkan kepeduliannya kepada kelompok masyarakat sasaran, baik dalam menentukan tujuan, jenis kegiatan, kelompok sasaran, alokasi sumberdaya yang dimiliki untuk kegiatan tersebut, dan sebagainya.
Seiring dengan krisis ekonomi yang mulai melanda Indonesia 1997, jumlah penduduk miskin kembali meningkat
(Bappenas,2003). Pada rentang 1997 – 2002, jumlah penduduk miskin tertinggi terjadi pada tahun 1998, yakni 49,5 juta jiwa atau 24, 2 persen dari jumlah penduduk Indonesia. Namun demikian, dengan kecenderungan semakin membaiknya perekonomian Indonesia, maka tingkat kemiskinan terus menerus mengalami penurunan secara bertahap. Bappenas (2005), tahun 2004 jumlah penduduk miskin sekitar 36,1 juta jiwa atau 16, 6 % dari total jumlah penduduk. Kemiskinan tersebut tersebar di perkotaan dan perdesaan dengan rincian: (a) jumlah penduduk miskin di perkotaan 11,5 juta jiwa (12,6 %); (b) jumlah penduduk miskin diperdesaan 24, 6 juta jiwa (19,5 %).
Permasalahan mengenai kemiskinan yang menjadi sasaran dari pada kegiatan pemberdayaan membutuhkan komitmen masyarakat agar dapat berkontribusi pada: pembangunan ekonomi berkelanjutan yang memerlukan kerjasama antar individu dalam suatu kelompok, antar keluarga dalam suatu masyarakat pada lingkup yang lebih besar untuk meningkatkan kualitas hidupnya. Contoh bentuk kegiatan tanggungjawab sosial menurut Kotler dan Lee (2005) yaitu: bidang kesehatan, keamanan, pendidikan, dan pelatihan kerja bidang tertentu. yang diberikan dapat berupa: dana (modal), pinjaman, biaya promosi, tenaga (bimbingan teknis tenaga ahli), peralatan/ teknologi, akses informasi, dan sebagainya.
Dari berbagai latar belakang pemikiran tersebut, maka penting dipikirkan suatu upaya memampukan (empowering) kelompok miskin yang ada di dalam lingkungan masyarakat perdesaan melalui tanggungjawab sosial. Sebagaimana diyakini upaya berkelompok pada satuan individu miskin diduga lebih mengutamakan bagaimana hanya bisa bertahan untuk hidup tanpa memikirkan masa depannya. Oleh karena itu, perlu ada kearifan yang dapat melihat potensi serta faktor-faktor yang berpengaruh, mampu mendorong, memfasilitasi kesadaran (awareness) dan memunculkan kekuatan dirinya sendiri melalui tanggungjawab sosial bersama.
Dengan demikian untuk mengubah kondisi masyarakat miskin di desa pesisir dari ketidakberdayaan menjadi berdaya melalui aktualisasi tanggungjawab sosial, maka penelitian ini penting menjawab rumusan permasalahan berikut: (1) Bagaimana tingkat aktualisasi tanggungjawab sosial masyarakat dalam membantu keluarga miskin di desa pesisir?, (2) Faktor-faktor apa yang mempengaruhi tanggungjawab sosial masyarakat pada keluarga miskin di desa pesisir? (3) bagaimanakah model pemberdayaan yang efektif untuk meningkatkan tanggungjawab sosial masyarakat?
Adapun tujuan penelitian ini adalah: (1) Menjelaskan tingkat aktualisasi tanggungjawab sosial masyarakat dalam membantu keluarga miskin di desa pesisir. (2) Menjelaskan faktor-faktor yang mempengaruhi tanggungjawab sosial masyarakat pada keluarga miskin di desa pesisir, dan (3) Merumuskan strategi peningkatan tanggungjawab sosial masyarakat terhadap keluarga miskin di desa pesisi?
Berdasarkan penjabaran tinjauan pustaka dan
kerangka pemikiran, maka dirumuskan hipotesis
penelitian sebagai berikut:
Terdapat hubungan yang nyata antara karakteristik individu, organisasi kemasyarakatan lokal, peran organisasi pemerintah lokal dengan pemahaman terhadap kemiskinan.
18
E D I S I 0 1 / T A H U N X V I I / 2 0 1 1Terdapat hubungan yang nyata antara pemahaman terhadap kemiskinan dengan aktualisasi tanggungjawab sosial masyarakat dalam mengatasi kemiskinan di desa pesisir.
2. METODE PENELITIAN
Populasi penelitian ini adalah seluruh anggota masyarakat di desa Pesisir Kabupaten Bone, yaitu individu yang telah berusia 17 tahun atau sudah menikah yang tinggal di wilayah pedesaan di Kabupaten Bone yang diwakili oleh Desa Ancu Kecamatan Kajuara, yang merupakan desa yang terletak di pesisir. Pengumpulan data dilakukan pada bulan November 2006 sampai April 2007. Data primer diperoleh dengan mendatangi dan melakukan wawancara terhadap responden dengan berpedoman pada kuesioner yang kemudian akan diklarifikasi dengan wawancara mendalam dan wawancara bebas. Penentuan sampel dari populasi dilakukan dengan cluster sampling, jumlah sampel dihitung dengan rumus slovin sehingga diperoleh jumlah 62 responden. Data dianalisis dengan: analisis tabel silang chi square, analisis korelasi product moment, dan analisis jalur.
3. PEMBAHASAN
a. Karakterisitik Responden
Karakteristik masyarakat desa pesisir di Kabupaten Bone yang direpresentasikan oleh sebagian warga masyarakat di Desa Ancu Kecamatan Kajuara, yang diamati dalam penelitian ini meliputi: (1) Jenis kelamin, (2) Umur, (3) Pendidikan formal, (4) Pendidikan non formal, (5) Jenis pekerjaan, dan (6) Tingkat pendapatan. Beberapa deskripsi responden ditampilkan pada Gambar 1.
Gambar 1. Deskripsi Karakteristik Masyarakat Pesisir
rdayakan
Gambar 1 menunjukkan bahwa sebagian besar responden berjenis kelamin laki-laki. Posisi laki-laki dalam masyarakat merupakan tulang punggung keluarga dalam mencari nafkah untuk memenuhi kebutuhan hidup keluarga. Kelompok umur masyarakat sebagian besar diketegorikan muda, yang menggambarkan bahwa kelompok ini adalah anggota masyarakat yang berpotensi sebagai tenaga kerja produktif
di desanya. Kemudian mayoritas penduduk pedesaan adalah kelompok yang belum mampu menyelesaikan pendidikan tinggi. Sedangkan pendidikan non formal yang diikuti pada umumnya adalah mengaji atau belajar ilmu agama (Islam). Tingkat pendapatan mayoritas responden adalah kelompok yang berpendapatan sedang. Umumnya kebutuhan pangan berasal dari hasil produksi menanam sendiri, jadi lebih banyak tidak dihitung sebagai pendapatan.
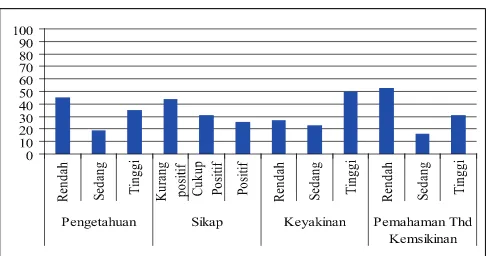
b. Pemahaman Masyarakat Pesisir Terhadap Kemiskinan
Hasil analisis deskriptif menunjukkan bahwa pada umumnya pemahaman masyarakat terhadap kemiskinan cukup baik, yang mengindikasikan bahwa kemiskinan dimaknai tidak saja pada kekurangan kebutuhan dasar manusia akan tetapi terkait juga dengan kebutuhan sosial kemasyarakatan. Oleh karena itu, akan berimplikasi pada adanya kesadaran masyarakat bahwa penanganan masalah kemiskinan sebagai tanggungjawab semua pihak. Pemahaman masyarakat pesisir terhadap kemiskinan disajikan pada Gambar 2 berikut:
Gambar 2. Sebaran Responden menurut Pemahaman terhadap Kemiskinan
rdayakan
Dalam konteks ini pemahaman yang dimaksudkan adalah terkait dengan pemaknaan kemiskinan. Oleh karena itu, tabel tersebut di atas, menjelaskan bahwa pemahaman masyarakat mengenai kemiskinan dapat dikategorikan rendah dan sedang. Orang miskin yang dimaksud dalam pengertian ini mencakup anggota masyarakat yang kurang mampu secara ekonomis untuk memenuhi kebutuhan dasar pangan-sandang, layanan kesehatan, layanan pendidikan, perumahan, air bersih, dan aman serta sanitasi yang baik, yang berpengaruh terhadap aktivitas sehari-hari baik dalam kegiatan produktif maupun sosial kemasyarakatan. Masyarakat juga memaknai pada perkembangannya, bahwa kelompok miskin terkadang tidak mendapatkan perlakuan yang cukup adil dari sebagian masyarakat, padahal kedudukan mereka sama dimata hukum. Disamping itu masyarakat juga mengetahui bahwa kelompok miskin tentu bukanlah menjadi tanggungjawab pemerintah semata dalam menanggulangi kemiskinan tetapi perlu keterlibatan aktif dari semua komponen masyarakat secara langsung maupun tidak langsung.