WATER LEVEL CHANGES OF NAM-CO LAKE BASED ON SATELLITE ALTIMETRY
DATA SERIES
Y. J. Wu, G. Qiao*, H. W. Li
College of Surveying and Geo-Informatics, Tongji University, Shanghai 200092,[email protected];[email protected];[email protected]
Commission III, WG III/9
KEY WORDS: Water Level, Satellite Altimetry, ERS-1, ERS-2, ENVISAT, ICESat-2, CryoSat-2, Nam-Co Lake
ABSTRACT:
Nam-Co Lake is the largest saltwater lake in Tibet and less influenced by human activity. In order to study the change of water level of Nam-Co Lake over the past decades and the impacts of climate change on the region, this paper combined height measurements of ERS-1, ERS-2, ENVISAT, ICESat-2 and CryoSat-2. We found that the water level of Nam Co Lake experienced three periods of change, namely, slightly decreasing period (1992-1993), significantly increasing period (1995-2005), and stable period (2006-2015). The change is consistent with the change of meteorological factors in the Nam-Co Basin. The increase of glacier melt water and precipitation in the basin is considered to be the cause of the overall trend of water level.
1. INTRODUCTION
Lakes are sensitive regions to global environmental change, and the Tibetan Plateau is a typical area of global environmental change. Lakes located in the Tibetan Plateau are mainly in the natural state, with very little impact from human activity. Nam-Co Lake is Tibet's largest saltwater lake which can reflect the climatic conditions well and is an ideal place for study of climate change and its impact on Tibetan Plateau. Therefore, the inland lakes in the Tibetan Plateau are sensitive indicators of human resources, material resources and financial resources. Due to the harsh conditions, many lakes and rivers have difficulties in setting up observation sites around them. In recent years, satellite remote sensing and altimetry technology has been improving. Altimeter and other instruments on the satellite can provide data such as distance, wind velocity and backscatter coefficient of satellite to sea surface which provides possibilities for monitoring inland lakes (Zhai et al., 2002). For example, Phan et al. (2012) used the ICESat-2 satellite altimetry data to monitor the water level changes of 154 lakes in the Qinghai Tibet Plateau during 2003~2009, analyzed the annual water level trend, and calculated the annual volume change. Villadsen et al. (2015) used Cryosat-2 and ENVISAT satellite altimeter data in Ganges River and the Brahmaputra River to study water level changes and captured the maximum of runoff in the late summer maximum, and found out the monsoon precipitation and Himalaya mountain glaciers melting were the
main reason.
Many scholars have carried out a lot of research about rivers and lakes by the use of the satellite altimetry data, but for the typical lake Nam-Co Lake in the Tibetan Plateau, there are only very few researches for long time series water level study based on satellite altimetry data. For example, Song et al. (2016) only used ICESat-2/ CryoSat-2 altimeter data of Nam-Co Lake to study level changes from 2003 to 2013. In order to make up for this deficiency, this paper extracted water boundaries of Nam-Co Lake based on the optical data of Landsat satellites and analyzed changes of water level based on satellite altimetry data of ERS-1, ERS-2, ENVISAT, ICESat-2 and CryoSat-2.
2. RESEARCH AREAS AND DATA
2.1 Study Area
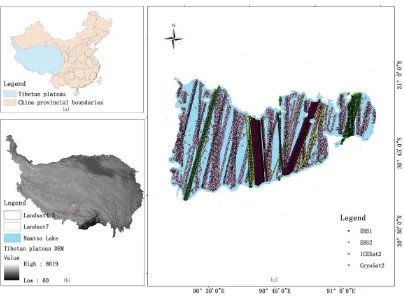
Figure 1. Location of the study area: (a)China map; (b)map of Tibetan Plateau; and (c)map of Nam-Co Lake
2.2 Landsat Remotely Sensed Data
The remote sensing image data used in this paper are Landsat4-5 TM and Landsat7 ETM+ data, and the details are shown in Table 1. These data are downloaded from https://earthexplorer.usgs.gov/, and the path of images is 138, row is 39. It is well known that the Landsat-7 ETM+ airborne scan line corrector (SLC) failed in May 31, 2003, resulting in the loss of data bands in the image acquired thereafter. For the missing image data, this study uses the simple strip removal plug-in tool (landsat_gapfill.sav) provided by ENVI software for gap filling.
Years Satellite Sensor Resolution(m)
1992-2000 Landsat4-5 TM 30
2000-2015 Landsat7 ETM+ 30
Table 1. Summary of remotely sensed data used in this study
2.3 Multi-mission Radar Altimetry Data
2.3.1 ERS-1、ERS-2 and ENVISAT: ERS-1, ERS-2 and ENVISAT are the earth remote sensing satellite developed and launched by the European Space Agency (ESA) with high inversion precision in large water level monitoring. For example, in the Amazon basin, the accuracy of ENVISAT is 30 cm (Silva et al., 2010); in Ganges River, the standard error of ENVISAT inversion is 26 cm (Papa et al., 2010). Because they are belonged to ESA, the three satellites share the same ground track and repeat cycles.
The footprint sizes of ERS-1, ERS-2 and ENVISAT are 1.7 km
in diameter and 350 m in resolution along track. In this paper, GDR (Geophysical, Data Records) data of ESA L2 Ku frequency band (frequency 13.575 Hz, 2.3 cm) is used, and the sampling frequency is 20 Hz.
2.3.2 ICESat-2: ICESat-2 is a satellite in the NASA earth observing system. The satellite Geoscience Laser Altimeter System (GLAS) equipped on the ICESat-2 is the first laser altimeter sensor equipped on satellite for earth observation satellite in space and has high resolution which can monitor the water level of small water better, detecting the changes of 3 cm (Abshire et al., 2005).
ICESat-2 data from level 0 to level 2 has a total 15 product types. This paper uses GLA14 level 2 altimeter data.
2.3.3 CryoSat-2: CryoSat-2 is a high precision radar altimeter satellite launched by ESA in 2010 that can accurately measure the ice thickness and extent changes of the polar sea ice and replace ENVISAT, Jason-1/2, ICESat-2 and other satellite altimetry, continuing to be used for inland water body water dynamic monitoring (Kleinherenbrink et al., 2014). Compared to previously launched observation satellites, CryoSat-2 achieved higher observation precision in complex terrain, such as in Yarlung Zangbo River, the average error of the water level data measured by CryoSat-2 and in-situ data is about 10 cm; in Ganges River, the error of water level observation is about 2 cm (Villadsen et al., 2015).
satellite parameters are shown in Table 2.
Satellite Track height/km Orbit inclination /° Resolution Repeat cycle/day Type Operation years
ERS-1 785 98.5 1.7 km 35 Microwave 1991-1996
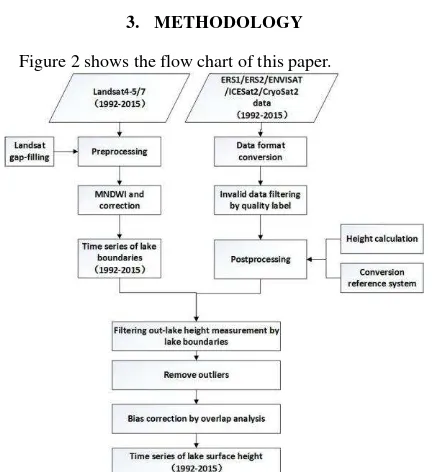
Figure 2 shows the flow chart of this paper.
Figure 2. Framework for estimating the lake level variations by the use of multi-source imagery and multi-mission altimetry
data
3.1 Water Boundary Extraction
Based on the Landsat4-5 TM and Landsat7 ETM+ remote sensing imagery data, Modified Normalized Difference Water Index (MNDWI) (Xu, 2005) is adopted to extract the lake boundaries in the ENVI software. The MNDWI formula is defined as follows:
MNDWI = (Green-MIR)/(Green+MIR) (1)
where MNDWI = Modified Normalized Difference Water Index Green = green band, such as ETM+'s 2 band;
MIR = short wave infrared band, such as ETM+'s 5 Band.
The MNDWI value of the water features is positive, because of higher reflection in the green band than in the short wave infrared band. The MNDWI value of non-water features (soil and vegetation) is negative, because of its lower reflection in short wave infrared band than in green band. Set a threshold (generally 0) to distinguish water features and non-water features and edit artificially in ArcGIS to perfect the boundaries of lakes and reduce the false extraction of water boundaries. In this way, the efficiency of MNDWI method and the accuracy of manual editing are combined. we can read N1 data in MATLAB by the use of the MATLAB function package in BRAT software provided by ESA and analysis data we need according to the different geographic data labels. The GDR data doesn’t provide elevation records of observation footprints but the height of satellite relative to the reference ellipsoid WGS84, distance from the ground to satellite and the corresponding geophysical corrections so we need to calculate corrections to correct Measured_Range and convert to height, the formula is defined as follows:
Height=Altitude-Measured_Range- Corrections (2)
Where Height = lake surface height above reference ellipsoid
Altitude = distance of satellite and reference ellipsoid
Measured_Range = distance of satellite and ground
Corrections = the correction of satellite altimetry data
Compared with the open ocean, rivers and lakes with relatively small area is less influenced by tide and inverse pressure, so we cannot consider the sea state bias correction, the tidal correction (Guo, 2013). Therefore, the dry troposphere correction, wet troposphere correction, ionospheric correction, polar tide correction and earth tide correction have been carried out in this paper. The total correction term of satellite altimetry observation data can be summarized as follows:
Corrections=d+w+i+s+p (3)
Where d = the dry troposphere correction; w= the wet tropospheric correction; i= ionospheric corrections;
s= the earth tide correction; p = polar tide correction.
The data quality labels are as follows: label for good quality of data conformity (quality_flag=0), label for good quality of waveform (wvfrom_fault_id_flags=0), label for good quality of waveform retracking algorithm (ku_ice2_retrk_qua_flags=0). It is worth noting that, in 1994, 2005, 2006, Nam-Co Lake is located in ESA’s instrument calibration range, so ERS-1 data in 1994, ENVISAT data in 2005 and 2006 is missing.
3.2.2 ICESat-2: By the use of the IDL program provided by NASA, the binary data are converted into an identifiable ASCII code form, and the valid observation data is obtained by reading the data quality labels in MATLAB.
elevation of the ICESat-2 observation points is set relative to the TOPEX ellipsoid, the data are further converted from the TOPEX ellipsoid to the WGS_84 ellipsoid and projected onto the UTM projection.
3.2.3 CryoSat-2: We fist convert binary file format to decimal file format by the use of MATLAB released by ESA and filter data according to the data quality labels.
Because of the different satellites with different satellite orbit and revisit period, there will be different values for the altimeter observation system errors. Therefore, in order to get 1992-2015 long time observation of water level, bias correction by overlap analysis is needed. Setting ENVISAT as the reference, the water level observation data of ERS-1, ERS-2, ICESat-2 and CryoSat-2 need to be compensated by constant. Constant compensation is obtained by averaging overlap interpolation between the altimeter data to be compensated and the reference altimeter data.
The following is the detailed steps of constructing long time series of water level: first, calculate the height of water level, then the satellite altimetry data is converted to shapefile file format based on latitude and longitude attribute information and edit the coordinate system information, including the geographic coordinate system for WGS_84 and projection system WGS_84_UTM_zone_46N. Finally, a buffer zone is constructed according to the size of ground footprints of different altimetry satellites to intersect with the lake
boundaries of corresponding time to select height measurement in water boundaries. Finally, we adopt three times median error method to remove outliers, and the water level is further averaged monthly to construct the long time series of Nam-Co Lake from 1992 to 2015.
4. RESULTS
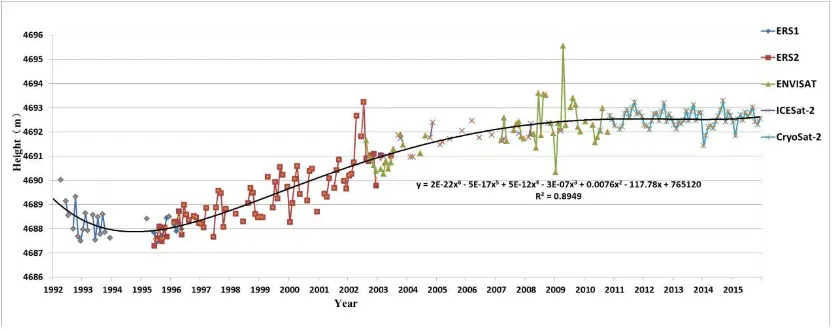
Because of the different satellite parameters, lake levels derived from different altimetry satellites usually have systematic deviation. This paper takes ENVISAT as the reference to calculate the difference between overlapping data of the other satellite altimetry and ENVISAT data and average them to each satellite altimetry values. In addition, ERS-1 and ENVISAT have no overlap, so we use corrected ERS-2 as the reference to correct ERS-1. Table 3 gives the bias correction of the systematic deviation of each satellite. From the comparison of Figure 3 and Figure 4, we can find that the altimetry data of different altimetry satellites are the same at the same time after the systematic bias correction.
Satellite Bias(m) ERS-1 -0.510 ERS-2 -0.733 ICESat-2 1.154 CryoSat-2 61.205
Table 3. Bias correction during the overlap period of altimetry satellite system
Figure 3. Multi-mission radar altimetry results before eliminating the systematic bias
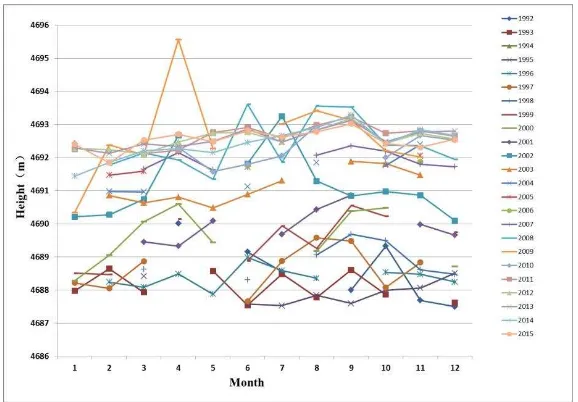
Figure 5. Intra-annual analysis of lake height from 1992 to 2015
Figure 6. Monthly distribution of maximum and minimum water level from 1992 to 2015
5. CONCLUSIONS
Figure 5 shows that water level is relatively stable from January to March. From March, affected by the spring thaw caused by the melting of snow and glacier, the water level begins to rise, achieves its peak in September due to the increasing summer precipitation and gradually decreases after September to the lowest level in winter.
The water level of Nam-Co Lake has significant fluctuation from 1992 to 2015: the slightly decreasing period from 1991 to 1993, the significantly increasing period from 1995 to 2005, and the relatively stable period from 2006 to 2015.
Satellite data products can be used for inland water monitoring, despise the inability of monitoring the change of water level in real time, it has the advantages of all-weather monitoring, high precision and large scale. Combined with the analysis of long-term monitoring of multiple satellite altimetry data can go deep into the study of climate and water level changes.
The change of water level of Nam-Co Lake in 1992-2015 is studied in this paper by the use of ERS-1, ERS-2, ENVISAT, ICESat-2 and CryoSat-2 altimeter data.Meanwhile, Landsat4-5 TM andLandsat7 ETM+ data of the corresponding time are used to construct series of water boundaries and filter altimeter data out of the lake boundary. The integration of multi-source remote sensing observations and the construction of long time
series are the major contribution in this paper. Previous studies usually used only a single remote sensing data source and the series is short time. For example, Song et al. (2016) only used ICESat-2/CryoSat2 altimeter data of Nam-Co Lake to study 2003-2013 annual water level changes. This paper found that the water level of Nam-Co Lake is generally on the rise, consistent with Song’s conclusion. The increasing tendency of the water level is consistent with meteorological changes, such as increasing meltwater caused by the increase of temperature and precipitation growth (Zhu et al., 2010).
ACKNOWLEDGEMENTS
This research was supported by the National Science Foundation of China (91547210, 41771471, 41201425), the National Key Research and Development Program of China (2017YFA0603102), and the Fundamental Research Funds for the Central Universities.
REFERENCES
satellite radar altimetry. Publishing House of Surveying and mapping
Kleinherenbrink, M., Ditmar, P.G., & Lindenbergh, R.C., 2014. Retracking CryoSat data in the SARIn mode and robust lake level extraction. Remote Sensing of Environment, 152, 38-50. Papa, F., Durand, F., Rossow, W.B., Rahman, A., & Bala, S.K., 2010. Satellite altimeter‐derived monthly discharge of the Ganga‐Brahmaputra River and its seasonal to interannual variations from 1993 to 2008. Journal of Geophysical Research
Oceans, 115(C12), 93-102.
Phan, V.H., Lindenbergh, R., & Menenti, M., 2012. ICESat derived elevation changes of Tibetan lakes between 2003 and 2009. International Journal of Applied Earth Observations &
Geoinformation, 17(7), 12-22.
Silva, J.S.D., Calmant, S., Seyler, F., Filho, O.C.R., Cochonneau, G., & Mansur, W.J., 2010. Water levels in the amazon basin derived from the ERS-2 and ENVISAT radar altimetry missions. Remote Sensing of Environment,114(10), 2160-2181.
Song, C., Ye, Q., & Cheng, X., 2015. Shifts in water-level variation of Nam-Co in the central Tibetan Plateau from ICESat and CryoSat-2 altimetry and station observations. Science
Bulletin, 60(14), 1287-1297.
Villadsen, H., Andersen, O.B., Stenseng, L., Nielsen, K., & Knudsen, P., 2015. Cryosat-2 altimetry for river level monitoring — evaluation in the Ganges–Brahmaputra River basin. Remote Sensing of Environment,168(8), 80-89.
Xu, H.Q., 2006. Modification of Normalised Difference Water Index (NDWI) to enhance open water features in remotely sensed imagery. International Journal of Remote
Sensing, 27(14), 3025-3033.
You, Q.L., Li, K., Li, C.L., Li, M.S., & Liu, J., 2007. Characteristics of meteorological elements change in Nam-Co, Qinghai Xizang Plateau, Meteorological, 33 (3), 54-60
Zhai, G.J., Huang, M.T., Ouyang, Y.Z., & Lu, X.P., 2002. Satellite altimetry principle and application. Marine surveying
and mapping, 22 (1), 57-62


