Overconfidence and Excessive Trading Behavior:
An Experimental Study
Irwan Trinugroho(Corresponding author) Faculty of Economics, Sebelas Maret University
Jl. Ir. Sutami 36A, Surakarta 57126, Indonesia E-mail: [email protected]; [email protected]
Roy Sembel
Professor in Finance and lecturer in Department of Management, Faculty of Economics Christian University of Indonesia, University of Indonesia, Pelita Harapan University, Indonesia
E-mail: [email protected]
Received: March 16, 2011 Accepted: March 31, 2011 doi:10.5539/ijbm.v6n7p147
Abstract
The main objective of the research is to examine the excessive trading hypothesis, investors who have higher overconfidence shown by high miscalibration levels will tend to practice aggresive and excessive trading strategy. It is an experimental research which combines both between and within subject design. The participants are undergraduate students who have already taken financial management course but have not yet invest in real capital market. The result of the research shows that high overconfidence investors have higher trading activity than low overconfidence investor. The other result shows that among high overconfidence investors, there is no trading activity differences between pre and post bad news, whereas among low overconfidence investors, the existence of bad news cause trading activity to decrease in the post bad news period. Then, the investment returns of high overconfidence investors is significantly lower than that of the low overconfidence investors. Keywords: Overconfidence, Excessive trading, Trading activity, Bad news, Return
1. Introduction
In the modern financial theory, investors are assumed to be rational in their efforts to identify and process the relevant information for optimal decisions. But in recent years, emerged a variety of empirical evidence showing the existence of investor behavior that deviates from these predictions (Charness and Gneezy, 2003). The results become anomalous phenomena under the paradigm of efficient markets hypothesis (EMH) that was so dominant earlier that financial asset prices reflect all of relevant information. This is due to the existence of cognitive biases that distort the perception and cause the market price of securities to deviate from its fundamental value. Starting from the empirical facts and the anomalies (with respect to the EMH) that occurred in the capital market, behavioral finance approach was developed. Behavioral finance is generally defined as the application of psychology in finance. Behavioral finance is divided into two topics, behavioral finance macro that detect anomalies described in the EMH, and behavioral finance micro that covers psychological biases of individual investors as opposed to rational behavior suggested by classical economic theory, portfolio theory and EMH (Pompian, 2006). Psychological biases of investors are developed in the study of behavioral finance micro. One of cognitive bias in the behavior of finance is overconfidence, the tendency of decision makers to unwittingly give excessive weight to the assessment of knowledge and accuracy of information possessed and ignore the public information available (Lichtenstein and Fischhoff, 1977). Overconfidence is an irrational behavior because it is not based on the principle of normative rationality, which among others refers to the maximization of expected utility.
overconfidence affects trading frequency. Higher overconfidence investors tend to trade more frequently (Graham et al., 2006; Grinblatt and Keloharju, 2009).
While other studies have found that high overconfidence behavior affected not only the frequency but also the volume of trading in the stock market. Glaser and Weber (2003) show that high overconfidence investors defined as above than average in investment skill have a tendency to trade in large volumes. Statman et al. (2003) argue that the level of overconfidence has a positive effect on trading volume. Investors with high overconfidence tend to trade in large volume, then modeled as overconfidence hypothesis. Several studies conclude that overconfidence causes excessive trading, and eventually lead to decline in investor returns. Biais et al. (2002) find that the tendency of overconfidence behavior causes investors to invest in stocks that do not provide benefits (unprofitable investment). Kirchler and Maciejovsky (2002) argue that the overconfidence investors who trade too much will experience reduced outcome (earnings) and often invest in stocks that have negative earnings. In the Initial Public Offering (IPO) research, Sembel (1996) find that trading value has a positive correlation with IPO initial return, and the IPO initial return has a negative correlation with the long-term performance.
The other effect of overconfidence is causing investors to underestimate on the risk or tend to ignore the risk (Pompian, 2006). One of investment risk in stock is the risk associated with stock price declines (capital loss). Information related to the global market, macroeconomic, and issuers’ fundamentals can be used to explain the increase or decrease in stock prices. The existence of bad news can cause the stock price decline because investors’ response to the negative news will result in more sales than purchases. But the investors who have high overconfidence tends to ignore the risk from the information because they have their own beliefs about choice, so that such information should not affect trading activity.
Based on the background, this study tries to examine the effects of overconfidence behavior on trading activity of investors proxied by trading frequency and volume, to test the influence of bad news on trading activities at different levels of overconfidence, and to test the effect of overconfidence on the investors’ investment returns. Our study uses experiment design that combine both between and within subject design, employing software of trading simulation.
2. Literature Review and Hypotheses
Lichtenstein and Fischhoff (1977) define overconfidence as the tendency of decision makers to unwittingly give excessive weight to the assessment of knowledge and accuracy of information possessed and ignore the public information available. Cheng (2007) suggests that overconfidence behavior is the most common characteristics found in humans that reflect one's tendency to overestimate the ability, the chances for success and the probability that someone will gain positive outcomes and the accuracy of the knowledge possessed.
According to Klayman et al. (1999) and Kufepaksi (2007), a person’s overconfidence level can be identified through calibration test of confidence level. Calibration test is a procedure to test and identify the combination of the level of knowledge and level of confidence that shape one's level of overconfidence based on a specific questionnaire designed specifically for these purposes. Overconfidence level is measured by overconfidence score that is the average probability confidence level minus average percentage of the value of correct answer. If the average probability of confidence is lower than average proportion of truth in the assessment, this situation will produce a negative value that reflect the underconfidence behavior. Conversely, if the average confidence probability is higher than average proportion of truth in the assessment, this situation will produce a positive value of overconfidence. Value of overconfidence has three levels: low, medium and high.
In the financial literature, overconfidence is defined as the overestimating valuation in assessing a financial asset (Odean, 1998; Gervais and Odean, 2001; Glaser and Weber, 2003). There are three aspects of overconfidence in finance, namely: (1) Miscalibration, the subjective probability higher than the actual probability, (2) Better-than-average effect, the tendency to think that someone has an above average ability. (3) Illusion-of-control: a belief that people have more ability to predict or more satisfactory results when they have high involvement in it. Pompian (2006) mentions the mistakes that usually occur as a result of overconfidence behavior in relation to investments in the financial markets, (1) Overconfidence can lead investors to make excessive trading as an effect of the belief that they have special knowledge that they do not actually have, (2) Overconfidence causes investors to overestimate the ability to evaluate an investment, (3) Overconfidence can lead investors to underestimate on the risk and tend to ignore the risk. (4) Overconfidence causes a tendency of investors’ investment portfolio to be under-diversified.
Glaser and Weber (2003). The results of these study find that the level of investor overconfidence affects trading frequency and trading volume. According to Benos (1998), investors who have high overconfidence level tends to overestimate the accuracy of their information and feel that they have a better capacity than others in evaluating the information, so it will cause investors to trade more frequently than other investors. Graham et al. (2005), Grinblatt and Keloharju (2009), find that the level of trading frequency of an investor is affected by the level of investor overconfidence. Statman et.al (2003); Glaser and Weber (2003) show that investors with high level of overconfidence have a tendency to trade in large volumes. This greater the desire to do trading will make their transactions over-aggressive, which are indicated by a higher trading frequency and more transaction volume.
H1: High overconfidence investors have higher frequency and larger trading volume than low overconfidence investors
Pompian (2006) explains that high level overconfidence causes investors to underestimate the risk or tend to ignore the risk. One of investment risk in stock is the risk associated with stock price declines (capital loss). Information related to the global market, macroeconomic, and issuers’ fundamentals can be used to explain the increase or decrease in stock prices. The existence of bad news can cause the stock price decline because investors’ response to the negative news will result in more sales than purchases. But the investors who have high overconfidence tends to ignore the risk from the information because they have their own beliefs about choice, so that such information should not affect trading activity of investors. Testing how strong the effect of overconfidence level factors on investors' trading activity is necessary for testing for the presence of information or signaling test. If the level of overconfidence have powerful influence to trading activity, there is no signaling motive effects (Kufepaksi, 2007). The presence of bad news is used to test how strong the influence of overconfidence on the trading activities. Investors who have high overconfidence are not too concerned to the bad news information because they have their own beliefs about choice. Consequently, that information will not affect their trading activity.
H2: In the group of investors with high level of overconfidence, there is no difference in trading activity before and after the bad news.
H3: In the group of investors with low level of overconfidence, the trading activity is lower after the bad news. Gervais and Odean (2001) argue that the increase in trading volume and volatility will cause investors gains to become lower or even negative. Kirchler and Maciejovsky (2002) argue that the overconfidence investors who trade too much will experience reduced outcome (earnings) and often invest in stocks that have negative earnings. Biais et.al (2002) find that behavioral tendency of overconfidence causes investors to invest in stocks that do not provide benefits.
H4: Investors with high level of overconfidence have lower profits compared to investors with low level of overconfidence.
3. Research Method
Participants of this research are undergraduate students who have covered minimal courses on financial management and have never invested in the capital market. The use of students as a subject because they represent the original characteristics that can be manipulated easily in the threatments of experiment. In addition, students have adequate academic provision that would facilitate their understanding of investment (Kufepaksi, 2007). We use students of Department of Management, Sebelas Maret University, Indonesia. This research is an experimental research. We employ a mixed design of between-subject and within-subject design. The between-subject design is utilized to compare the trading frequency, trading volume, and return between the group of investors with high and low overconfidence level. Within subject design is utilized to compare the trading frequency and trading volume before and after bad news in the high and low overconfidence levels. The designs of the experiment in this study are summarized in Table 1, measurement of variables in Table 2 and method of hypothesis testing in Table 3:
4. Result of Hypotheses Testing
Based on Table 4, in the group of high overconfidence, the average frequency of total trading amounted to 10.95 times with the lowest trading frequency of 3 times and the highest is 22 times. Average total trading volume totaled 167,23 lots with the lowest volume of 60 lots and the highest volume of 485 lots. Return is an average of -5.546% with the lowest profit is -21.65% and the highest profit of 5.64%. Whereas in the group of low overconfidence, the average total trading frequency is 7.63 times as much trading with the lowest frequency of 2 times and 16 times the highest. Average total trading volume totaled 118.42 lot with the lowest volume of 35 lots and the highest volume of 270 lots. Gain (return) earned an average of -0.531% with the lowest profit is -10.13% and the highest profit of 6.64%.
frequency (Graham et.al, 2006; Grinblatt and Keloharju, 2009) and cause the volume of transactions becomes larger (Statman et al, 2003; Glaser and Weber, 2003). These results show that in the context of theoretical research in Indonesia, the excessive trading theory is supported.
The results of testing H2 and H3 are given in Table 6 and Table 7. In the group of high overconfidence, the existence of bad news does not affect trading activities. On the contrary, among the investors with low level of overconfidence, the bad news will cause a decline in trading activites. The results of this study indicate that the in group of investors with high overconfidence, there is no signaling motive effects, a tendency to not response the public information to make decision. While in the group of investors with low levels of overconfidence, with characteristics that do not have high confidence in the ability, knowledge and private information they possess, they will tend to use public information to be processed as an input in decision-making (Klayman, 1999). The result of testing H4 is shown in Table 8. The investment return of the groups with high overconfidence is significantly lower than the low overconfidence. This research provides empirical evidence that high overconfidence behavior eventually led to lower investment performance. Gervais and Odean (2001) argue that the increase in trading volume and volatility will lead to investors gains become less and even negative. The results of this study are consistent with the findings Biais et al. (2002), Kirchler and Maciejovsky (2002).
5. Summary and Concluding Remarks
Our experimental study provides empirical evidences supporting the theory of excessive trading which argue that high overconfidence behavior will lead to the tendency of investors to take aggressive and excessive trading strategy. Ultimately, it will lead to poor investment performance. Using the role of “bad news”, we test the strength of overconfidence in influencing investment decision and we find that the existence of bad news does not reduce the effect of overconfidence on trading activity. The overall results are in line with the major previous studies working on this issue. We recommend practical suggestions as implication of the results that investment companies need to provide insight and training to the investors, brokers and investment managers about investment mistakes that can occur because of overconfidence behavior. Overconfidence leads to too frequent transactions and too excessive volume of transactions which in turn result in a lower investment performance. Hopefully, training to improve knowledge and understanding of this overconfidence behavior will reduce errors that result in a decrease of invested wealth of investors.
Nevertheless, we point out several limitation of this research. First, the proxy variables used to measure trading activity are limited to the frequency and volume of trading. Other variables, such as the bid ask spread, are not entered into analysis. In this experiment, the average frequency of trading is relatively low, because many buy orders or sell orders are not executed. Participants rarely place a buy order at the best offer or sell order at the best bid. They would rather place a limit order (make an order in the queue). Second, the overall duration of this experimental study is relatively long (4 hours or 240 minutes, divided into two sessions). Long-duration experiments may cause the maturation effect, changes in participants' behavior that may be caused by the influence of other factors that occurred during the experiment but not due to deliberate in the experimental treatment. References
Barber, B.M., & Odean, T. (2000). Trading is Hazardous to Your Wealth: the Common Stock Performance of Individual Investors. Journal of Finance, 55(2), 773—806. doi:10.1111/0022-1082.00226, http://dx.doi.org/10.1111/0022-1082.00226
Barber, B.M., & Odean, T. (2001). Boys Will Be Boys: Gender, Overconfidence, and Common stock Investment.
Quarterly Journal of Economics, 116(1), 261-292. doi:10.1162/003355301556400,
http://dx.doi.org/10.1162/003355301556400
Benos, Alexandros V. (1998). Aggressiveness and Survival of Overconfident Traders. Journal of Financial
Markets 1, 353–383. doi:10.1016/S1386-4181(97)00010-4, http://dx.doi.org/10.1016/S1386-4181(97)00010-4
Biais, B., Hilton, D., Mazurier, K., & Pouget, S. (2002). Psychological Traits and Trading Strategies. C.E.P.R. Discussion Papers 3195.
Bloomfield, R., Robert, L., & Nelson, M. (1999). Confidence and Welfare of Less Informed Investors.
Accounting, Organizations and Society, 24, 623-47. doi:10.1016/S0361-3682(99)00025-2,
http://dx.doi.org/10.1016/S0361-3682(99)00025-2
Charness, G., & Gneezy, U. (2003). Portfolio Choice and Risk Attitudes: An Experiment. Working Paper. [Online] Available: http://papers.ssrn.com/sol3/papers.cfm?abstract_id=397300
Cheng, P.Y.K. (2007). The Trader Interaction Effect on the Impact of Overconfidence on Trading Performance: An Empirical Study. Journal of Behavioral Finance, 8(2), 59-69.
Gervais, S., & Odean, T. (2001). Learning to be Overconfident. Review of Financial Studies, 14(1), 1-27. doi:10.1093/rfs/14.1.1, http://dx.doi.org/10.1093/rfs/14.1.1
Glaser, M., & Weber, M. (2003). Overconfidence and Trading volume. Working Paper. [Online] Available: http://papers.ssrn.com/sol3/papers.cfm?abstract_id=471925&rec=1&srcabs=957504
Graham, J., Harvey, C., & Huang, H. (2006). Investor Competence, Trading Frequency, and Home Bias.
Working Paper. [Online] Available: http://papers.ssrn.com/sol3/papers.cfm?abstract_id=620801
Grinblatt, M., & Keloharju, M. (2009). Sensation Seeking, Overconfidence, and Trading Activity. Journal of
Finance 64(2), 549-578. doi:10.1111/j.1540-6261.2009.01443.x,
http://dx.doi.org/10.1111/j.1540-6261.2009.01443.x
Kirchler, E., & Maciejovsky, B. (2002). Simultaneous Over- and Underconfidence: Evidence from Experimental Asset Markets. Journal of Risk and Uncertainty, 25(1), 65–85. doi:10.1023/A:1016319430881, http://dx.doi.org/10.1023/A:1016319430881
Klayman, J., Soll, J. B., González-Vallejo, C., & Barlas, S. (1999). Overconfidence: It Depends on How, What, and Whom You Ask. Organizational Behavior and Human Decision Process, 79(3), 216-47. doi:10.1006/obhd.1999.2847, http://dx.doi.org/10.1006/obhd.1999.2847
Kufepaksi, M. (2007). The Contribution of Self-Deceptive Behavior on Price Discovery: An Experimental Approach. Proceedings of the 13th Asia Pacific Management Conference, Melbourne, Australia, 56-66.
Lichtenstein, S., & Fischhoff, B. (1977). Do Those Who Know More Also Know More About How Much They Know. Organizational Behavior and Human Performance, 20(2), 159-83. doi:10.1016/0030-5073(77)90001-0, http://dx.doi.org/10.1016/0030-5073(77)90001-0
Odean, T. (1998). Volume, Volatility, Price and Profits When All Traders Are Above Average. Journal of
Finance, 53(6), 1887-1934. doi:10.1111/0022-1082.00078, http://dx.doi.org/10.1111/0022-1082.00078
Odean, T. (1999). Do Investors Trade Too Much. The American Economics Review, 89(5), 1279-98. doi:10.1257/aer.89.5.1279, http://dx.doi.org/10.1257/aer.89.5.1279
Pompian, M. M. (2006). Behavioral Finance and Wealth Management. John Wiley & Sons Inc. New Jersey. Sembel, R. (1996). IPO Anomalies, Truncated Excess Supply, and Heterogeneous Information. Ph.D Dissertation, University of Pittsburgh, Pittsburgh.
Statman, M., Thorley, S., & Vorkink, K. (2003). Investor Overconfidence and Trading Volume. Working Paper. [Online] Available: http://papers.ssrn.com/sol3/papers.cfm?abstract_id=168472
Table 1. Design of Experiment
Step Description 1 Calibration test to determine the level of subjects confidence
2 Based on calibration tests, determine the number of participants 60 people (30 men and 30 women) who have a positive overconfidence score.
3 Participants are grouped into three groups: high, moderate, and low overconfidence level. Each group consist of 10 men and 10 women.
4 Prior to the simulation, participants are given explanations and guidance on the simulation mechanism. 5 Trading simulation experiment using software. Each participant in this study were given a virtual
start-up capital to invest Rp. 100.000.000, -. Experiments conducted over 4 (four) hours, divided into 2 sessions.
6 At the end of the experiment, participants who received the highest gain of 1-5 will receive a cash reward. While the other participants also earn cash for their participation in the simulation followed a smaller number than the winner of the simulation
Table 2. Measurement of Variables
Variables Measurement Overconfidence measured by using a test based on the calibration model Klayman et.al (1999) and
Kufepaksi (2007).
Bad news announcement of loss and the recommendation to not buy (Stikel et.al, 1995; Kufepaksi, 2007)
Trading frequency measured by the number of transactions conducted by the participants Trading volume measured by the number of trading volume (lot) made by the participants
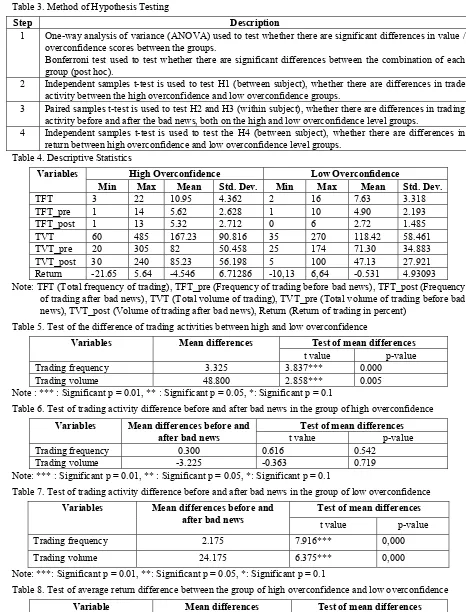
Table 3. Method of Hypothesis Testing
Step Description 1 One-way analysis of variance (ANOVA) used to test whether there are significant differences in value /
overconfidence scores between the groups.
Bonferroni test used to test whether there are significant differences between the combination of each group (post hoc).
2 Independent samples t-test is used to test H1 (between subject), whether there are differences in trade activity between the high overconfidence and low overconfidence groups.
3 Paired samples t-test is used to test H2 and H3 (within subject), whether there are differences in trading activity before and after the bad news, both on the high and low overconfidence level groups.
4 Independent samples t-test is used to test the H4 (between subject), whether there are differences in return between high overconfidence and low overconfidence level groups.
Table 4. Descriptive Statistics
Variables High Overconfidence Low Overconfidence
Min Max Mean Std. Dev. Min Max Mean Std. Dev.
TFT 3 22 10.95 4.362 2 16 7.63 3.318
TFT_pre 1 14 5.62 2.628 1 10 4.90 2.193
TFT_post 1 13 5.32 2.712 0 6 2.72 1.485
TVT 60 485 167.23 90.816 35 270 118.42 58.461
TVT_pre 20 305 82 50.458 25 174 71.30 34.883
TVT_post 30 240 85.23 56.198 5 100 47.13 27.921 Return -21.65 5.64 -4.546 6.71286 -10,13 6,64 -0.531 4.93093 Note: TFT (Total frequency of trading), TFT_pre (Frequency of trading before bad news), TFT_post (Frequency
of trading after bad news), TVT (Total volume of trading), TVT_pre (Total volume of trading before bad news), TVT_post (Volume of trading after bad news), Return (Return of trading in percent)
Table 5. Test of the difference of trading activities between high and low overconfidence
Variables Mean differences Test of mean differences
t value p-value
Trading frequency 3.325 3.837*** 0.000
Trading volume 48.800 2.858*** 0.005
Note : *** : Significant p = 0.01, ** : Significant p = 0.05, *: Significant p = 0.1
Table 6. Test of trading activity difference before and after bad news in the group of high overconfidence
Variables Mean differences before and after bad news
Test of mean differences t value p-value
Trading frequency 0.300 0.616 0.542
Trading volume -3.225 -0.363 0.719
Note: *** : Significant p = 0.01, ** : Significant p = 0.05, *: Significant p = 0.1
Table 7. Test of trading activity difference before and after bad news in the group of low overconfidence Variables Mean differences before and
after bad news
Test of mean differences
t value p-value
Trading frequency 2.175 7.916*** 0,000
Trading volume 24.175 6.375*** 0,000
Note: ***: Significant p = 0.01, **: Significant p = 0.05, *: Significant p = 0.1
Table 8. Test of average return difference between the group of high overconfidence and low overconfidence
Variable Mean differences Test of mean differences
t value p-value
Return -4.015 -2.156** 0.038