1) Staf Pengajar Departemen Teknik Sipil, Fakultas Teknik Sipil dan Perencanaan, Institut Teknologi Bandung.
Catatan : Usulan makalah dikirimkan pada 31 Oktober 2003 dan dinilai oleh peer reviewer pada tanggal 17 Nopember 2003 – 19 Januari 2004. Revisi penulisan dilakukan antara tanggal 20 Nopember 2003 hingga 28 Januari 2004.
Abstract
This investigation deals with the behavior of cohesive bonding at particle contacts in soil. Direct measurement of cohesive strength at sliding contacts between particles of soil has not been accomplished. An indirect method is used in this study to estimate average contact cohesion from measurement of total strength of soil specimens.
Two types of materials were tested; Ottawa sand and crushed quartz, with two different relative densities, 25 and 75 percents; each material was tested with four different cement contents, 0, 2, 4, and 6 percents of cement by weight. Adding cement was to create controlled cohesion to the contacts between particles.
The results of 118 Consolidated Drained Triaxial compression tests on sand-cement specimens were analyzed, and the model by Hardin (1985) was used to isolate cohesive and frictional bonding in cohesive materials. This model considers two basic mechanism of strength of soils, by considering bonding at particle contacts and kine-matics of particle movement within an element of deforming soil.
The result shows that the dimensionless contact cohesion is linearly related to cement content for sand with rela-tive density 25 percent, and is nonlinear for sand with relarela-tive density 75 percent. Dimensionless contact cohe-sion decreases with increasing relative density for cement content 2 and 4 percents, but it increases with increasing relative density for 6 percent cement content. Dimensionless contact cohesion is larger in rounded material compared with in angular material.
Keywords: cohesive bonding, particle contacts, sliding contacts, contact cohesion.
Abstrak
Penelitian ini adalah mengenai perilaku dari ikatan kohesif pada kontak antar butir tanah. Pengukuran langsung kohesi pada bidang geser kontak antara butir-butir tanah, belum pernah dilakukan. Suatu cara tidak langsung dipakai dalam studi ini, untuk memprakirakan kohesi kontak (pada bidang geser antara 2 butir) rata-rata, dari pengukuran tegangan-tegangan total pada benda uji tanah.
Dua jenis material pasir diuji; yaitu pasir Ottawa dan crushed quatz (quartz tumbuk), dengan 2 nilai relative density yaitu 25% dan 75%; tiap material diuji dengan 4 kadar semen yang berbeda yaitu 0%, 2%, 4% dan 6% berat semen. Penambahan semen pada pasir tersebut, adalah untuk menciptakan kohesi yang dapat diatur, pada bidang kontak.
Hasil uji Consolidated Drained Tiaxial compression pada 118 benda uji pasir bersemen diatas, dianalisis, dan sebuah model dari Hardin (1985), dipakai untuk mengisolasi ikatan kohesi dan ikatan geser pada material kohesif. Model tersebut memperhatikan dua mekanisme dasar dari kekuatan tanah, dengan memperhatikan ikatan pada kontak antara butir dan kinematik dari pergerakan partikel dalam sebuah elemen dari tanah yang berdeformasi.
Hasilnya memperlihatkan bahwa kohesi kontak tak berdimensi berhubungan linier terhadap kadar semen, untuk pasir dengan relative density 25%, dan tidak linier untuk pasir dengan relative density 75%. Kohesi kontak tak berdimensi berkurang dengan bertambahnya relative density, untuk kadar semen 2 dan 4%, tetapi bertambah besar dengan naiknya relative density, untuk kadar semen 6%. Kontak kohesi tak berdimensi lebih besar pada pasir yang rounded dibanding dengan pada pasir yang angular.
Kata-kata kunci: ikatan kohesif, kontak antar butir-butir tanah, bidang geser kontak antar butir-butir tanah, kohesi kontak.
Bonding at Particle Contacts
Suyud R. Karyasuparta
1. Introduction
Cohesive bonding is said to exist at a contact between two soil particles when the contact has tensile strength, or when the contact can resist a shearing force in the absence of a normal contact force. Direct measurement of the cohesive strength at contacts in a soil sample has not been accom-plished. Thus, indirect methods are used to estimate average contact cohesion from measurement of the total strength of soil specimens. This requires a model for soil strength that accounts for existing strength components (friction, cohesion, dilation, etc.). The model is used to isolate the cohesion com-ponent, and to compute the magnitude of average contact cohesion cµ
,
or some parameter related to c µ,
from measured total strength.This investigation deals with the behavior of cohe-sive bonding at particle contacts in soil. The results of 118 drained triaxial compression tests on sand-cement specimens were analyzed, and the model by Hardin (1985) was used to isolate cohesive and fric-tional bonding in cohesive materials. This model considers the two basic mechanism of strength of soils, by considering bonding at particle contacts and the kinematics of particle movement within an element of deforming soil.
The study required many samples with varying amount of cohesion. The amounts of cohesive bond-ing in natural cohesive soil cannot be controlled. A convenient means of controlling cohesion is to test artificially cemented soils. The choice was made to test sand specimens with varying amounts of Port-land cement. Sand is cohesion less material but cohesion is produced by the presence of cement in the sand.
Cohesion in sand-cement depends on the properties of sand particles and on the properties of the cement. Thus the cohesion of sand-cement specimens vary with particle mineralogy, grain size distribution, shape and hardness of particles, grain arrangements and density, cement content, curing time, etc. The results of this study indicate that the mineral friction angle φµ is about the same for cemented and uncemented sands.
Two types of materials were tested; Ottawa sand and crushed quartz, with two different relative densities, Dr = 25 and 75 percents; each material was tested
with four different Portland cement contents, 0, 2, 4, and 6 percents of cement by weight. Consolidated Drained triaxial compression tests were carried out
on the specimens in order to define the strength in terms of effective stress. Drained tests were also used in order to determine the volumetric strain behavior which is needed for application of Hardin’s model.
The cohesion parameters of the Hardin and Schmert-mann models have been compared. The magnitude of contact cohesion indicated by the two theories shows a high degree correlation.
2. Cohesion
2.1Definition of true cohesion
The term cohesion as used in soil mechanics can be confusing. The cohesion that is measured by extending the Mohr-Coulomb failure envelope to normal stress
σ’= 0, is not true cohesion because it includes the effects of dilation.
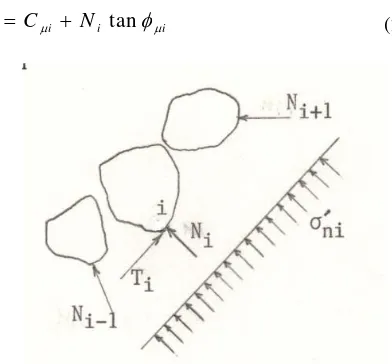
True cohesion is shear resistance which is mobilized between two adjacent particles which stick to each other without the existence of normal pressure; it is the force that arises within the particles themselves (Lambe, T. W. 1960). The existence of tensile or shear strength without the necessity of the existence of effective stress in the soil skeleton or on the failure plane can be taken as evidence of a true cohesion (Mitchell, J. K. 1976). It is the true cohesion that is the object of this study.
True cohesion is defined by considering the shear and normal forces, Ti and Ni, at a single sliding contact as
shown in Figure 2.1.
The contact shearing resistance Ti will depend on the
normal contact force Ni and the relationship may be
expressed by the equation
Figure 2.1 The shear and normal forces, Ti and Ni at a single sliding contact
i i i
i C N
where Cµ i is the contact cohesion force and φµ i is the
angle of mineral friction at contact i.
It should be noted that the relationship between Ti and
Ni may be nonlinear in which case φµ i is a function of
Ni.
The orientation of contact i is defined by the direction cosines li , mi , and ni between Ni and the directions of
the major, intermediate, and minor principal stresses
σ1′ , σ2′ and σ3′ respectively, where σ1′ , σ2′ , and σ3′
are stresses in an element containing many particles. The stress σ
′
ni in Figure 2.1 normal to the contactplane at contact i is given by
The normal contact force Ni is produced by the normal
contact stress σ
′
ni acting on an area Ai associated withsliding contact i where
Ai =
The area Ai is also associated with the contact
cohe-sion force Cµi such that the unit contacts cohesion
c
µiis given by
c
µi=where cµi is the true cohesion at sliding contact i. The
average of all cµi for all sliding contacts in an element
of soil is the true cohesion cµ for the soil.
2.2 Definition of bonding obliquity angle
The bonding obliquity angle φ0i at sliding contact i in
Figure 2.1 is defined by
substituted into Equation 2.6 resulting in
tan φ0i = tan φµi +
contacts in an element of soil, it is assumed that
tan φο= tan φµ +
where φοis the bonding obliquity angle for an element of soil. [Note: using (average cµi
/
σ′ni ) = (average cµi/average σ′ni) is approximate but is the only practical
way to proceed without assuming distributions for cµi
and orientations of sliding contacts].
Finally, multiplying numerator and denominator of cµ
/σ′n in Equation 2.8 by atmospheric pressure pa and
substituting
Cb =
where Cb = average dimensionless contact cohesion,
gives
tan φο = tan φµ + Cb
The stress σ′n in Equations 2.8 and 2.10 is the mean
value of σ′ni , i.e. the average effective stress normal to
sliding contacts in an element of soil. Based on an analysis of the orientations of sliding contacts in an
element of soil, Hardin (1985) recommends using the following :
2.3 Schmertmann’s cohesion parameter
In 1960, Schmertmann and Osterberg developed the IDS curvehopping technique to separate strength into two components; one component Iε that is independent
of effective stress and the second component Dε that
depends on effective stress.
Furthermore, he isolated these components at various values of strain ε (indicated by the subscript ε on τ, I and D). By analysis of the Iε values, Schmertmann
obtains a parameter Ib which analysis of
Schmert-mann’s results shows that Ib is approximately equal to
cµ
(
Ib ≈ cµfor sand-cement with relative density Dr =25 percent, and Ib = 0.75cµ for sand-cement with Dr =
75 percent).
3. Strength Model
terms of the bonding obliquity angle φο and the
maxi-mum rate of dilation dmax (defined below). Using this
model the bonding obliquity angle for a soil specimen can be determined from the results of a drained triaxial compression test with volume change measurements. Values of φο determined in this way can be used with
Equations 2.10 and 2.11 to find values of Cb = cµ / pa
and φµ
For triaxial compression, the strength model is given by:
where Rmax is the maximum principal stress ratio at the
peak = (σ1′ / σ3′)max ; Kcv is the critical state energy
transmission ratio which is equal to the principal stress ratio at the critical state,
Kcv = Rcv = (σ1′ / σ3′)cv and Kmin is the minimum
possi-ble value of energy transmission ratio; and dmax is the
maximum rate of dilation.
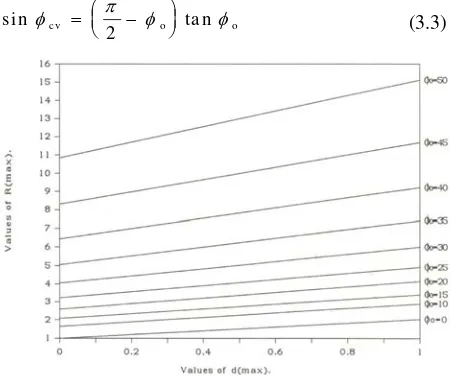
A plot of the theoretical relationships between Rmax
and Dmax for various values of φο is shown in Figure
3.1 Knowing values of Rmax and Dmax, values of φο can
be determined graphically from Figure 3.1.
The critical state energy transmission ratio Kcv is
related to the critical state angle of shearing resistance
φcvby the equation
and the critical state angle of shearing resistance φcv is
related approximately to bonding obliquity angle φο as
(
)
Figure 3.1 Chart for determining
φ
οfrom triaxial compression testss inφcv = π −φo ta nφo ⎛
⎝⎜ 2 ⎞⎠⎟ (3.3)
obtained from the result of an analysis of distributions of orientations of sliding contacts.
The minimum value of energy transmission ratio Kmin
is related to the bonding obliquity angle as
The maximum rate of dilation dmax is the maximum
value of the rate of dilation -dv/dε1, where dv is the
volumetric strain increment and dε1 is the strain
incre-ment in the direction of major principal stress σ1
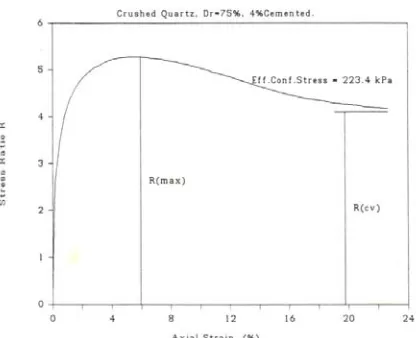
′.Experiments show that Rmax and Dmax occur
approxi-mately simultaneously (see Figures. 3.2 and 3.3).
3. 1 To find φο numerically from triaxial compression tests
The measured values of Rmax and dmax can be used to
determine corresponding values of φο, and thus tan φο, from the algorithm described in the previous section, and σn′ can be determined from Equation 2.11 using φ
ο, σ3′ and σ1′ = Rmax σ3′. The values of tan φο can then be plotted versus pa / σn′ to determine tan φµ and Cb
from the intercept and slope respectively of a straight line approximating the data.
4. Consolidated
Drained
Triaxial
Compression Tests
Theory has been developed in chapter 3 to determine the bonding obliquity angle φο and dimensionless
contact cohesion Cb from the results of triaxial
compression tests with volume change measurement.
In order to study dimensionless true cohesion Cb = cµ / pa in granular materials, 118 consolidated
drained triaxial compression tests on specimens of cemented and uncemented sands were conducted. This chapter describes materials used for these tests, test results, and analysis.
Many variables relating to cement treated soils were held constant for this testing program. Quality of cement, environment during hydration, age of mixture at time of testing (curing time), mixing and compact-ing method, and the triaxial sample preparation proce-dure were the same for all samples.
4.1 Materials and test results
Ottawa sand and crushed quartz are the two materials tested. They were chosen to measure the effects of particle shape while holding the mineral type (quartz) constant.
Ottawa sand particles are very rounded, while crushed quartz particles are angular. Grain size basic properties are shown in Table 4.1.
Samples with two different densities were tested corre-sponding to relative density Dr = 25 percent and 75
percent for each material.
Cement content has a large effect on the strength of cemented soil, and it is assumed to have a large effect on dimensionless contact cohesion Cb. Because of the
importance of this effect, four different cement con-tents were applied to the samples, namely 0, 2, 4, and 6 percents by dry weight.
Results of all consolidated drained triaxial compres-sion tests are presented in this section. The minor prin-cipal effective stress σ3′, maximum stress ratio Rmax =
(σ1′ / σ3′)max, and maximum rate of dilation dmax are
obtained from stress strain curves for each test. Some sample curves are presented in Figures 4.1 to 4.4 for Ottawa sand, and crushed quartz.
Figure 3.2 Typical stress-strain curve from a triaxial compression test
Figure 3.3 Typical volumetric strain vs. axial strain curve from a drained triaxial compression test
Table 4.1 Basic properties of ottawa sand and crushed quartz
Soil properties and symbols Ottawa sand Crushed quartz
particle shape mineralogy plasticity specific gravity, Gs
min. void ratio emin
max. void ratio emax
diameter D50
coeff. of uniformity Cu
coeff. of gradation Cc
Rounded Quartz NP 2.67 0.507 0.713 0.269 3.086 0.974
Figure 4.1 a. Deviatoric stress vs. axial strain; ottawa sand, dr = 25%, uncemented
Figure 4.1 b. Volumetric strain vs. axial strain; ottawa sand, dr = 25%, uncemented
Figure 4.2 a. Deviatoric stress vs. axial strain; ottawa sand, dr = 25%, 6% cemented
Figure 4.2 b. Volumetric strain vs. axial strain; ottawa sand, dr = 25%, 6% cemented
Figure 4.3 a. Deviatoric stress vs. axial strain; crushed quartz, dr = 25%, uncemented
Figure 4.4 a. Deviatoric stress vs. axial strain; crushed quartz, dr = 75%, 6% cemented
Figure 4.4 b. Volumetric strain vs. axial strain; crushed quartz, dr = 75%, 6% cemented
The maximum deviatoric stress (σ1′ / σ3′)max, occurs
approximately simultaneously with the maximum rate of dilation dmax on almost all samples (see chapter 3).
4.2 Dimensionless contact cohesion Cb
As stated in the last section of chapter 3, “Determination of Dimensionless Contact Cohesion,” a linear relationship between the tan φο and pa / σn′ is
assumed in order to define a constant value of dimen-sionless contact cohesion Cb. A line approximating
each data set in Figures 4.5 to 4.8 is found by linear regression where the tan φο intercept is constrained to the value for uncemented sand. The value of tan φο for uncemented sand is equal to tan φµ.
According to Equation 2.9, the slope of the line is equal to the dimensionless contact cohesion Cb, and
the intercept is tan φµ. The values of Cb and tan φµ are
shown in Tables 4.2 along with the tan φο values de-fined by regression lines and the values of correlation coefficient R as a measure of how well a curve fits the data points. A curve fit with a value of correlation coefficient higher than 0.900 is a good fit, (Orvis, W. J.). A summary of Cb and tan φµ values is given in
Table 4.3 along with the corresponding R.
The determination of Cb as described above is based
on the assumption that tan φµ is independent of confinement over a large stress range and thus is also independent of σn′. All four sets of results for
unce-mented sands, Ottawa sand and crushed quartz at relative densities 25 and 75 percents indicate that tan φ
µ is independent of σn′, i.e. tan φο vs. pa / σn′ is
ap-proximately a horizontal straight line for each case with correlation coefficients above 0.900. Each hori-zontal line is assumed to define the constants tan φµ.
Other tables for the values of φο, sin φcvt,Kmin,, Kcvt,
tan φο, pa / σn′, and results from regression tan φο, tan φ
µ, and Cb, for Ottawa sand, Dr = 75%, and for crushed
quartz are not shown here, but the plotted data are shown in the following tables.
Figure 4.5 tan φο versus pa / σn′, Dr = 25%; 0,2,4,6% cemented Ottawa Sand
Table 4.2 and results from regression: and Cb,
for Ottawa sand, Dr = 25%.
φ
o, sin
φ
cvt,
K
min,
K
cvt, tan
φ
o,
p
a/
σ
'ntan
φ
o, tan
φ
µ,
Spl. σ3′ φο Sin φχϖτ Kmin Kcvt tan φο Pa / σn′ tan φο # (kPa) from regrs.
Cement content = 0%
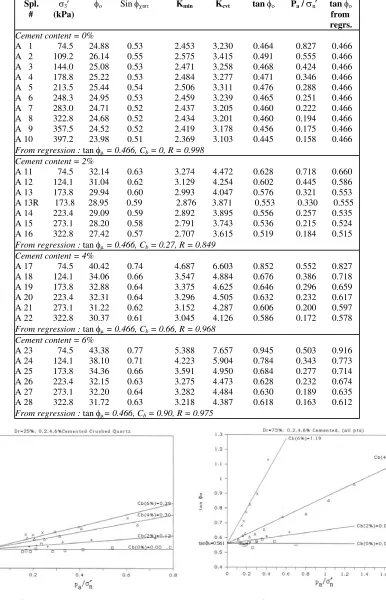
A 1 74.5 24.88 0.53 2.453 3.230 0.464 0.827 0.466 A 2 109.2 26.14 0.55 2.575 3.415 0.491 0.555 0.466 A 3 144.0 25.08 0.53 2.471 3.258 0.468 0.424 0.466 A 4 178.8 25.22 0.53 2.484 3.277 0.471 0.346 0.466 A 5 213.5 25.44 0.54 2.506 3.311 0.476 0.288 0.466 A 6 248.3 24.95 0.53 2.459 3.239 0.465 0.251 0.466 A 7 283.0 24.71 0.52 2.437 3.205 0.460 0.222 0.466 A 8 322.8 24.68 0.52 2.434 3.201 0.460 0.194 0.466 A 9 357.5 24.52 0.52 2.419 3.178 0.456 0.175 0.466 A 10 397.2 23.98 0.51 2.369 3.103 0.445 0.158 0.466
From regression : tan φµ= 0.466, Cb = 0, R = 0.998
Cement content = 2%
A 11 74.5 32.14 0.63 3.274 4.472 0.628 0.718 0.660 A 12 124.1 31.04 0.62 3.129 4.254 0.602 0.445 0.586 A 13 173.8 29.94 0.60 2.993 4.047 0.576 0.321 0.553 A 13R 173.8 28.95 0.59 2.876 3.871 0.553 0.330 0.555 A 14 223.4 29.09 0.59 2.892 3.895 0.556 0.257 0.535 A 15 273.1 28.20 0.58 2.791 3.743 0.536 0.215 0.524 A 16 322.8 27.42 0.57 2.707 3.615 0.519 0.184 0.515
From regression : tan φµ= 0.466, Cb = 0.27, R = 0.849
Cement content = 4%
A 17 74.5 40.42 0.74 4.687 6.603 0.852 0.552 0.827 A 18 124.1 34.06 0.66 3.547 4.884 0.676 0.386 0.718 A 19 173.8 32.88 0.64 3.375 4.625 0.646 0.296 0.659 A 20 223.4 32.31 0.64 3.296 4.505 0.632 0.232 0.617 A 21 273.1 31.22 0.62 3.152 4.287 0.606 0.200 0.597 A 22 322.8 30.37 0.61 3.045 4.126 0.586 0.172 0.578
From regression : tan φµ= 0.466, Cb = 0.66, R = 0.968
Cement content = 6%
A 23 74.5 43.38 0.77 5.388 7.657 0.945 0.503 0.916 A 24 124.1 38.10 0.71 4.223 5.904 0.784 0.343 0.773 A 25 173.8 34.36 0.66 3.591 4.950 0.684 0.277 0.714 A 26 223.4 32.15 0.63 3.275 4.473 0.628 0.232 0.674 A 27 273.1 32.20 0.64 3.282 4.484 0.630 0.189 0.635 A 28 322.8 31.72 0.63 3.218 4.387 0.618 0.163 0.612
From regression : tan φµ= 0.466, Cb = 0.90, R = 0.975
Figure 4.7 tan φο versus pa / σn′, Dr = 25%; 0,2,4,6% cemented Crushed Quartz
Table 4.3. Dimensionless contact cohesion Cb, tangent of contact friction angle tan φµ
and the corresponding correlation
Data for Ottawa sand with relative density equal to 25 percent in Table 4.2 are plotted in Figure 4.5. Uncemented sand gives the value tan φµ = 0.466 (φµ = 25°) which is a reasonable value. Using tan φµ = 0.46 6, straight lines representing data points for 2, 4, and 6 percents cement, respectively, lead to values of Cb =
0.27, 0.66, and 0.90, with correlation coefficients R = 0.849, 0.967, and 0.975, (see Table 4.3). The value of Cb increases with increasing cement content.
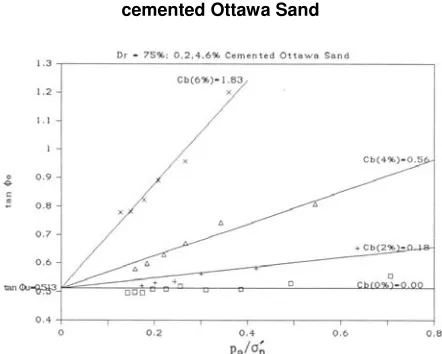
Data for Ottawa sand with relative density equal to 75 percent are plotted in Figure 4.6. Uncemented sand gives tan φµ = 0.513 (φµ = 272°) which is reasonable
for a higher density Ottawa sand, since φµ should in-crease with decreasing void ratio (Hardin 1985). Using tan φµ = 0.513, straight lines representing data points
for 2, 4, and 6 percents cement, respectively, lead to values of Cb = 0.18, 0.56, and 1.83, with correlation
coefficients R = 0.913, 0.967, and 0.983. The value of Cb increases with increasing cement content, and the
increase is larger, compared with of Cb for relative
density 25 percent.
Data for crushed quartz with relative density equal to 25 percent are plotted in Figure 4.7. Uncemented crushed quartz gives tan φµ = 0.528 (φµ = 27.8). Compared with Ottawa sand, crushed quartz particles are angular in shape, and the particle size is larger.
Using tan φµ = 0.528, straight lines representing data
points for 2, 4, and 6 percents cement, respectively lead to values of Cb = 0.12, 0.30, and 0.39 with
corre-lation coefficients R = 0.913, 0.895, and 0.864 respec-tively.
The φµ = for crushed quartz can be compared to the value for Ottawa sand by using Equation 4.5 (Hardin 1985). The Ottawa sand with Dr = 25 percent has
ini-be used to estimate φµ for crushed quartz with relative
density Dr = 25 percent.
The following values are substituted, ei = 0.903; D50 = 0.42 mm; ns =
25 (angular); σ3′ = 74.5 kPa; and rσ = 0.75. The
com-puted value of tan φµ is 0.659 (φµ = 33.4°). This is
con-siderably higher than indicated by the result in Figure 4.7. However, the effect of particle shape on values of
φµ computed from Equation 4.5 is large and the value ns = 20 (sub-angular) gives = φµ = 27.8° as indicated
by Figure 4.7.
Data for crushed quartz with relative density equal to 75 percent are plotted in Figure 4.8. Uncemented sand gives the value tan φµ =0.651 (φµ = 29.3°). This tan φµ
is larger than for crushed quartz with 25 percent rela-tive density. Using the same procedure as crushed quartz with Dr = 25 percent in applying Equation 4.5
for crushed quartz with Dr = 75 percent (ei = 0.903),
tan φµ = 0.722 is found for ns = 25 and tan φµ = 0.578
for ns = 20, which is very close to 0.561 found from
regression in Figure 4.8.
Using tan φµ = 0.561, straight lines representing data
points for 2, 4, and 6 percents cement, respectively, lead to values of Cb = 0.09, 0.29, and 1.06 with
corre-lation coefficients R = 0.814, 0.988, and 0.957.
Using all available data (Figure 4.8), values of Cb are
0.09, 0.32, and 1.19 with correlation coefficients R = 0.814, 0.988, and 0.953 respectively.
The discarded data point, BB-33, is for tests with a very low effective confining pressure of 15 kPa. The increase of Cb with increasing cementation is larger
than for crushed quartz with relative density equal to 25 percent.
5. Conclusions
Cohesive bonding at the sliding contacts in an element of soil has been studied using the model for soil strength proposed by Hardin (1985). That model con-tains two basic parameters, the bonding obliquity angle φo that represents both frictional and cohesive
bonding at sliding contacts and the maximum rate of dilation dmax that represents kinematics of particle
movement within an element of deforming soil.
According to the model tan φo is linearly related to the
reciprocal of the effective stress normal to sliding con-tacts, σn′. The data presented in Figure 4.5 indicate an
approximately linear relationship. Furthermore, eleven tests over an extended stress range σ3′ = 15 to 480 kPa
(Figure 4.8, 4% cement) were conducted to prove
more conclusively the linearity of the relationship.
Also according to the model the slope of the linear relationship between tan φo and pa / σn′ defines the
dimensionless contact cohesion Cb.
For Ottawa sand and crushed quartz with relative den-sity 25 percent, Cb increases approximately linearly
with cement content with very high correlation coeffi-cients (0.996 and 0.994 respectively). Cb = 0.152 c for
Ottawa sand with Dr = 25%, and Cb = 0.067 c for
crushed quartz with Dr = 25%, where c is cement
con-tent.
For Ottawa sand and crushed quartz with relative den-sity 75 percent, the relationships between Cb and
ce-ment content are nonlinear and are approximated by the relationship Cb = αc + βcη where α, β and η are
material constants. Cb = 0.07c + 0.001c4.05 for Ottawa
sand with Dr = 75% and Cb = 0.03c + 0.001c3.781 for
crushed quartz with Dr = 75%.
The value of Cb decreases with increasing relative
density for 2 and 4 percents cement for both Ottawa sand and crushed quartz, but it rapidly increases with increasing density for 6 percent cement. A hypothesis to explain this is as follows. Both number of contacts and amount of cement increase with increasing density. However, the reduction of Cb with increasing
density indicates that the increase in cement is not sufficient to provide the same bonding at the increased number of contacts for 2 and 4 percents cement.
The value of Cb for Ottawa sand (rounded material) is
larger than that for crushed quartz (angular material) for all cement contents and for all relative densities.
The measured value of dmax which are plotted versus σ3′ for each cement content and for each material, are
very close to the curves defined by Equation 4.7 with the coefficients listed in Table 4.5. Values of dmax are
higher for higher cement content, for all densities and for both materials, which means that the maximum rate of dilation increases with increasing cement con-tent or with increasing contact cohesion, since contact cohesion increases with increasing cement content. Cemented sands behave like uncemented sands with higher density (Hardin, 1988).
Reference
Cauley, R.F., Kenedy, T.W., 1973, “Proposal for
Improved Tensile Strength of Cement Treated Materials”, Highway Research Record No. 422, pp. 34-43.
Dupas, J.M., Pecker, A., 1979, “Static and Dynamic Properties of Sand – Cement,” Journal of Geotechnical Engineering Division, ASCE-GT3, pp. 419-436.
Gibson, R.E., 1953, “Experimental Determination of the True Cohesion and True Angle of Internal Friction in Clays”, Proceeding of the 3rd Inter-national Conference in Soil Mechanics, Zurich: vol. 1, pp 126-130.
Hardin, B.O., 1983, “Advance Soil Mechanics Class Note”, Department of Civil Engineering, University of Kentucky, Lexington, Kentucky.
Hardin, B.O., 1978, “The Nature of Stress-Strain Behavior of Soils”, Proceeding on Specialty Conference on Earthquake Engineering and Soil Dynamics, ASCE, Pasadena, California, June, pp. 19-21.
Hardin, B.O., 1985, “Strength of Soils in Terms of Effective Stress”, Richart Commemorative Lectures, GT Division Session, ASCE Fall Convention, Detroit, MI, October, pp. 1-78.
Hardin, B.O., 1988, “The Low Stress Dilation Test”, US Air force Office of Scientific Research.
Ingles, O.G., Metcalf, J.B., 1972, “Soil Stabilization Principles and Practice”, Butterworths & Co. Publishing House, 1st edition, Melbourne.
Kezdi, A., 1979, “Stabilized Earth Roads”, Elsevier Scientific Publishing Company.
Kolias, S., Williams, R.I.T., 1984, “Estimation of the Modulus of Elasticity of Cement Stabilized Materials”, American Society for Testing and Materials.
Lambe, T.W., 1960, “A Mechanistic Picture of Shear Strength in Clay”, Research Conference on Shear Strength of Cohesive Soils, University of Colorado, Boulder, Colorado.
Lambe, T.W., Whitman, R.V., 1979, “Soil Mechanics, SI version”, John Wiley and Sons.
Mitchell, J.K., 1976, “Fundamental of Soil Behavior”, John Wiley and Sons.
Rad, N.S., 1983, “Static and Dynamic Behavior of
Cemented Sands”, Ph.D. Dissertation, Stanford University.
Rad, N.S., Clough, G.W., 1984, “New Procedure for Saturating Sand Cement Specimens”, ASCE Geotechnical Eng.
Rowe, P.W., 1962, “The Stress Dilatancy Relation for Static Equilibrium of an Assembly of Particles in Contacts”, Proceeding of the Royal Society, London, Series A, vol. 269, no. 1339, pp. 500-527.
Schmertmann, J.H., Osterberg, J.O., 1960, “An Experimental Study of the Development of Cohesion and Friction with Axial Strain in Saturated Cohesive Soils”, Research Conference on Shear Strength of Cohesive Soils, Boulder, Colorado, pp. 643-694.
Schmertmann, J.H., 1971, “The Shear Behavior of Soil with Constant Structure”, Internal Report, Department of Civil Engineering, University of Florida.
Seed, H.B., 1976, “Recent Development in Evaluating the Potential for Soil Liquefaction and Founda-tion Failure during Earthquake”, Proceeding during Inaugural Symposium, September 17, pp. 61-115.
Sitar, N., 1979, “Behavior of Slopes in Weakly Cemented Soils under Static and Dynamic