47
Prediction of Building Condition after Earthquake
Using Artificial Neural Network
Mardiyono1, Reni Suryanita2 1Teknik Informatika Politeknik Negeri Semarang Jl. Prof. H. Soedarto, SH Tembalang Semarang
Telp. 024-7473417 Fax: 024-7472396 Email : [email protected]
Tel : 085876251881
2Teknik Sipil Universitas Riau Jl. HR Subrantas km 12,5 Pekanbaru Riau
Telp. 0761-65593 Fax: 0761-63279 Email : [email protected]
Abstract
Artificial neural network (ANN) is one branch of artificial intelligence that mimics the workings of the human brain nerve. ANN is able to predict of output from the input data set that previously had done the learning process. In the event of an earthquake, a building will suffer damage either safe, moderate, or collapse. After an earthquake, a building need to be audited to determine its status or damage index if it is safe (Immediate Occupancy), moderate safe (Life Safety), or damage (Collapse Prevention). In the manual system, it takes a long time because the building experts will gather data before determining the condition of the building that is it still worth or not. This paper explains the design and testing of neural networks application to predict the condition of the building using the data obtained from the simulated earthquake on a building using Finite Element Analysis software. The ANN architecture was designed using feed forward and back propagation algorithm to decrease the error and set the weight in specific iteration, furthermore it is trained with 835 data. The results show that the prediction accuracy of ANN application to the 100 testing data is 92 % with 16 input neurons, 32 hidden neurons, 1 output and 0.1 learning rate.
Keywords: ANN, Building, Prediction, damage index
1. Introduction
The decision of building status after an earthquake is very important to ensure that the building is secure or not to reuse especially on the tall building. There are three performances status of the structure building based on Federal Emergency Management Agency (FEMA) 356 [15] due to earthquake; (1) Immediate Occupancy (IO) or safe, (2) Life Safety (LS) or moderate safe/partial damage, and (3) Collapse Prevention (CP) or total damage. Traditionally, the inspection of the building is performed by gathering the data from accelerometer then calculating using Finite Element method. The calculations carry out the damage index that represents the status of the building in three mentioned categories. This method takes a long time, whereas the tall building or vital object must be reused as soon as possible.
48
This paper is organized as follows; Chapter 2 explains the overview of ANN. Chapter 3 discusses the research methodology used in this research while result and discussion describes in chapter 4. Finally this paper is concluded by conclusion and future work.
2. Artificial Neural Network
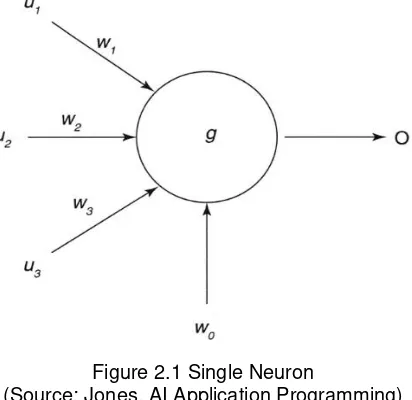
Basically, the architecture of ANN comprises of input layer, hidden layer, and output layer containing a mathematical function to calculate the output, error and weight of each cell/neuron. A single neuron or single layer perceptron involves a set of inputs, activation functions, and weights of synapse. The neuron is depicted in figure 2.1.
Figure 2.1 Single Neuron
(Source: Jones, AI Application Programming)
The neuron shown in Figure 2.1 has three inputs (U1, U2, U3). It also includes a bias input (w0). All inputs have the weights (w1, w2, w3) connected to the neuron. The
Output of neuron (O) is provided by calculating inputs, weights, and bias according to the following equation [14]:
𝛾 = 𝑤
0+ ∑
3𝑖=1𝑢
𝑖𝑤
𝑖(1)
𝛾 = −1, 𝑖𝑓(𝛾 ≤ 0
)
𝛾 = 1, 𝑖𝑓(𝛾 > 0
)
The activation function called sign function is utilized to provide the output whenever the value of the output is less than or equal to zero, the output is set to -1 otherwise it is set to 1. There are several types of activation function used to compute the output. Figure 2.2 shows the activation function of a neuron.
Step function Sign function
49
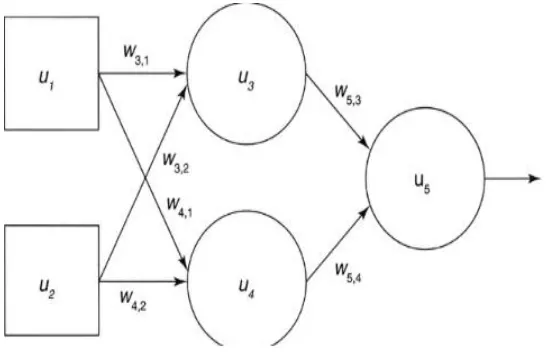
To solve the complex and non linier problem, ANN is composed in multiple-layer perceptron comprising three layers such as input, hidden, and output layer. The result of input cell is used as the input of hidden cell. Furthermore the output result of hidden cell is utilized in the input of output cell. The topology of multiple-layer perceptron is shown in Figure 2.3.
Figure 2.3 Multiple-layer perceptron (Source: Jones, AI Application Programming)
Figure 2.3 illustrates three layers of multiple-layer perceptron. Input layer is represented by U1 and U2 while two cells (U3 and U4) represent as hidden layer and U5 is
the cell of output layer. The connection of each cell includes weight vector that is calculated with Un in sum of product. The result of the sum of product is transferred through sigmoid
function to obtain the result of each cell. For example the output of U5 is computed using
the following equation [14].
𝑈
5= 𝑓(𝑈
3𝑊
5,3+ 𝑈
4𝑊
5,4)
(2)
In learning process, backpropagation algorithm computes the error value and updates the weight starting at the output cell to hidden cell. Equation (3) and (4) calculate the error of output and hidden cell.
𝛿
0= (𝐶
𝑖− 𝑢
5)𝑢
5(1 − 𝑢
5)
(3)
𝛿
𝑖=
(∑
𝑚:𝑚>𝑖𝑤
𝑚,𝑗𝛿
0)𝑢
𝑖(1 − 𝑢
𝑖)
(4)
Where
m : denotes all cells connected to hidden note w : weight vector
u : the activation
The weight of output and hidden cell will be updated by equation (5) and (6).
w ∗
i,j= w
i,j+ ρδ
0u
i(5)
w ∗
i,j= w
i,j+ ρδ
iu
i (6)Where
ρ = learning rate
50
A set input data is fed forward through the network; the backpropagation is performed and gets the MSE. The process will be iterated up to specific times (example 500, 1000, etc) or it will stop if the MSE attains a minimum error (e.g. 0.001). A lot of learning data make ANN more intelligent. After performing the learning process, the ANN is ready to predict the output.
3. Research Methodology
A methodology explains several steps from designing of the sensor location in the building, gathering the data throughout the simulation, designing the ANN architecture, developing the software, performing the learning process, and testing the ANN with other data.
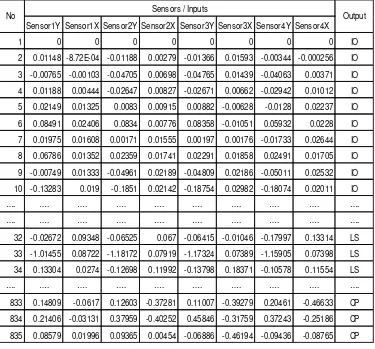
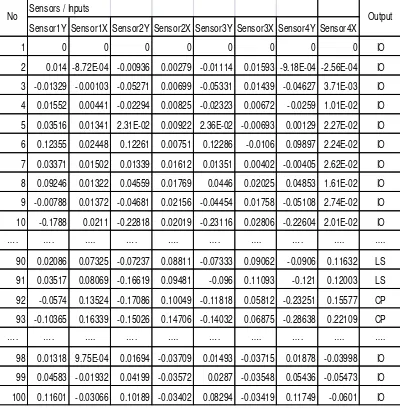
Sensors are placed in tall building (14 floors) involving 1 sensor placed in ground floor, 3 sensors installed in floor 7, and 4 sensors are in top floor. Therefore the sensors take the data from the ground, middle, and top building. Each sensor carries out two acceleration data including X and Y direction. The design of sensor location is simulated using Finite Element Analysis software to obtain the acceleration data X, Y, and status or damage index (IO, LS, or CP). These data are separated into two sets; 835 rows for learning and 100 for testing. The sample learning and testing data gathered from simulation are shown in Table 3.1 and 3.2.
Table 3.1. The Sample Learninng Data
Sensor1Y Sensor1X Sensor2Y Sensor2X Sensor3Y Sensor3X Sensor4Y Sensor4X
1 0 0 0 0 0 0 0 0 IO
2 0.01148 -8.72E-04 -0.01188 0.00279 -0.01366 0.01593 -0.00344 -0.000256 IO
3 -0.00765 -0.00103 -0.04705 0.00698 -0.04765 0.01439 -0.04063 0.00371 IO
4 0.01188 0.00444 -0.02647 0.00827 -0.02671 0.00662 -0.02942 0.01012 IO
5 0.02149 0.01325 0.0083 0.00915 0.00882 -0.00628 -0.0128 0.02237 IO
6 0.08491 0.02406 0.0834 0.00776 0.08358 -0.01051 0.05932 0.0228 IO
7 0.01975 0.01608 0.00171 0.01555 0.00197 0.00176 -0.01733 0.02644 IO
8 0.06786 0.01352 0.02359 0.01741 0.02291 0.01858 0.02491 0.01705 IO
9 -0.00749 0.01333 -0.04961 0.02189 -0.04809 0.02186 -0.05011 0.02532 IO
10 -0.13283 0.019 -0.1851 0.02142 -0.18754 0.02982 -0.18074 0.02011 IO
…. …. …. …. …. …. …. …. …. ….
…. …. …. …. …. …. …. …. …. ….
32 -0.02672 0.09348 -0.06525 0.067 -0.06415 -0.01046 -0.17997 0.13314 LS
33 -1.01455 0.08722 -1.18172 0.07919 -1.17324 0.07389 -1.15905 0.07398 LS
34 0.13304 0.0274 -0.12698 0.11992 -0.13798 0.18371 -0.10578 0.11554 LS
…. …. …. …. …. …. …. …. …. ….
833 0.14809 -0.0617 0.12603 -0.37281 0.11007 -0.39279 0.20461 -0.46633 CP
834 0.21406 -0.03131 0.37959 -0.40252 0.45846 -0.31759 0.37243 -0.25186 CP
835 0.08579 0.01996 0.09365 0.00454 -0.06886 -0.46194 -0.09436 -0.08765 CP
No Sensors / Inputs Output
51
Sensors / Inputs
Sensor1Y Sensor1X Sensor2Y Sensor2X Sensor3Y Sensor3X Sensor4Y Sensor4X
1
0
0
0
0
0
0
0
0
IO
2
0.014 -8.72E-04 -0.00936
0.00279 -0.01114
0.01593 -9.18E-04 -2.56E-04
IO
3 -0.01329 -0.00103 -0.05271
0.00699 -0.05331
0.01439 -0.04627 3.71E-03
IO
4
0.01552
0.00441 -0.02294
0.00825 -0.02323
0.00672
-0.0259 1.01E-02
IO
5
0.03516
0.01341 2.31E-02
0.00922 2.36E-02 -0.00693
0.00129 2.27E-02
IO
6
0.12355
0.02448
0.12261
0.00751
0.12286
-0.0106
0.09897 2.24E-02
IO
7
0.03371
0.01502
0.01339
0.01612
0.01351
0.00402 -0.00405 2.62E-02
IO
8
0.09246
0.01322
0.04559
0.01769
0.0446
0.02025
0.04853 1.61E-02
IO
9 -0.00788
0.01372 -0.04681
0.02156 -0.04454
0.01758 -0.05108 2.74E-02
IO
10
-0.1788
0.0211 -0.22818
0.02019 -0.23116
0.02806 -0.22604 2.01E-02
IO
….
….
….
….
….
….
….
….
….
….
90
0.02086
0.07325 -0.07237
0.08811 -0.07333
0.09062
-0.0906
0.11632
LS
91
0.03517
0.08069 -0.16619
0.09481
-0.096
0.11093
-0.121
0.12003
LS
92
-0.0574
0.13524 -0.17086
0.10049 -0.11818
0.05812 -0.23251
0.15577
CP
93 -0.10365
0.16339 -0.15026
0.14706 -0.14032
0.06875 -0.28638
0.22109
CP
….
….
….
….
….
….
….
….
….
….
98
0.01318 9.75E-04
0.01694 -0.03709
0.01493 -0.03715
0.01878 -0.03998
IO
99
0.04583 -0.01932
0.04199 -0.03572
0.0287 -0.03548
0.05436 -0.05473
IO
100
0.11601 -0.03066
0.10189 -0.03402
0.08294 -0.03419
0.11749
-0.0601
IO
No
Output
Table 3.1 and 3.2 describes data from the 16 sensors (the table shows 8 sensors only). For example Sensor1Y means the data Y direction of sensor 1 while Sensor1X represents the data X direction of Sensor 1. The Output includes three values IO, LS, and CP. Learning data need the output value in the decimal format therefore IO is converted to 0, LS = 0.5, and CP = 1.0.
3.1 ANN Architecture Design
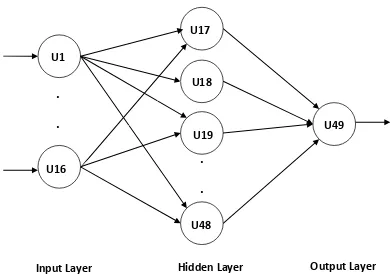
This research utilizes multiple-layer network of ANN including three layers of input, hidden, and output layer. The layer of input has 16 cells where 8 sensors produce 16 input data (X and Y direction). The Architecture is illustrated in Figure 3.1.
52
Figure 3.1.The Architecture of ANN
The input data should be normalized before transferring to the network. The normalization utilized in this study is defined as follows:
𝛿 = (𝑚𝑎𝑥𝑇𝑎𝑟𝑔𝑒𝑡 − 𝑚𝑖𝑛𝑇𝑎𝑟𝑔𝑒𝑡) ∗ |(𝑑 − 𝑑
𝑚𝑖𝑛)/(𝑑
𝑚𝑎𝑥− 𝑑
𝑚𝑖𝑛)| +
𝑚𝑖𝑛𝑇𝑎𝑟𝑔𝑒𝑡
(7)Where:
𝛿
: Value after normalized : Value before normalized𝑚𝑎𝑥𝑇𝑎𝑟𝑔𝑒𝑡
: Desired maximum value𝑑
𝑚𝑎𝑥 : Value of maximum data𝑚𝑖𝑛𝑇𝑎𝑟𝑔𝑒𝑡
: Desired minimum value𝑑
𝑚𝑖𝑛 : Value of minimum data3.2 Software Design
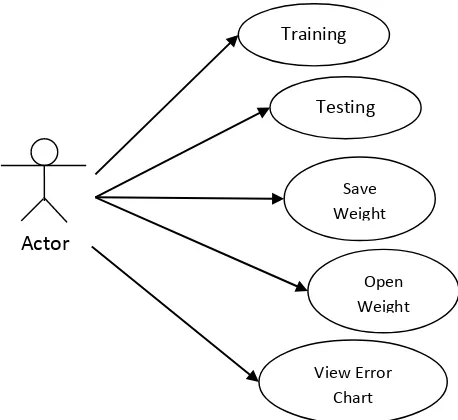
The use case represents the design of software that describes the functionalities performing by the user or an actor. There are 5 use cases such as training data, testing data, view the chart of MSE, save and open the last weight configuration. The software is developed using VB.Net application and utilized external text file to read/write the data. The design of use case is shown in Figure 3.2.
U1
U16
U17
U48
U49
Output Layer
(1 cell)
Hidden Layer
(32 cells)
Input Layer
U18
U19
.
.
.
53
Figure 3.2.The Design of Use Case
4. Result and Analysis
The result is obtained by training the ANN using 835 data and testing 100 different data. The learning process is iterated up to 1000 times and learning rate is set to 0.1. This step carries out the MSE = 1.6 E-10. Figure 4.1 shows the learning or training process.
Figure 4.1. Result of Training Process
4.1 Result of Damage Index Prediction
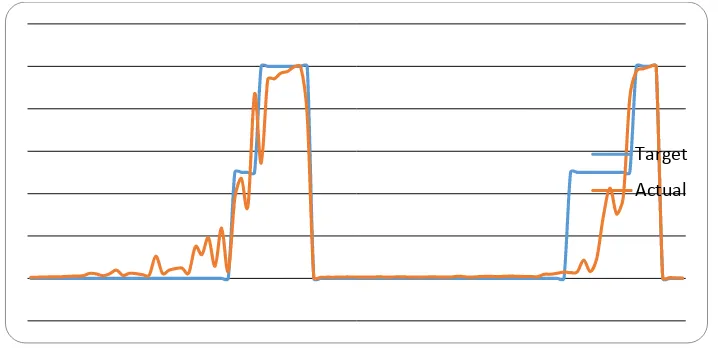
In the testing step, 100 data are examined feed-forward to the network. The result is describes in Figure 4.2. Each target output is set in specific range for instance: IO has the value ranges from -0.25 to less than 0.25, LS ranges from 0.25 to less than 0.75 and CP has the value ranges from 0.75 up to 1.
Based on the result shown in Figure 4.2 ANN could predict the damage index up to 92 % where 92 of 100 data can be predicted. All 74 IO data is able to be predicted successfully meanwhile 7 of 14 LS data can be predicted. Finally, ANN can predict 11 of 12 CP data. It indicates that ANN is good to predict IO and CP data (100 % and 91.6 %) and weak to predict LS data (50%). Several data cannot be predicted involving 1 data of CP and 7 data of LS. The result indicates that the ANN needs more learning data of LS to increase the precision to predict the output of damage index.
Training
Testing
Save Weight
Open Weight
54
Figure 4.2. Result of Training Process
5. Conclusion
The prediction of building condition after earthquake using artificial neural network has been explained and carried out the expected result. Based on the testing result, the ANN could predict the output of 100 testing data with the prediction rate is 92%. The percentage of accuracy can be increased by adding more LS data in learning process. Using ANN application, the damage index of the building can be predicted faster than building inspection manually. This research can be enhanced to other cases regarding to the building or bridge inspection after an earthquake.
6. Acknowledgment
The authors would like to thank to Politeknik Negeri Semarang and Universitas Riau for the support. The high appreciation is also presented to Prof. Azlan Adnan from SEER-UTM and Mohammad Reza Vafei, Phd student of Civil Engineering UTM for the valuable contribution.
References
[1] Chen-wen Y, Jian Y. Application of ANN for the Prediction of Building Energy Consumption at Different Climate Zones with HDD and CDD. 2nd International Conference on Future Computer and Communication (ICFCC). Wuhan China. 2010; volume: 3 pages i-xxiii.
[2] Tugce K, Murat G, Selcen B. Artificial Neural Network to Predict Daylight Illuminance in Office Building. Building and Environment. 2009; Vol.(Issue): 4 pages 1751-1757.
[3] Jun-Jie W, Hui-Ying G, Ming-Qiong L. Seismic Damage Prediction of Multistory Building Using GIS and Artificial Neural Network. Sixth International Conference on Natural Computation (ICNC). Shandong China. 2010; volume: 8 pages 1821-1824.
[4] Sriram N, Suresh S, Sundararajan N. Direct Adaptive Neural Controller for Earthquake Excited Nonlinear BaseIsolated Buildings. 22nd IEEE International Symposium on Intelligent Control. Singapore. 2007; volume: - pages 138-143.
[5] Jing C, Qingjie Z, Youpo S. Predictive Model of Artificial Neural Network for Disaster Prevention. 2nd IEEE International Conference on Information Management and Engineering (ICIME). Chengdu, China. 2010; volume: - pages 365-369.
[6] Chen Y, Liu T, Liu W. Predictive Model of Artificial Neural Network for Earthquake Influence Analysis International Forum on Information Technology and Application (IFITA). Chengdu, China. 2009; volume: 1 pages 20-23.
[7] Wang J, Gao H, Xin J. Application of Artificial Neural Network and GIS in Urban Earthquake Disaster Mitigation. International Conference on Intelligent Computation Technology and Automation (ICICTA). Changsha, Hunan, China. 2010; volume: 1 pages 726-729.
Target
55
[8] Lei S, Jin W. Application of Artificial Neural Network to Predict the Hourly Cooling Load of an Office Building. International Joint Conference on Computational Science and Optimization. Sanya, Hainan, China. 2009; volume: 1 pages 528-530.
[9] Li X, Ding L, Deng Y, Li I. Hybrid Support Vector Machine and ARIMA Model in Building Cooling Prediction. International Symposium on Computer, Communication, Control and Automation. Sanya, Hainan, China. 2009; volume: 1 pages 528-530.
[10] Ju H, Li JW. Application of Artificial Neural Network Approach for Intelligent Building in China. Fourth International Conference on Computer Sciences and Convergence Information Technology. Seoul, Korea. 2009; volume: 1 pages 1320-1324.
[11] Li Q, Xiaoying D. Research on Selection of Tall Building Structures Based on Artificial Neural Network. Sixth International Conference on Natural Computation (ICNC). Shandong China. 2010; volume: 8 pages 1808-1811.
[12] Yan CW, Yao J. Research on the Optimization of Building Energy Efficient Measures Based on Incremental Costs. 2nd International Conference on Computer Engineering and Technology (ICCET). Chengdu China. 2010; volume: 6 pages 184-187.
[13] Chen XJ, Gao ZF, Wang W. Application of BP Artificial Neural Network in Structure Damage Identification. International Conference on Intelligent Computation Technology and Automation (ICICTA). Changsha, Hunan, China. 2010; volume: 1 pages 733 - 737.
[14] Jones TM. AI Application Programming. Massachusetts: Charles River Media, INC. 2003: 94-100.