An Evaluation of a Government Performance Accountability
Indonesian District Governments to policy makers. This study utilizes the evaluation result of Government Performance Accountability System (SAKIP) 2010 to analyze the effort of 273 District governments in Indonesia in implementing the SAKIP.The research question of this paper is: do auditor’s opinion and number of population have significant different to the SAKIP score? To investigate what factors that determine the score of Government Performance Accountability System (SAKIP), several theories as well as a logical thinking were taken to figure out the research question. Those theories as well as logical thinking reveal that revenue and spending, seize of population, area, poverty level, human development index, auditor’s opinion, number of government employee and education level government employee tend to correlate the SAKIP score.
Two hypotheses have been chosen in this paper: 1) higher level in Auditor’s Opinion more likely will increase the SAKIP score evaluation, and 2) size of Population has significant different to the SAKIP score. Result shows we have to reject all the null hypotheses.
INTRODUCTION
In the past 30 years, questions about governance capacities and the performance of governments has become internationally prevalent, and performance management has become a central concern in the field of public management (Boyne, Meier, O’Toole, & Walker, 2005). Hence, accountability is become an important value in the governmental operation. According to Blondal, governmental can be said accountable, when they showed to the citizen: (1) what they getting from the use of public funds in term of products and services (2) how these expenditures benefit their lives or the lives of those the care about, and (3) how efficiently and effectively the fund are used (Blondal, 2001). This type of accountability holds government responsible not only for its output, but also for the outcome (results). Moreover, to know the accountability degree of government, it needs measurement, reporting, and evaluation of its system.
The Government Performance Accountability System (SAKIP)
Indonesian Government has been implementing the system of performance accountability since 1999. This system is called as Government Performance Accountability System or Sistem Akuntabilitas Kinerja Instansi Pemerintah (SAKIP). The initiation of this system was started in 1996, when a working group in the Financial and Development Supervisory Board (BPKP) initiated a study on performance management. According to Sobirun Ruswadi, this initiative has been inspired by the Government Performance and Result Act (GPRA) of 1993 of the United States (Sobirun 2005). The development of this system then was more driven due to the monetary and economic crisis, implementation of regional autonomy, and change of regime in the late 1990s. In 1999, the government issued the President Instruction No.7/1999 on Government Performance Accountability System, in accordance with Act No.28/1999 on Good Governance of the State.
reporting activities comprehensively and integrally to fulfill the obligation of certain governmental institution in responsible for the success or failure in the main task execution and the function and organizational mission (President Instruction No.7/1999).
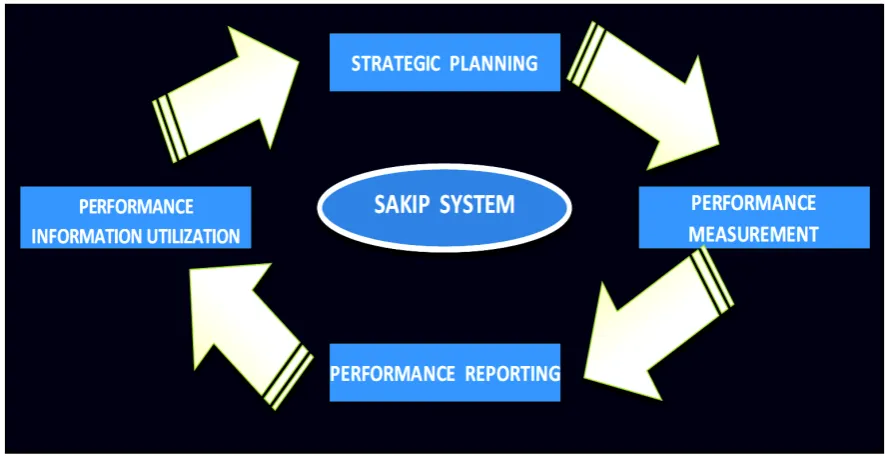
The SAKIP consists of four main elements: 1) strategic planning, 2) performance measurement, 3) performance reporting, and 4) performance information utilization.
Figure 1: The SAKIP System Cycle
1.
Strategic PlanningStrategic planning is defined as a five-year time period agencies’ or institutions’ performance plan which states vision, mission, five-year strategic goals, annual strategic objectives, and programs. Strategic Plan then is followed by Performance Planning and Annual Performance Agreement. Performance Planning is the process of preparing the Annual Performance Plan as the elaboration of goals and programs that have been built in the Strategic Plan. This annual performance plan then will be implemented by government agencies through a variety of activities on an annual basis. In this plan, the target of annual performance was created for all existing performance indicator at the level of goal. This plan was prepared every year in the beginning of budget year
Annual Performance Agreement is required between a government official, a subordinate, and his or her superior. Along with a one page statement of Performance Agreement, a summary of Annual Performance Plan which reveals the main program that must be accomplished by the signing official, and strategic objectives that were expected to be attained, and performance indicators (outputs and or outcomes), and the budget of each program has to be attached.
2.
Performance MeasurementPerformance Measurement is a management tool that used to improve the quality of decision making and accountability in order to assess the success/failure of the implementation of the activity/program in accordance with the goals and objectives that have been set. Performance Measurement is done by comparing performance indicator achievements with the targets planned, and with prior years’ achievements. Performance achievement is reported annually in the Government Performance Accountability Report.
3.
Performance Reportingthe comparison between actual performances achieved with the performance goals established in the agency performance plan. The results shall be described in relation to such specifications, including whether the performance failed to meet the criteria of a minimally effective or successful program.
4.
Performance Information UtilizationThe District governments should use their performance information in order to improve their government performance. Based on the performance information, the District government would frame their new strategic planning for the next period.
The Evaluation of Government Performance Accountability (SAKIP Evaluation)
As of the SAKIP, in the year of 2003, the Financial and Development Supervisory Agency (BPKP) had a mandate to evaluate annually the SAKIP implementation of District Government. However, during of 5 years of SAKIP evaluation (2003-2007), the process of evaluation were not run as smoothly since District Government seems were not really pay attention to the SAKIP and delayed in reporting the SAKIP implementation to the Central Government.
To solve that problem, by the end of year 2008, the Central Government under the coordination of three government institutions, The National Institute of Public Administration (LAN), The Ministry of Administrative Reform (MENPAN), and The Financial and Development Supervisory Board (BPKP), pushed the District government to be more accountable by reporting their SAKIP implementation. Furthermore, the Central Government (Ministry of Bureaucratic Reform) also released a new guidance of SAKIP Evaluation to be used by BPKP as a SAKIP evaluator. This new guidance was effectively used in the SAKIP Evaluation year 2009.
According to the SAKIP evaluation guidance, the procedures for SAKIP evaluation are as follows: a. At least three months after the fiscal year ended, the District Government should report their annual SAKIP implementation to the Central Government (the Ministry of Bureaucratic Reform).
b. The Ministry of Bureaucratic Reform then decides which district governments that will be evaluated by the BPKP. Not all the SAKIP report from the district governments will be evaluated and its number are varies every year depends on the Central Government budget. If the Central Government allocates more budgets to evaluate the SAKIP implementation, there will be a larger number of SAKIP that will be evaluated.
c. The Ministry of Bureaucratic Reform then assigns the Financial and Development Supervisory Board (BPKP) to evaluate the district governments’ SAKIP implementation report. The SAKIP evaluation process starts on July until August.
d. The BPKP then submit the SAKIP evaluation report to the Ministry of Bureaucratic Reform. The methodology of SAKIP evaluation that used by BPKP is by using technique of “criteria
referenced survey”, meaning that assessing gradually step by step assessment of five components (strategic performance planning, performance measurement, performance reporting, performance evaluation, and performance achievement) and then assess each component as a whole (overall assessment) with criteria evaluation of each components that have been set before. The criteria evaluation as stipulated in the Evaluation Criteria Working Papers is determined based on:
1.
The normative truth as defined in the guidelines for the preparation of the Government Performance Accountability Reports.2.
The normative truth based on the modules or books of the Government Performance Accountability System.3.
The normative truth based on the best practices in Indonesia as well as best practices in other countries.4.
The normative truth based on the variety practices of strategic management as well as practices of developed accountability system.No Category Score
The final score of the SAKIP evaluation has a scale from 0 to 100. Regarding to the guidance of SAKIP evaluation 2010, there are six categories of SAKIP score: excellent, very good, good, fair, poor and very poor.
Figure 2: Score SAKIP table
THE SAKIP EVALUATION 2010 in INDONESIAN DISTRICT GOVERNMENTS
In year 2010, the BPKP has evaluated SAKIP in 273 district governments, covering the district governments in 32 provinces and six big islands in Indonesia, which are Sumatera island, Kalimantan island, Java island, Bali and Southern Nusa island, Sulawesi island, and the last is Maluku and Papua island.
1.
Sumatera Island2.
The total District governments’ SAKIP in Sumatera Island that has been evaluated by the BPKP in year 2010 are 89 District governments. These District governments represent 10 provinces in Sumatera.3.
Java Island4.
The BPKP in 2010 has evaluated 66 District governments in Java Island. These District governments represent 5 provinces, which are West Java, Banten, Central Java, Yogyakarta, and East Java8.
The total District governments’ SAKIP in Bali and Southern Nusa Island that has been evaluated by the BPKP in year 2010 are 27 district governments. These district governments represent 3 provinces.9.
Sulawesi Island10.
The total district governments’ SAKIP in Sulawesi Island that has been evaluated by the BPKP in year 2010 are 27 district governments. These district governments represent 6 provinces.11.
Maluku and Papua Island12.
The total District governments’ SAKIP in Maluku and Papua Island that has been evaluated by the BPKP in year 2010 are 19 District governments. These District governments represent 3 provinces.Based on the SAKIP evaluation result, the average score for SAKIP Evaluation year 2010 in 273 District governments is 30.78 or in the level of poor condition. The result also shows that the lowest score of SAKIP evaluation is 3.89 and the highest score is 69.98.
Variable Obs Mean Std. Dev. Min Max
If we look at the table distribution of SAKIP score based on the category, we can figure out that from 273 District governments, only two District governments (0.73%) obtained good category and six District governments (2.198%) obtained fair category. Mostly the Indonesian District governments obtained SAKIP evaluation score in the level very poor condition (52% or 123 District governments), and in the level of poor condition (45.05% or 142 District governments).
SAKIP
Figure 4: The SAKIP score evaluation based on Categories
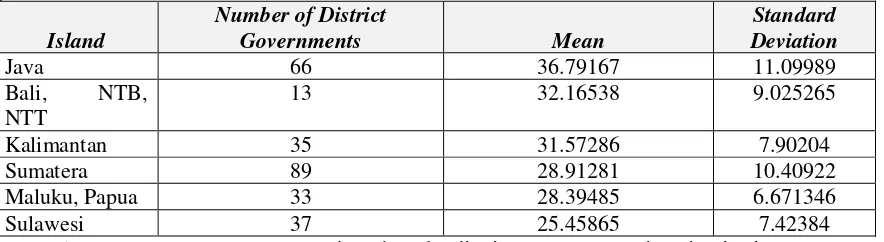
Moreover, we could see the distribution of the SAKIP evaluation score based on the District governments’ location in six islands are as follow:
Maluku, Papua 33 28.39485 6.671346
Sulawesi 37 25.45865 7.42384
Figure 5: The SAKIP score evaluation based on the district governments’ location in six Islands Based on the table above, we can look the average score of District governments in Java, Bali, NTB, NTT, and Kalimantan are in the range of 30 – 37 (poor condition). While other District governments in Sumatera, Maluku, Papua and Sulawesi have a score of SAKIP evaluation in the range of 25 - 29 (very poor condition).
RESEARCH QUESTION
Regarding to the description the SAKIP implementation in Indonesian district governments, then I have a research question. The research question is do auditor’s opinion and seize of population have significant different to the SAKIP score?
LITERATURE REVIEW
Some studies addressing several factors contributing to the government performance accountability system in the local government. Sebastian Eckardt (2008) in his paper explains about linking accountability. He describes that spending levels and revenue are likely to impact the level of performance accountability of local governments. In addition, Sebastian also explains the design of local government institutions varies greatly across countries in terms of revenue and expenditure assignment, balance of power between local and central government, the political and organizational set-up of local governments and overall institutional development.
Eilen Munro (2004) in his paper argues that government financial issues have also changed the climate of audit opinion and the financial audit can be a driven for government accountability. In addition he explains when organizations do not have clear measures of productivity relating their inputs to their outputs, the audit of efficiency and effectiveness is in fact a process of defining and operationalizing measures of performance for the audit entity.
(2008) reveal that population is more likely generate local government to perform better. However, Afonso, Schuknecht, and Tanzi (2003) and Brunetti and Weder (1999) present evidence supporting the opposite conclusion.
Logical thinking also reveals that education level of government employee, area in km, poverty level, and human development index as factors that also may contribute to the government performance accountability system in the district government. Education level government employee is supposed to generate district government employee to work and perform better. Education provides people more information and knowledge so that they may know how to achieve their mission. Therefore, it is expected that the higher the level of education, the better the district government performance.
Human development index (HDI) in a district government is intended to evoke a better government. HDI gives information about people’s life expectancy, people’s educational attainment, and district government’s GDP per capita. The higher level of HDI proves the fruitfulness of district government managing a better government and accomplishing its mission. Therefore, it is expected that the higher level of HDI, the better the district government performance.
Poverty level is also supposed to give a depiction of the government performance. Poverty level provides more a real picture of district government in performing their government. Higher in poverty level is meaning that there are many people in a district government that living as a poor people. Therefore, it is expected that the lower level of HDI, the better the district government performance.
HYPOTHESES
Based on the theories above, then I have two hypotheses. I will focus on the factor of auditor’s opinion and the number of population. Hence, my hypotheses are:
1. Higher level in Auditor’s Opinion more likely will increase the SAKIP score evaluation 2. Size of Population has significant different to the SAKIP score.
METHODOLOGY AND DATA COLLECTION
Number of Observation
From the total of 497 district governments in Indonesia, there were 378 district governments (77%) in year 2010 has submitted their SAKIP implementation report to the BPKP. Meanwhile, due to the budget constraint and Auditor’s resources limitation, BPKP only evaluated 273 district governments of SAKIP reports (72.4%).
In this paper, all of the reports of SAKIP evaluation in year 2010 from 273 district governments have been chosen. This 273 District government represents 32 provinces in the Indonesia and six big islands in Indonesia (Sumatera, Kalimantan, Java, Bali and Southern East Nusa, Maluku and Papua, and Sulawesi).
Ordinary Least Square (OLS)
An ordinary least square (OLS) regression will be used to prove the hypotheses. In this part, multi regression analysis to find correlation between dependent variable and independent variable will be used.
1. Dependent Variable
Score of SAKIP Evaluation year 2010 from 273 District governments have been chosen as dependent variable.
2. Independent Variable:
District government’s financial (revenue and spending), demography (number of population, area in km), government structure (number of government employee, government employee level of education), economic (poverty level and human development index), and auditor’s opinion have been chosen as independent variable to investigate the what factors that correlate to the score of Governmental Performance Accountability System (SAKIP).
SAKIPScore :
The data that used in this paper are data from 273 District governments in Indonesia year 2010. The data consist of the SAKIP evaluation score, auditor’s opinion, financial, demographic, and economic data:
1.
The SAKIP Evaluation Report year 2010.The data show the score of SAKIP evaluation year 2010. The data are obtained from the Financial and Development Supervisory Agency (http://www.bpkp.go.id). The data are in percentage.
2.
Auditor’s Opinion: The data shows the level of auditor’s opinion of district governments from the Indonesian Supreme Audit. The four levels for Auditor’s Opinion are:a. Scale 1=Adverse opinion, b. Scale 2=Disclaimer opinion, c. Scale 3=Qualified opinion, and d. Scale 4=Unqualified opinion.
The highest level is unqualified opinion (scale 4) and the lowest is adverse opinion (scale 1). The data are obtained from the Audit Report of BPK. (http://www.bpk.go.id)
3. Financial Data.
Revenues and Spending: The data show the District governments’ budget revenue as well as expenditure in year 2010. The data are obtained from Directorate General of Financial Balance’s website. (http://www.djpk.depkeu.go.id/). The data are in million rupiah.
4. Demographic Data
a. Number of Government Employees: The data show how many civil servants that District governments have in year 2010. The data are obtained from the State Employment Agency (Badan Kepegawaian Negara/BKN).
b. Education level of government employees: The data show an average of education level of government employee in year 2010. The data are obtained from the State Employment Agency (Badan Kepegawaian Negara /BKN).
c. Number of population: The data show the number of population in District governments. The data are obtained from the result of the 2010 census conducted by BPS.
d. Area in km2: The data show the area of District governments’ year 2010 in km2. The data are obtained from http://indonesiadata.co.id/main/index.php
5. Economic Data
a. Human Development Index (HDI): The data shows the level of human development index (HDI) in District governments. HDI is composite measure, with three equally-weighted components:
1) Life expectancy,
2) Educational attainment, and 3) GDP per capita.
The HDI data are obtained from the results of Indonesian census 2010 conducted by BPS. The data are in percentage.
RESULTS
Multiple Regression Analysis
The result of multi regression is for follows:
IAuditorO~2 0.685
(-1.107597)
IAuditorO~3 0.530
(1.586701)
IAuditorO~4 0.032
(8.448818)
Revenue 0.085
(.000158)
Spending 0.558
(-4.36e-06)
HDI 0.194
(.2812478)
PovertyLevel 0.572
(-.0542727)
NumberGovE~e 0.117
(.0004412)
LevelEducG~m 0.751
(-.7680592)
Population 0.036
(-4.11e-06)
AreaKM 0.456
(.0000101)
Based on the stata result from OLS model, the P value of Auditor’s opinion 4 (0.032) and seize of population (0.036) are below 0.05, which is meaning that there is significant different in auditor’s opinion, and number of population. In other words, we can reject the hypotheses. The R squared as amount 0.1884 explains that the 18.84% of the dependent variable was explained by the independent variable.
The two of Independent variables that have significance different can be explained for as follows:
Auditor’s Opinion
Regarding to Arens Loebbeckke, auditor’s opinion is the statement recorded in an auditor's report by the external auditor (Arrens Loebbeckke, 1980). There are four major types in Auditor’s opinion: 1) unqualified opinion indicates the auditor's endorsement of the accuracy and adequacy of the disclosed information and of the firm's financial picture presented by it, 2) qualified opinion is issued when the auditor encountered one of two types of situations which do not comply with generally accepted accounting principles, however the rest of the financial statements are fairly presented, 3) disclaimer opinion is issued when the auditor could not form, and consequently refuses to present, an opinion on the financial statements., 4) adverse opinion indicates serious problems with the audit, and can be very damaging in its effect on the firm's reputation and financial position.
One of the audit procedure used by the auditor’s to give their opinion to the district government is by evaluating the District government’s internal control system. The better of having internal control system in the district government may result the better of auditor’s opinion.
which is synonymous with management control, helps government program managers achieve desired results through effective stewardship of public resources.
Since one of the methodologies in SAKIP evaluation is also evaluating district governments’ strategic planning including evaluating the mission, goals, and objectives as well as performance planning, hence it has a similarity with the way of auditor’s in assessing the internal control system. Furthermore, it may be concluded if the district government have a high level in auditor’s opinion, thus it may generate high score in SAKIP evaluation score. In other words, the auditor’s opinion correlates to the SAKIP evaluation score.
From the stata result, P value of Auditor’s opinion as amount 0.032 indicates the auditor’s opinion correlate to the SAKIP evaluation score. The coefficient Auditors’ Opinion 4 as amount 8.448 meaning that, the local governments which have unqualified auditors’ opinion will have SAKIP evaluation score 8.448 higher that the local government which have adverse auditor’s opinion
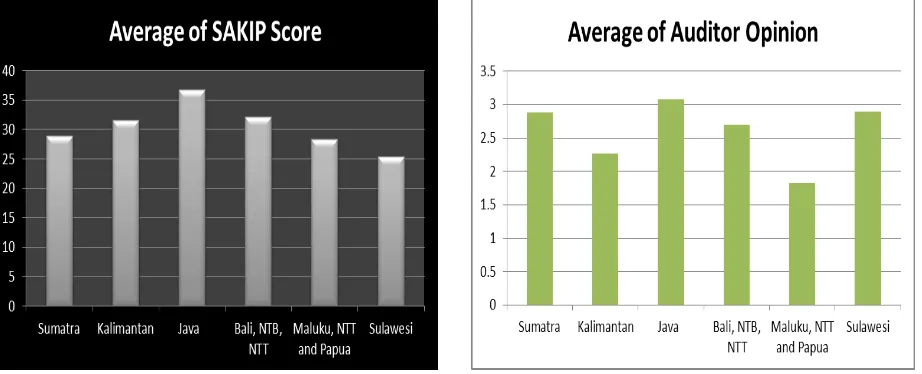
If we compare the distribution average of Auditor’s opinion and SAKIP score based on the island location of District governments we can see that the District governments in some islands have the same pattern. It may prove that the District governments that have a higher score in SAKIP score tend to have a higher score in Auditor’s opinion, and vice versa.
Figure 8: Histogram SAKIP score and Auditor Opinion
It may be true that auditor’s opinion correlates to the SAKIP evaluation score. In paralel with Munro, he reveals that the audit opinion in the financial audit can be a driven for government accountability. In addition he explains when organizations do not have clear measures of productivity relating their inputs to their outputs, the audit of efficiency and effectiveness is in fact a process of defining and operationalizing measures of performance for the audit entity. (Munro, 2004).
Seize of Population
No
Local Governments
Number of
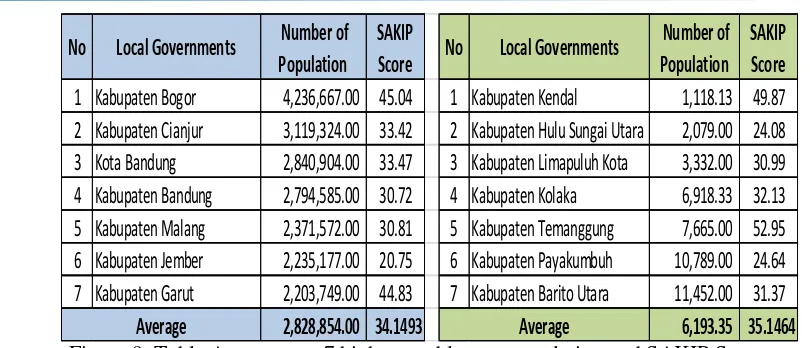
Figure 9: Table Average top 7 highest and lowest population and SAKIP Score
If we look at the top and bottom District governments that have highest and lowest number of population compare to their SAKIP score evaluation, it is seems that as total, the District governments that have lowest in seize of population have a pattern higher in SAKIP score. However, if we compare District government as individually that pattern is not really clear. In other words, the finding is not wholly consistent. For example is Kabupaten Bogor.
From the table above, Kabupaten Bogor is the top one in population in Indonesian district government. Even though Kabupaten Bogor has the highest population, its still has high SAKIP score if we compare to other Kabupaten, that has low in population, for example Kabupaten Hulu Sungai Utara. Kabupaten Bogor has population 4.2 million people and 45.04 score in SAKIP evaluation, while Kabupaten Hulu Sungai Utara has population 2 thousand people, and 24.08 score in SAKIP evaluation.
Concerning the number of population, there are some arguments about linking government performance accountability with the number of population. Some authors, Gene A. Brewer, Yujin Choi, Richard M. Walker (2008) reveal that populations are more likely generate District government to perform better. However, Afonso, Schuknecht, and Tanzi (2003) and Brunetti and Weder (1999) present evidence supporting the opposite conclusion.
Other Independent Variables:
Other variables such as revenue and spending, number of government employee, education level of government employee, area, human development index, and poverty level based on stata result have not statistically different. In other words, these variables do not correlate to the SAKIP evaluation score.
CONCLUSION AND RECOMMENDATION
Conclusion
The Government Performance Accountability System (SAKIP) is the responsibility instrument that consist of some indicators and mechanism of measurement, assessment, and performance reporting activities comprehensively and integrally to fulfill the obligation of certain governmental institution in responsible for the success or failure in the main task execution and the function and organizational mission.
142 District governments). Furthermore, the finding shows that as average, the district governments that located in eastern part of Indonesia have the lowest SAKIP evaluation score.
Moreover, the result also shows we should reject all hypotheses. The P value of Auditor’s opinion and the seize of population indicate there is a significant different between Auditor’s opinion, the number of population to SAKIP score evaluation. The coefficient for Auditor’s opinion is 2.239042 meaning that for a one unit increase in Auditor’s opinion, we would expect a 2.24 increase in SAKIP evaluation score. While for coefficient for the seize of population meanings that, a District government with 100,000 populations would be expected to have a SAKIP evaluation score 0.4 points lower than a District government with 1,000 populations.
Recommendation
The recommendation that I made is intended for policy makers in term of creating better governance for Indonesian District governments. The recommendations are:
1. The Central Government should push the district governments to implement the Government Performance Accountability System (SAKIP).
2. Imposing reward and punishment system regarding to the SAKIP implementation. This system may benefit to enhance the effort of District governments to implement the SAKIP.
3. The Central Government should provide assistance for district governments regarding to enhance the implementation process of SAKIP.
This assistance is provided with regard to the following things:
a. Giving priority for the district governments that located in eastern part of Indonesia. b. Giving priority for the district governments that have lower level in Auditor’s opinion
c. Giving priority for the district governments that have high population and low in SAKIP score evaluation.
4. The assistance that provided by the Central Governments could be in the form of:
a. Assisting in formulating the performance indicator, performance measurement, and performance accountability.
b. Conducting socialization activities of SAKIP to District governments.
c. Conducting dissemination of the Government regulation relating to the SAKIP
LIMITATION
APPENDIX
Descriptive Statistics
No Variable Definition Unit
1 ScoreSAKIP Score of SAKIP Evaluation 0 - 100
2 Auditor’sOpini Auditor’s Opinion 1 - 4
3 Revenue District Government Revenue Rupiah
4 Spending District Government Spending Rupiah
5 HDI Human Development Index Percentage
6 PovertyLevel Poverty Level Percentage
7 NumberGovEmployee
Number District Government
Employee
People
8 LevelEducGovEm
Education Level for Government
Employee
1 - 18
9 Population Number of Population People
10 AreaKM District Government Area in Km Km
11 Island Dummy Variable for Islands 1 - 6
Stata Results
. xi: reg ScoreSAKIP i.AuditorOpini Revenue Spending HDI PovertyLevel NumberGovEmployee LevelEducGovEm Population AreaKM, robus
> t
i.AuditorOpini _IAuditorOp_1-4 (naturally coded; _IAuditorOp_1 omitted)
Linear regression Number of obs = 252 F( 11, 240) = 4.61
Prob > F = 0.0000 R-squared = 0.1884 Root MSE = 9.0696
--- | Robust
. reg ScoreSAKIP AuditorOpini Revenue Spending HDI PovertyLevel NumberGovEmployee LevelEducGovEm Population AreaKM
Source | SS df MS Number of obs = 252 ---+--- F( 9, 242) = 5.55 Model | 4162.32197 9 462.480219 Prob > F = 0.0000 Residual | 20163.4048 242 83.3198546 R-squared = 0.1711 ---+--- Adj R-squared = 0.1403 Total | 24325.7268 251 96.9152462 Root MSE = 9.128
--- ScoreSAKIP | Coef. Std. Err. t P>|t| [95% Conf. Interval] ---+--- AuditorOpini | 2.239042 .8851055 2.53 0.012 .4955481 3.982536 Revenue | .0000158 8.99e-06 1.76 0.080 -1.89e-06 .0000335 Spending | -4.55e-06 6.95e-06 -0.65 0.513 -.0000183 9.14e-06 HDI | .3287551 .2008657 1.64 0.103 -.0669132 .7244235 PovertyLevel | -.0407412 .0985968 -0.41 0.680 -.2349586 .1534763 NumberGovE~e | .0004131 .0002248 1.84 0.067 -.0000297 .0008558 LevelEducG~m | -.2060773 2.445342 -0.08 0.933 -5.02295 4.610795 Population | -3.93e-06 1.86e-06 -2.11 0.035 -7.59e-06 -2.69e-07 AreaKM | 9.50e-06 .0000238 0.40 0.690 -.0000374 .0000564 _cons | -2.96359 30.76506 -0.10 0.923 -63.56507 57.63789 ---
. reg ScoreSAKIP AuditorOpini Revenue Spending HDI PovertyLevel NumberGovEmployee LevelEducGovEm Population AreaKM, robust
Linear regression Number of obs = 252 F( 9, 242) = 4.88 Prob > F = 0.0000 R-squared = 0.1711 Root MSE = 9.128
--- | Robust
---2
0
-1
0
0
10
20
30
20 25 30 35 40 45
Fitted values
Regression Diagnostics
Normality
a. Normal distribution of outcome (Score SAKIP)
b. Normality of Residuals
Homoscedasticity
Shapiro wilk test.
--- Source | chi2 df p ---+--- Heteroskedasticity | 71.59 54 0.0548 Skewness | 13.84 9 0.1282 Kurtosis | 1.93 1 0.1652 ---+--- Total | 87.36 64 0.0278 ---
Multicolinearity
REFERENCES
Afonso, A., Schuknecht, L., & Tanzi, V. (2003). Public sector efficiency: An international comparison. Working Paper. European Central Bank, Frankfurt, Germany.
Alvin Arens, Loebbecke James. 1980. Auditing, an integrated approach. Prentice-Hall.
Behn, Robert. 2008. Performance Information in the Public Sector: How it is Used.
0
.01
.02
.03
.04
.05
-20 0 20 40
Residuals Kernel density estimate Normal density kernel = epanechnikov, bandwidth = 2.5946
Blondal, and John, R. 2001, Budgeting in Sweden, in OECD Journal on Budgeting Volume 1 No.1, OECD Publication Service, France
Boyne, G. A., Meier, K. J., O’Toole, L. J., Jr., & Walker, R. M. (Eds). 2006. Public service performance: Perspectives on measurement and management. Cambridge: Cambridge University Press.
Central Bureau of Statistics’s (Biro Pusat Statistik/ BPS) website: (http://www.bps.go.id/tab_sub/view.php?tabel=1&daftar=1&id_subyek=23¬ab=4).
De Lancer Julnes, Patria, and Marc Holzer. 2001. Promoting the Utilization of Performance Measures in Public Organizations: An Empirical Study of Factors Affecting Adoption and Implementation. Public Administration Review 61 (6):693-708.
Directorate General of Financial Balance’s website (http://www.djpk.depkeu.go.id/)
Eckardt, Sebastian. 2008. Political Accountability, Fiscal Conditions and District Government Performance—Cross-Sectional Evidence From Indonesia. Public Administration and Development. 28, 1–17 (2008)
Gene A. Brewer, Yujin Choi, Richard M. Walker, (2008). Linking Accountability, Corruption, and Government Effectiveness in Asia: an Examination of World Bank Governance Indicators. Emerald Group Publishing Limited, pp. 227 – 245
Government Performance and Result Act (GPRA) of 1993 of the United States Greene, William H. 1990. Econometrics Analysis 2nd edition. Prentice Hall, NJ. Guidance of SAKIP Evaluation 2010, The Ministry of Bureaucratic Reform Gujarati, Damodar N. 1995. Basic Econometrics 3rd edition. McGraw-Hill, Inc. Indonesia Data: http://indonesiadata.co.id/main/index.php
Law number 33 Year 2004 about “Fiscal Balance Between the Central and District Government” Minister of Home Affairs Regulation number 13 Year 2006 about “Financial Guidance for Regional
Spending”
Munro, Eileen. 2004, The Impact of Audit on Social Work Practice, British Journal of Social Work President Instruction No.7/1999: Government Performance Accountability System
Sobirun, Ruswadi. 2005. The Development of Government Agency Performance Accountability System in Indonesia. OECD-ASIAN Countries Performance Management Symposium. Seoul. The Financial and Development Supervisory Agency’s website: http://www.bpkp.go.id
The State Employment Agency’s website: http://www.bkn.go.id The Supreme Audit’s website: http://www.bpk.go.id