This content has been downloaded from IOPscience. Please scroll down to see the full text.
Download details:
IP Address: 103.3.46.125
This content was downloaded on 21/05/2017 at 11:07
Please note that terms and conditions apply.
Indonesian palm civet coffee discrimination using UV-visible spectroscopy and several
chemometrics methods
View the table of contents for this issue, or go to the journal homepage for more
1234567890
International Symposium on Bioinformatics, Chemometrics and Metabolomics IOP Publishing IOP Conf. Series: Journal of Physics: Conf. Series 835 (2017) 012010 doi :10.1088/1742-6596/835/1/012010
Indonesian palm civet coffee discrimination using UV-visible
spectroscopy and several chemometrics methods
M Yulia1, and D Suhandy2
1 Department of Agricultural Technology, Lampung State Polytechnic, Jl. Soekarno
Hatta No. 10, Rajabasa Bandar Lampung, Indonesia
2 Department of Agricultural Engineering, Faculty of Agriculture, The University of
Lampung, Jl. Prof. Dr. Soemantri Brojonegoro No.1, Bandar Lampung, 35145, Indonesia
E-mail: [email protected]
Abstract. Indonesian palm civet coffee or kopi luwak (Indonesian words for coffee and palm civet) is well known as the world’s priciest and rarest coffee. To protect the authenticity of luwak coffee and protect consumer from luwak coffee adulteration, it is very important to develop a simple and inexpensive method to discriminate between civet and non-civet coffee. The discrimination between civet and non-civet coffee in ground roasted (powder) samples is very challenging since it is very difficult to distinguish between the two by using conventional method. In this research, the use of UV-Visible spectra combined with two chemometric methods, SIMCA and PLS-DA, was evaluated to discriminate civet and non-civet ground coffee samples. The spectral data of civet and non-civet coffee were acquired using UV-Vis spectrometer (Genesys™ 10S UV-Vis, Thermo Scientific, USA). The result shows that using both supervised discrimination methods: SIMCA and PLS-DA, all samples were correctly classified into their corresponding classes with 100% rate for accuracy, sensitivity and specificity, respectively.
1. Introduction
The use of infrared spectroscopy both NIR (near infrared) and MIR (mid infrared) as a rapid and non-destructive technique for the authentication and adulteration detection of food samples has been reported by several researchers. NIR spectroscopy utilizes the spectral range from 700 to 2500 nm and provides much more complex structural information related to the vibrational transitions associated mainly with C-H, N-H, and O-H functional groups. NIR spectroscopy has been used to detect food authentication in honey [1], milk powder [2], fishmeal [3] and coffee [4]. Recent researches reported effective detection of food adulteration using NIR spectroscopy in honey [5], coffee [6] and meat [7].
In MIR region (2500-25000 nm), spectra are commonly used for structural identification (fingerprinting) of organic compounds because the absorption bands are caused by fundamental vibrations of a specific functional group [8]. Authentication of food in this region has been reported for extra virgin olive oil [9], artisanal honeys adulterated with sugar solutions [10] and lard adulteration in cake [11].
In Raman spectroscopy, several researches for food authentication have been published. For example, rapid quantitative assessment of the adulteration of virgin olive oils with hazelnut oils using
2
1234567890
International Symposium on Bioinformatics, Chemometrics and Metabolomics IOP Publishing IOP Conf. Series: Journal of Physics: Conf. Series 835 (2017) 012010 doi :10.1088/1742-6596/835/1/012010
Raman spectroscopy and chemometrics was reported with the levels of hazelnut oils used to adulterate extra virgin olive oil were successfully quantified using partial least squares and genetic programming [12].
While there has been a steady growth in food authentication applications for NIR and MIR spectroscopy, there has been very little research conducted using UV–Visible spectroscopy (200-700 nm) for food authentication. Recently, the use of UV-Visible spectroscopy for identification of adulteration in ground roasted coffee has been reported with a 100% classification was obtained with SPA-LDA variable selection [13]. Using spectral region in the range 200-400 nm combined with SIMCA, a feasibility study for separation between civet and non-civet coffee was demonstrated [14]. Comparing to NIR and MIR spectroscopy, spectroscopy in UV-Visible region has an advantage in fact that spectrometer in this region is relatively low cost and it is available to most standard laboratories. This method is also a green technology without chemical waste during sample extraction.
Civet coffee or kopi luwak is one of the most rarest and expensive coffee in the world. It is one of the Indonesian coffee specialties. Civet coffee is any coffee bean (arabica or robusta) which has been eaten and passed through the digestive tract of Asian palm civet (Paradoxurus hermaphroditus), which uses its keen senses to select only the best and ripest berries. Due to the high price and limited production, civet coffee has been one the target for food adulteration. Several types of cheap non-civet coffees have been added into pure civet coffee to lead mislabeling of authentic civet coffee. Up to now, there is no research on spectroscopy area for civet coffee authentication. Therefore, in this study we reported an evaluation of using UV-Visible spectroscopy in combination with SIMCA (soft independent modelling of class analogies) and PLS-DA (partial least square-discrimination analysis) for discrimination between civet and non-civet coffee.
2. Research methodology 2.1. Samples
A number of 1 kg roasted robusta civet coffee (Indonesian palm civet coffee) and 1 kg roasted non-civet robusta coffee (Pagar Alam robusta coffee) were collected directly from coffee farmers at Liwa, Lampung, Indonesia (Hasti coffee Lampung). All coffee samples were grinded using home-coffee-grinder (Sayota). To avoid significant influence of particle sizes in coffee powder to spectral analysis, it is important to use same particle size in coffee powder samples [15]. In this research we use particle size of 420 μm by sieving through a nest of U. S. standard sieves (Mesh number of 40) on a Meinzer II sieve shaker (CSC Scientific Company, Inc. USA) for 10 minutes. The experiments were performed at room temperature (around 27-29°C). We prepare 100 samples of coffee samples which consist of two classes; class A and B. Class A has 50 samples of civet coffee without adulteration (pure 100% only civet coffee). Class B has 50 samples of robusta Pagar Alam coffee (non-civet coffee). The samples were divided into two groups, calibration set (60 samples) and prediction set (40 samples), randomly. Calibration both in SIMCA and PLS-DA was done with full-cross validation method. Number of optimal principal components (PCs) in SIMCA model and latent variables (LVs) in PLS-DA model was determined with the lowest root mean square error of cross-validation (RMSECV).
2.2. Extraction procedures
In this research, samples in the solution form were used for spectral acquisition. For this, an aqueous extraction procedure of the coffee samples was performed as described by Souto et al. [13]. First, 1.0 g of each sample was weighed and placed in a glass beaker. Then, adding 10 mL of distilled water at 90-
1234567890
International Symposium on Bioinformatics, Chemometrics and Metabolomics IOP Publishing IOP Conf. Series: Journal of Physics: Conf. Series 835 (2017) 012010 doi :10.1088/1742-6596/835/1/012010
2.3. Spectral measurement
UV-Vis spectra in the range of 200-400 nm were acquired by using a UV-Vis spectrometer
(Genesys™ 10S UV-Vis, Thermo Scientific, USA) equipped with a quartz cell with optical path of 10 mm, and spectral resolution of 1 nm at a room temperature. This is a dual beam spectrometer with sample and reference holder are separated each other. Before the measurements step, reference spectra was measured by putting 3 mL of distilled water. It was followed by sample measurement by putting 3 mL of coffee aqueous samples. The relative absorbance of each sample was calculated and then stored using USB flash disk.
2.4. Multivariate analysis using SIMCA and PLS-DA
All recorded spectra data were transferred to computer via USB flash disk and then convert the spectra data from .csv extension into an excel data (.xls). The original (raw) spectra were used for further analysis. For classification and discrimination, two different multivariate analyses were used, a SIMCA (based on PCA algorithm) and PLS-DA (based on PLS algorithm). The calculation of SIMCA and PLS-DA model was done using a multivariate analysis program The Unscrambler® version 9.8 (CAMO AS, Norway). Sensitivity (samples belonging to the class and classified correctly in this class) and specificity (samples not belonging to the modelled class and correctly classified as not belonging) were considered for the evaluation of the classification achieved with the multivariate methods [16]. The sensitivity and specificity were calculated according to equations:
where TP is the number of true positives, FN is false negatives, TN is true negatives and FP is false positives.
3. Results and discussions
3.1. Typical spectra of civet and non-civet coffee samples
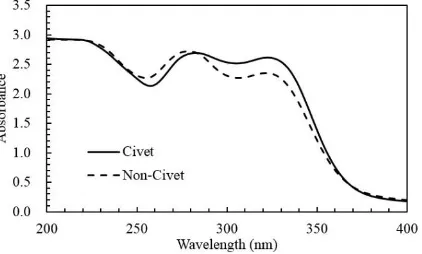
Figure 1 demonstrated a typical spectra of civet and non-civet coffee in the range 200-400 nm. It can be seen that spectra of civet and non-civet coffee are almost similar with the positive and negative peaks located at 260 nm, 280 nm, 310 nm and 325 nm. The sharp negative peak at 260 nm and the positive peak at 280 nm may be related with the absorbance of caffeine which is also reported by several previous reports [17], [18].
4
1234567890
International Symposium on Bioinformatics, Chemometrics and Metabolomics IOP Publishing IOP Conf. Series: Journal of Physics: Conf. Series 835 (2017) 012010 doi :10.1088/1742-6596/835/1/012010
3.2. Unsupervised discrimination using PCA
The unsupervised algorithm applied was principal component analysis (PCA). PCA analysis shows score plot of PC1 and PC2. Here we can see that the coffee samples can be clustered into two groups, civet (red marker) and non-civet coffee (blue marker) (as shown in Figure 2). The use of PC1 and PC2 can explain 98% of total variance in the coffee samples. Civet coffee is clustered in the right of PC1 while non-civet coffee is clustered on the left one. PCA results suggest that it is possible to discriminate between civet and non-civet coffee.
Figure 2. Score plot of PC1 and PC2 of coffee samples.
3.3. Supervised methods using SIMCA and PLS-DA
For SIMCA, each SIMCA model was developed for each corresponding class, civet and non-civet coffee using calibration samples in each class (30 samples for civet and 30 samples for non-civet, respectively). Using the developed SIMCA model, discrimination of prediction samples was applied and the result was presented in Table 1. All analysed samples were classified correctly in relation to sensitivity and specificity, with results of 100%.
Table 1. Discrimination results between civet and non-civet samples in prediction samples using the soft independent modelling of class analogy (SIMCA) method.
Spectral data Samples Classified correctly to proper class
Classified to none
Classified to both
Number of PCs in model
Original Civet 20 0 0 3
Non Civet 20 0 0 1
Total 40 0 0
Using PLS-DA, a calibration model based on PLS was developed using calibration sample set (in total 60 samples, 30 civet and 30 non-civet samples). In this PLS model, wavelengths (200-400 nm) are the predictors variable and type of coffee (civet or non-civet) is target or response variable. Since that type of coffee must be quantified in a numeric value, a dummy value for type of coffee was assigned with 1 = civet coffee and 2 = non-civet coffee. A threshold value of 0.5 is adopted, so that, if y is above this limit, the sample is assigned to class 2 (here, non-civet coffee), while if it is below, it is
1234567890
International Symposium on Bioinformatics, Chemometrics and Metabolomics IOP Publishing IOP Conf. Series: Journal of Physics: Conf. Series 835 (2017) 012010 doi :10.1088/1742-6596/835/1/012010
applied using prediction sample set (40 samples). The result was presented in Table 2. Similar to SIMCA prediction result, all samples are belongs to each proper corresponding class and resulted in 100% rate for sensitivity and specificity. This result shows that SIMCA and PLS-DA method could be effective to discriminate between civet and non-civet coffee.
Table 2. Discrimination results between civet and non-civet samples using the partial least square- chemometrics method to discriminate civet and non-civet coffee. The classification result using SIMCA and PLS-DA methods was satisfactory with sensitivity and specificity was 100%, respectively. This result can be used for developing a possible application of using UV-Visible spectroscopy and chemometrics method to establish a rapid and acceptable method for authentication of Indonesian civet coffee in the near future.
References
[1] Ruoff K, Luginbuhl W, Bogdanov S, Bosset J O, Estermann B, Ziolko T and Amado R 2006 J. Agric. Food Chem. 54 6867–72.
[7] Alamprese C, Casale M, Sinelli N, Lanteri S and Casiraghi E 2013 LWT - Food Sci. Technol.53
225–32. Proc. of the USR International Seminar on Food Security (Bandar Lampung: Universitas Lampung) pp 245–53.
[15] Suhandy D, Waluyo S, Sugianti C, Yulia M, Iriani R, Handayani F N and Apratiwi N 2016 Proc. of Seminar Nasional Tempe(Bandar Lampung: Universitas Lampung) pp 198–204. [16] Grasel F S and Ferrao M F 2016 Anal. Methods. 8 644–9.
[17] Belay A, Ture K, Redi M and Asfaw A 2008 Food Chem. 108 310–5.
6
1234567890
International Symposium on Bioinformatics, Chemometrics and Metabolomics IOP Publishing IOP Conf. Series: Journal of Physics: Conf. Series 835 (2017) 012010 doi :10.1088/1742-6596/835/1/012010
[19] Ståhle L and Wold S 1987 J. Chemom.1 185–96. [20] Barker M and Rayens W 2003 J. Chemom.17 166–73.
Acknowledgment