42
population and sample of the study, research instruments, data collection procedures, data analysis procedures, and techniques of data analysis.
A. Research Design
The study used counterbalanced design. A counterbalanced design,
another design that can be used with intact class groups. For example, the experimental class might use methods A and B, respectively, for the first half of the experiment class receives treatments in the order AB, and exchange method for the second half in the order BA. The distinctive feature of this design is that all subjects will receive all experimental treatments but in a different order. In effect, this design involves a series of replications; so at the end of the experiment group will expose to each X.71
It is an order in which treatment condition experienced are varied across subjects, so that treatment is experienced in each ordinal position by different sets of subjects. In this sense, the same student took two different measures in varied order. The data took from the same student on different tasks at a period of time.
71
Table 3.1
The scheme of counterbalanced design
Experimental Treatments
Session I Peer Correction Teacher Written Feedback Session II Teacher Written Feedback Peer Correction
The following table 3.1 showed a counterbalanced design used to compare the effects of two treatments on a dependent variable in different order. In the first session, the students received treatments in the order peer correction and teacher written feedback, and the second session treatments in the order teacher written feedback and peer correction.
B. Variables of the Study
1. The independent variables (X) of study were peer correction (X1) and teacher written feedback (X2).
2. The dependent variable (Y) of study was the student’s score on writing.
C. Population and Sample of the Study
Population is the larger group to which a researcher wishes to generalize72. In the present study, the population of the study was all the C class students of the third semester English department of STAIN Palangka Raya of 2014/2015 academic year. The number of population was 16 students. The population was the students who took Writing II course of third semester. Since the population was less than 100, the researcher took all
72
population as the sample of the study. Therefore, the study was called population research. The number of the subjects was 16 students. The researcher chose the C class as the sample of the study, because they took writing II, in which the narrative paragraph was taught.
D. Research Instruments
This part explained the test, as a research instrument to collect the data. It covered the test types, test construction, scoring rubric and test validity and reliability.
1. Test Type
The types of the test were to collect the data is in the form of writing test, especially writing paragraph and corrected by using teacher written feedback and peer correction techniques. The test consisted of the instructions/ directions and statements the subjects addressed in their writing and alternative topics to be chosen. In this sense, the students chose one topics that interest them. The researcher asked the students to develop the topic into paragraph about 200 to 250 words. The allocated time to do writing test was 100 minutes.
2. Test Construction
subjects were assign to write paragraph and corrected by using peer correction and teacher written feedback techniques. The results of the two tests were to measure used statistical analysis and the outcomes were compared to see the effect of using teacher written feedback and peer correction techniques on writing.
To obtain the appropriate writing test for the aims of the study, the researcher does some steps: (1) planning the writing test, (2) preparing the writing test, (3) trying out (pre testing) the test and analyzing the results, and (4) carrying out the test.
a. Planning the Writing test
To produce a good writing test, the researcher made a plan on the test construction. In this sense, the objective of giving the test was determined. The researcher decided the appropriate types of test. The test types and test objectives were very close. The test objective could not be achieved without having appropriate test types. The researcher cared for the adequacy of the content. The test content should match with the test types and objectives. Lastly, the time allocation for the test administration is planned as well as the instrument try out.
b. Preparing the writing test
simple. The instruction was accompany with several alternative topics were the ones the students knew and familiar and develop into compositions.
To construct the test directions, the researcher took into account the guidelines applied by Sabarun in Clouse as follows: (a) the question should be clear; (b) the question should be brief; (c) the instruction should be definite; (d) avoid questions requiring yes or no answer; (e) average students should be able to write average answer to the questions; (f) the vocabulary used and the concepts expressed in the topic should not be too difficult for the ordinary students to understand immediately; and (g) the instruction should provide an organizing principle for composition.73
The students’ task was to write a narrative paragraph. The writing instruction was design to measure the students’ writing paragraph ability. The students’ writing ability scored on the basis of the marking scheme that contains some features or components of writing, such as content, organization, sentence structure and
grammar, usage and mechanics of the students’ writing. The
proposed time allocation to do the writing test was 100 minutes.
c. Test Try Out
In order to prove the test is suitable to the students who are the sample of this study, the writer conducted a try out test. The writer
73
chose the students in different class to try out the test. The try out test conducted at the B class of the third semester students of English study program of STAIN Palangka Raya. The result was valid, it meant that the test item as the instrumentation of this study was suitable to be given.
3. Scoring Rubric
To assess the students’ writing product, there were three methods of
scoring for judging the students’ writing. These were holistic, primary trait, and analytic scoring. In the present study, the researcher used
analytic scoring method in evaluating the students’ final composition.
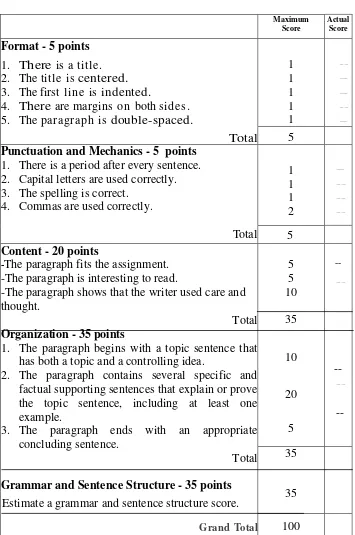
Table 3.2Scoring Rubric: Paragraphs74
Maximum Score
Actual Score
Format - 5 points
1. There is a title. 2. The title is centered. 3. The first line is indented.
4. There are margins on both sides.
5. The paragraph is double-spaced. Total 1 1 1 1 1 -- -- -- -- 5
Punctuation and Mechanics - 5 points
1. There is a period after every sentence. 2. Capital letters are used correctly. 3. The spelling is correct.
4. Commas are used correctly.
Total 1 1 1 2 -- -- -- 5
Content - 20 points
-The paragraph fits the assignment. -The paragraph is interesting to read.
-The paragraph shows that the writer used care and thought.
Total
Organization - 35 points
1. The paragraph begins with a topic sentence that has both a topic and a controlling idea.
2. The paragraph contains several specific and factual supporting sentences that explain or prove the topic sentence, including at least one example.
3. The paragraph ends with an appropriate concluding sentence.
Total
Grammar and Sentence Structure - 35 points
Estimate a grammar and sentence structure score.
Grand Total
5 5 10 35 10 20 5 -- ---- -- -- 35 35 100 74
4. Test Validity and Reliability
The validity of a test is the extent to which it measures what is supposed to measure and nothing else.75 The validity is classified into content, and face validity. In this study, the validation of instrument is mainly directed to the face and content validity, that was, to make the test items (contents) match with what is supposed to measure. Related to writing test, the test content validity can be checked by examining the agreement between objectives of the course and the test used to measure the objectives. Then, in terms of the face validity, the test assigned the students to write narrative paragraph.76
In this sense, there were some efforts to make the test construction and content valid (test validity). First, the researcher made the test be true measure. It meant that the test matched with what supposed to measure. Here, the test showed agreement between the test scores and objectives. Second, the researcher determined that the test types matched with the test objectives. After determining the test types, the researcher determined the test content suitable with the test. In this sense, the primary concern is focused on the topics of the paragraph. The topic selection was based on the objectives of the test, students’ background knowledge and interests.
75
John Brian.Heaton, Language Testing, New York: Longman, 1987, p. 159.
76
Afterwards, the writing test is constructed. It contained the directions that the students have to do the test. Then, the test try out is done to the students having the same characteristics with the subject of the study. It is done for improvement and clarification of the instructions. The revision of test instruction is made after having the test try out. Finally, the final form of writing test is done to the experiment class.
In addition, reliability is the accuracy of the measurement and the consistency of results.77 It is the degree of consistency with which it measures whatever it is measuring. In this case, to score composition as fairly and consistently as possible, the researcher used inter-rater method (test of reliability). Inter-rater reliability is the consistency of the judgment of several raters on how they see a phenomenon or interpret the responses of the subjects.
In this case, the two raters will be employed to score the students’
writing. The two raters were the researcher and the English teachers who have lot of experience in teaching English at English Department of STAIN Palangka Raya. One important thing in using the inter rater method in rating process is focused with the training of the raters. It can maximize the accuracy of the writing assessment. It made the raters be consistent in scoring and avoid subjectivity of the raters in scoring. For
77
this purpose, the training will done to get inter rater agreement in order to give reliable scores to students’ writing product.
5. Rater Reliability
Reliability refers to the consistency with which a test measured whatever it measured.78 In the present study, reliability of the writing test mainly focused on the rater reliability since the score are obtained from the judgment of two different raters. Here, the consistency in rating score
is very important in measuring the students’ writing skill. The
consistency can be achieved through rater training.
In rater reliability, there are inter rater and intra rater reliability. In the present study, the researcher used inter-rater reliability since the compositions are scored by two raters. In addition, there were some procedures to measure an estimate of test reliability: test retest, parallel, split half, Kuder-Richardson (K-R 20 and K-R 21), and rater reliability. To achieve the acceptable score of inter rater reliability, the raters are trained. First, the researcher explained the purposes of the test and intended used of the test results to the rater. Then each point of the criteria used to score is explained.
After that, the rater got same understanding of criteria, the researcher gave the rater two composition samples to be rated. The scores of two raters from the researcher and the rater were correlated to examine whether the scores belong to acceptable scores or not. To obtain
78
inter- rater reliability, the score of two raters were correlated using SPPS program used product moment calculation. The researcher got the interpretation of coefficient correlation, whether they belong to high, moderate, or positive weak/ negative inter rater reliability category. The
obtained coefficient should indicate that the students’ writing products both peer correction and teacher written feedback has achieved the acceptable level of reliability. In this case, the researcher will apply the coefficient correlation and the interpretation of inter-rater reliability proposed by Winkle et al as shown in table 3.3.79
Table 3.3. Inter Rater Coefficient Correlation and Interpretation
Correlation Coefficient Interpretation
.90 to 1.00 or -.90 to -1.00 Very high positive or negative correlation
.70 to .89 or -.70- to -.89 High positive or negative correlation .50 to .69 or -.50 to -.69 Moderate positive or negative correlation .30 to .49 or -.30 to -.49 Low positive or negative correlation .00 to .29 or -.00 to -.29 Little if any correlation
E. Data Collection Procedures
The study is aimed at investigating the effectiveness of giving peer correction and teacher written feedback techniques on the quality of composition written by experimental group of students. The data for this study collected through pre-test and post-test design. The pretest conducted in the first meeting of the research.
79
The researcher gave short explanation on the purpose of the study and the way to carry out. In the present study, the experiment class received all treatments, but in different order. In this case, the subjects gave opportunity about 100 minutes to do the test covered the three stages of writing: prewriting, whilst writing and post writing. The paragraph to write was about 200 to 250 words. In the first season, the students received treatments in the order peer correction and teacher written feedback, and the second season treatments in the order teacher written feedback and peer correction. The teacher asked the students re-write their writing based on the teacher’s correction and peer correction. After that, the teacher gave the score based on the students writing assessment. The posttest conducted in the final meeting of the research. The test minister at the same time was 100 minutes.
F. Data Analysis Procedures
Figure 1. Data Analysis Procedures
G. Techniques of Data Analysis
a. Normality Test
It is used to know the normality of the data that is going to be analyzed whether both groups have normal distribution or not.
Writing Product Writing Narrative
Paragraph Peer Correction-
Teacher Written Feedback
Teacher Written Feedback- Peer
Correction Writing Class
Peer Correction- Teacher Written
Feedback
Scoring
Teacher Written Feedback- Peer
Correction
Measuring Normality and Homogeneity
Testing Hypothesis Using ANOVA and Discussion
Kolmogorov–Smirnov test (K–S test) is a nonparametric test for the equality of continuous, one-dimensional probability distributions that can be used to compare a sample with a reference probability distribution (one-sample K–S test), or to compare two samples (two-sample K–S test). 80 One sample Kolmogorov–Smirnov test is used here. In addition, the SPSS program will be applied.
b. Homogeneity Test
Homogeneity test was conducted to know whether data are homogeneous or not. Levene's test assesses this assumption. It tests the null hypothesis that the population variances are equal (called homogeneity of variance or homoscedasticity). The data are homogeneous if the significant value is higher than significance level α= 0.05.. Thus, the null hypothesis of equal variances is rejected and it is concluded that there is a difference between the variances in the population.81 In addition, the SPSS program will be applied.
c. Two-way Repeated Measures Analysis of Variance
The problems of the study:
a. Is there any significant effect of peer correction on students’ paragraph writing ability at the third semester students of English Study Program of STAIN Palangka Raya?
80
http://www.princeton.edu/~achaney/tmve/wiki100k/docs/KolmogorovSmirnov_test.html. (Accessed on September 10, 2014)
81
b. Is there any significant effect of teacher written feedback on students’ paragraph writing ability at the third semester students of English Study Program of STAIN Palangka Raya?
c. Are there any significant effects of peer correction and teacher
written feedback on students’ paragraph writing ability at the third semester students of English Study Program of STAIN Palangka Raya?
To answer the research problems, the researcher applied the ANOVA statistical calculation. The steps are as follows:82
a. The total sum of squares
SSt= ∑X2t– ∑ Where
SSt = sum of square total
∑X2
= each score squared, then summed
(∑Xt)2 = all the scores summed first, then this sum squared N = number of scores
b. The sum of squares between groups83
SSb = ∑ + ∑ - ∑ c. The sum of squares within groups
SSw = SSt - SSb d. The between-columns sum of squares
82
Donald Ary, Lucy Cheser Jacobs, Chris Sorensen and Asghar Razavieh, Introduction to Research in Education (Eight Edition), United States: Wadsworth Cengage Learning, 2010, p.180
83
SSbc = ∑
+
∑
-
∑
e. The between-rows sum of squares SSbr = ∑
+
∑
-
∑
f. The sum of squares interaction
SSint = SSb – (SSbc + SSbr)
g. Determine the number of degrees of freedom associated with each source of variation. They are found as follows:84
df for between-columns sum of squares = C − 1 df for between-rows sum of squares = R − 1 df for interaction = (C − 1)(R − 1)
df for between-groups sum of squares = G − 1 df for within-groups sum of squares = N − G df for total sum of squares = N − 1
Where:
C = number of columns R = number of rows G = number of groups
N = number of subjects in all groups
h. The mean square values by dividing each sum of squares by its associated number of degrees of freedom.
i. Compute the F ratios for the main and the interaction effects by
84