Analysis of Social, Technological, and Environmental Factor concern to Urban Flood : Case Study : Bumi Tamalanrea Permai Residence Makassar
Umar Diwarman Eisenring
Magister Programme of Urban and Regional Planning Bosowa University Makassar E-mail: [email protected]
Abstract
The main purpose of this research is to know the influence of social, technology, and environmental factor concerning to Urban Flood . The location of this research is Bumi Tamalanrea Permai Residence, which is one of many flooding spots at Makassar that is classified as “High Flooding Area”. Besides, this research started from grand theory that was found by Mustafa at 2005 named Hazardscape Theory. Based on Mustafa’s research at 2005 that was located at South of India,Hazardscape theory said that Urban flood is caused by 3 (three) factors, social, technology, and environment. At this research, the researcher tried to examine the enforceability of Hazardscape Theory at Bumi Tamalanrea Permai Residence, Makassar. There were also some indicators that was used to research those 3 (three) factors that was related to Urban flooding at research location. Society’s behaviour, Developer’s behaviour, Participation of society to protect the environment, and also the role of goverment became the indicators of social factors. While, to rate the technology factors, the researcher used the condition of drainage channels, and road as the indicators. And for analyze the environmental factor, the researcher used the quantity of green open space, and also elevation level as the indicators. Based on the research of those indicators, the condition of drainage channels, Elevation Level, and the less quantity of green open space became the most influencial factors concerning to Urban flood that was happened at Bumi Tamalanrea Permai Residence.
Keywords: Urban flood, Social factor, Technology factor, Environment Factor , Hazardscape, Bumi
Tamalanrea Permai
INTRODUCTION
Makassar and the reseacrh location, Bumi Tamalanrea Permai Residence was included as one of those floodplain spots. The three factors that was mentioned at Hazardscape Theory, will be examined the enforcabilty at research location, Bumi Tamalanrea Permai. Those 3 (three) factors also become the main purpose of this research to show enforceability of Hazardscape theory. Society’s behaviour, Developer’s behaviour, Participation of society to protect the environment, and also the role of goverment became the indicators of social factors. While, to rate the technology factors, the researcher used the condition of drainage channels, and road as the indicators. And for analyze the environmental factor, the researcher used the quantity of green open space, and also elevation level as the indicators. Based on the research of those indicators, the condition of drainage channels, Elevation Level, and the less quantity of green open space became the most influencial factors concerning to Urban flood that was happened at Bumi Tamalanrea Permai Residence.
RESEARCH METODOLOGY
The type of research that was used on this research is quantitative research. Quantity research was used because this research needs statistic analyzis to examine influence level between social, technological, and environmental factors concerning to urban flood at research location, Bumi Tamalanrea Permai Residence Makassar. This research was carried out since November until Desember.
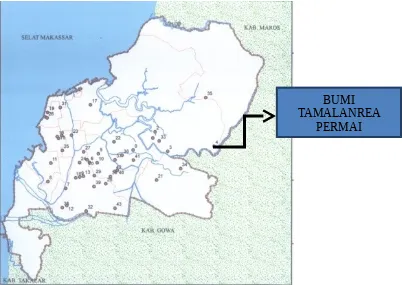
Figure 1. Map of Makassar City and Research Location (Source : Departement of state for Public Works)
Bumi Tamalanrea Permai is choosen as research location, based on consideration that Bumi Tamalanrea Permai is one of floodplains that is categorized as highest flood intensity area.
On this research there was some data that was needed to analyze the factors that is mentioned before. Flood intensity data will be the dependent variable of this research. Flood Intensity data was taken from the spreading of quetioner that aimed to population of Bumi Tamalanrea Residence. The data of population’s perception concerning to their behavior to the environmental hygiene, the data of development’s behavior, the data of population’s perception concerning to the role of the government and also the participation level
BUMI
TAMALANREA
of the regional population to clean up the environment become the independent variables that would be related with the dependent variable. To process each data that were taken, the researcher used likert scale to rate the level for each data. After that, to relate the influence between dependent variable and independent variable that was mentioned before, the researcher used Spearman’s Corelation Test.
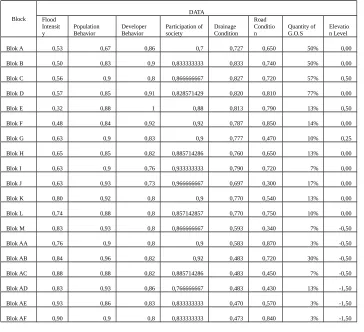
This table below shows the collection of Dependent’s Variable and Independent Variable Data.
Table 1 Collection of Research Data
Block Flood DATA
Intensit
y Population Behavior Developer Behavior Participation ofsociety Drainage Condition Road Conditio
n Quantity of G.O.S Elevation Level
Blok A 0,53 0,67 0,86 0,7 0,727 0,650 50% 0,00
Blok B 0,50 0,83 0,9 0,833333333 0,833 0,740 50% 0,00 Blok C 0,56 0,9 0,8 0,866666667 0,827 0,720 57% 0,50 Blok D 0,57 0,85 0,91 0,828571429 0,820 0,810 77% 0,00
Blok E 0,32 0,88 1 0,88 0,813 0,790 13% 0,50
Blok F 0,48 0,84 0,92 0,92 0,787 0,850 14% 0,00
Blok G 0,63 0,9 0,83 0,9 0,777 0,470 10% 0,25
Blok H 0,65 0,85 0,82 0,885714286 0,760 0,650 13% 0,00 Blok I 0,63 0,9 0,76 0,933333333 0,790 0,720 7% 0,00 Blok J 0,63 0,93 0,73 0,966666667 0,697 0,300 17% 0,00
Blok K 0,80 0,92 0,8 0,9 0,770 0,540 13% 0,00
Blok L 0,74 0,88 0,8 0,857142857 0,770 0,750 10% 0,00 Blok M 0,83 0,93 0,8 0,866666667 0,593 0,340 7% -0,50
Blok AA 0,76 0,9 0,8 0,9 0,583 0,870 3% -0,50
Blok AB 0,84 0,96 0,82 0,92 0,483 0,720 30% -0,50 Blok AC 0,88 0,88 0,82 0,885714286 0,483 0,450 7% -0,50 Blok AD 0,83 0,93 0,86 0,766666667 0,483 0,430 13% -1,50 Blok AE 0,93 0,86 0,83 0,833333333 0,470 0,570 3% -1,50 Blok AF 0,90 0,9 0,8 0,833333333 0,473 0,840 3% -1,50
Table 2. Data Source and Data Analyzis
Flood Source Quitioner Quitioner Quitioner Quitioner Observation Obseravtion
Departement
Analyze LikertScale Likert Scale Likert Scale Likert Scale
Departement
concern Urban flood. The behaviour of its own society, developer, participation, and role of government became the indicators to show that social factor was the cause flooding. The condition of drainage channel and also road became the indicators to prove that technological factor was the cause flooding. While, to rate the environmental factors, researcher used elvation level, and quantity of green open space as the indicators. After all od data were collected, it could be connected with the independent variable. To show the level of influence of those 3 factors concern to Flood Intensity, Spearman Coreelation Test will be used to see the level of influence for every indicators .
Society’s behaviour concern to garbage disposal
To understand the influence level of this indicator concern to flood intensity at Bumi Tamalanrea Permai Residence, then used Spearman Correlation Test to decide the level of influence of this indicator. This table below show about the result of Speaman Correlation Test beetween society’s behaviour concern to garbage disposal and intensity of flood at Bumi Tamalanrea Permai Residence.
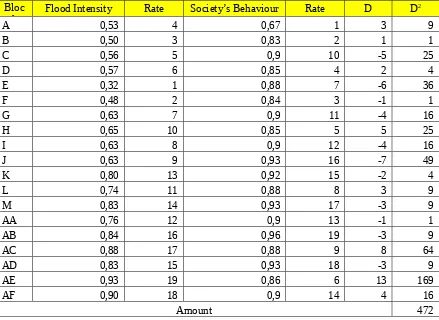
Tabel 4. The Result of Spearman Corelation Test between society’s behaviour concern to garbage disposal and intensity of flood at Bumi Tamalanrea Permai Residence.
Bloc
k Flood Intensity Rate Society’s Behaviour Rate D D
2
Based on the table above, total value of D2 is 472, base on the formula of Spearman Correlation Test, than:
Rs = 58, 6 %
Based on the result of Spearman Corelation above, the influence level of Society’s behaviour concern to garbage disposal and flood intensity were categorized ”strong enough”
Developer’s Behaviour
To understand the influence level of this indicator concern to flood intensity at Bumi Tamalanrea Permai Residence, then used Spearman Correlation Test to decide the level of influence beetween Developer’s behaviour and intensity of flood at Bumi Tamalanrea Permai Residence. Like Corelation Test which is used on the previous indicator, total value of D2 is 530, based on the formula of
Spearman Correlation Test, than:
Rs = 1-(6 x 530) 19(192-1)
Rs = 53,51%
Based on the result of Spearman Corelation above, the influence level of Developer’s behaviour and intensity of flood at Bumi Tamalanrea Permai Residence were categorized ”strong enough”
The Participation Level of Society to Protect the Environment
To understand the influence level of this indicator concern to flood intensity at Bumi Tamalanrea Permai Residence, then used Spearman Correlation Test to decide the level of influence beetween the participation level of society to protect the environment and intensity of flood at Bumi Tamalanrea Permai Residence. Like Corelation Test which is used on the previous indicator, total value of D2 is 1067,
based on the formula of Spearman Correlation Test, than:
Rs = 1-(6 x 1067) 19(192-1)
Rs = 6,40%
Based on the result of Spearman Corelation above, the influence level of the participation level of society to protect the environment and intensity of flood at Bumi Tamalanrea Permai Residence were categorized ”very weak”
Government Involvement
To understand the influence level of this indicator concern to flood intensity at Bumi Tamalanrea Permai Residence, then used Spearman Correlation Test to decide the level of influence beetween Government involvement and intensity of flood at Bumi Tamalanrea Permai Residence. Like Corelation Test which is used on the previous indicator, total value of D2 is 184, based on the formula of
Spearman Correlation Test, than:
19(192-1)
Rs = 84%
Based on the result of Spearman Corelation above, the influence level of Government involvement and intensity of flood at Bumi Tamalanrea Permai Residence were categorized ”very strong”
The Condition of Drainage Channel
After using observation and the analysis by using Departement of state for public works rate standard for every drainage channel for each blocks. The Data that was found were connected with the data of flood intensity by using Spearman Corelation Test. Like Corelation Test which is used on the previous indicator, total value of D2 is 154, based on the formula of Spearman Correlation Test, than:
Rs = 1-(6 x 154) 19(192-1)
Rs = 86%
Based on the result of Spearman Corelation above, the influence level of the condition of drainage channel and intensity of flood at Bumi Tamalanrea Permai Residence were categorized ”very strong”.
Road Condition
After using observation and the analysis by using Road Condition Index (RCI) for every road for each blocks. The Data that was found were connected with the data of flood intensity by using Spearman Corelation Test. Like Corelation Test which is used on the previous indicator, total value of D2 is 760,
based on the formula of Spearman Correlation Test, than:
Rs = 1-(6 x 760) 19(192-1)
Rs = 33%
Based on the result of Spearman Corelation above, the influence level of the condition of road and intensity of flood at Bumi Tamalanrea Permai Residence were categorized ”weak”.
The Quantity of Green Open Space
To seize the influence level of this indicator concern to flood intensity at Bumi Tamalanrea Permai Residence, then used Spearman Correlation Test to decide the level of influence beetween the quantity of green open space and intensity of flood at Bumi Tamalanrea Permai Residence. Like Corelation Test which is used on the previous indicator, total value of D2 is 362, based on the formula of
Spearman Correlation Test, than: :
Rs = 1-(6 x 362) 19(192-1)
Rs = 68 %
Elevation Level
To seize the influence level of this indicator concern to flood intensity at Bumi Tamalanrea Permai Residence, then used Spearman Correlation Test to decide the level of influence beetween the elevation level and intensity of flood at Bumi Tamalanrea Permai Residence. Like Corelation Test which is used on the previous indicator, total value of D2 is 256, based on the formula of Spearman
Correlation Test, than:
Rs = 1-(6 x 256) 19(192-1)
Rs = 78 %
Based on the result of Spearman Corelation above, the influence level of the elevation level and intensity of flood at Bumi Tamalanrea Permai Residence were categorized ”strong”.
Dari analisa ketiga faktor di atas beserta indikator-indikatornya maka dapat disimpulkan dalam bentuk tabel berikut ini:
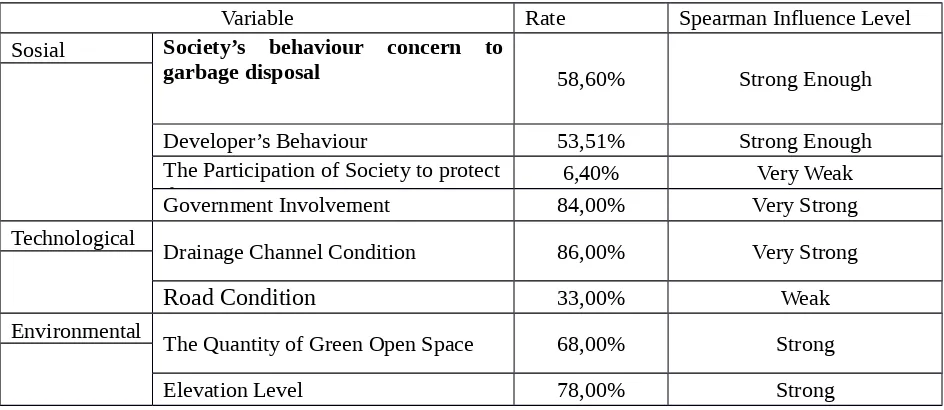
Tabel 5. The influence level of each indicators concern to Urban Flood at Bumi Tamalanrea Residence, Makassar
Variable Rate Spearman Influence Level
Sosial Society’s behaviour concern to
garbage disposal 58,60% Strong Enough
Developer’s Behaviour 53,51% Strong Enough
The Participation of Society to protect
the environment 6,40% Very Weak
Government Involvement 84,00% Very Strong
Technological
Drainage Channel Condition 86,00% Very Strong
Road Condition
33,00% WeakEnvironmental The Quantity of Green Open Space 68,00% Strong
Elevation Level 78,00% Strong
Based on the table above could be understood that Environmental factos, Elevation Level and the quantity of green open space were the factors that had the strongest influence. Which is why it can be said that, based on the result of this research, the less of green open space quantity that became the water catchment area to decrease the overflow of water on land. Those things also caused the drainage channel at BTP Residence ove flew and made Bumi Tamalanrea Permai Residence always experienced the puddle more than eight hours.
CONCLUSION
Based on the research that is conducted, then it can be concluded :
behavior concern to garbage disposal, developer’s behavior, the participation of society concern to protect the environment, and government involvement had their own influence level. Government Involvement, based on Spearman Correlation Test had a stronger influence than the others. 2. Technology Factor also had influenced concern to urban flood of BTP Residence. That was
supported by the variable that was analyzed quantitavely. The condition of drainage channel and condition of road had their own influence level. Based on, the Spearman Corelation Test, Condition of Drainage Channel had the strongest influence
3. Environmental Factor also had influenced concern to urban flood of BTP Residence. That was supported by the variable that was analyzed quantitavely. The quantity of green open space and elevation level had their own influence level. Both of them were categorized as strong influence.
REFERENCES