INSTITUTIONAL AND SPATIAL EFFECTS ON MANUFACTURING
PERFORMANCE IN CENTRAL JAVA PROVINCE: THE NEW
INSTITUTIONAL ECONOMICS AND THE NEW
ECONOMIC GEOGRAPHY PERSPECTIVE
Abdul Aziz Ahmad
Universitas Jenderal Soedirman Faculty of Economics and Business ([email protected])
Prasetyo Soepono
Faculty of Economics and Business Universitas Gadjah Mada
Wihana Kirana Jaya
Faculty of Economics and Business Universitas Gadjah Mada ([email protected])
ABSTRACT
In the economic view, the manufacturing sector is important in relationship to its role in eco-nomic growth and the whole economy. This empirical work examines why manufacturing dis-parity exists, and what institutional and spatial factors empirically have an important effect on the manufacturing sector development in Central Java Province, Indonesia. The variables that are identified that have an influence on the manufacturing performance are ethno linguistic, legal rules, bureaucratic financial performance, democracy, city fascination, regional location index, the manufacturing base, infrastructure, the labor force, the intermediary finance institu-tion and the types of regional administrainstitu-tion (regency and city). To analyze it, this research uses the spatial econometric method on its methodological analyses. It is used to reduce the potential problem that arose in the cross section and panel data which had spatial interaction, and spatial structure. This empirical work shows that all of the institutional variables have positive and significant effects on the dependent variable. The other result is that every spatial variable also tends to have a positive and significant impact on manufacturing development. For economic policy, labor activity, the roles of financial intermediaries and infrastructure variables also have a positive effect on the manufacturing development.
Keywords: manufacturing disparity, spatial econometrics, institutional, ethno linguistic,
regional location index
INTRODUCTION
The neo-classic growth model explains that some countries are poorer than other countries because of the accumulation differences of their production factors, endowment, technology and preference (Hoff & Stiglitz, 2001: 389-390), and also by endogenous innovation (Verspagen, 1992) particularly on knowledge accumulation formation (Grossman & Helpman, 1994). The innovation is important because it generates a spillover effect among countries (Cameron, 1998; Glaeser et al., 1992).
correctly why the economic performance among countries differs (Perry & Schonerwald, 2009).
Some economists declare that institution can be an important factor that affects economic growth (Aron, 2000). Claeys (2009) in their research conclude that better institution will promote economic development. Another em-pirical work shows that better democracy will be pre-condition to development sustainability (Anderson & Hugins, 2003).
The role of institution in economic perform-ance came to prominence after the emergence of the New Institutional Economics (NIE) theory. Oliver Williamson first expounded this theory in 1975 and the interest in the theory increased widely in the era of the 1980’s. Williamson (2000) declared the proposition that institutions do matter to show how important institution was in economic development. Klein (1999) empha-sized that NIE is an inter-disciplinary science which includes economics, law, organization theory, political science, sociology and anthro-pology all of which are useful to understand so-cial and political phenomena, and the business environment. Coase (1998) showed that NIE’s role is important in detecting economic perform-ance, because it considers the effect of the law and judiciary system, the political and social system, education and culture on the economic environment.
Although many empirical works show the role of institutions in the development process, these institutionalism views are without criti-cism. In many research fields, NIE was claimed has not answered questions like which substan-tive institutions that function effecsubstan-tively to eco-nomic development, and also why a few coun-ties only that able to sustain the rules and norms that encourage economic growth (Shirley, 2005).
Beside the institution factors, new empirical progress shows that economies tend to be af-fected by their location factor. Unanimously, the newest global economic performance is pushed by city growth and regional competition, not by countries’ competition (Beer & Kearins, 2004). The regional economic progress encourages an agglomeration and polarization process that ac-cumulates naturally (Higgins & Savoie, 1995).
The last new concept was developed by Krugman in his New Economic Geography (NEG) theory. He (Krugman, 1998) stressed the importance of geography to development. Gen-erally, the theory stresses concentration and spe-cialization with competitive advantage among regions. The approach of the theory is based on competition in every region and the economic development will be created by growth and con-centration (Gartner, 2001). It is focused on the relationship between transportation cost, ag-glomeration and regional disequilibrium (Puga, 2001). The theory also differs between centripe-tal aspect that forms agglomeration economies and centrifugal aspect that push de-agglomera-tion economic process (LaLiberte, 2009).
Related to the importance of the manufac-turing role, this empirical work examines why manufacturing disparities exist on research loca-tion, and what institutional and spatial factors empirically have an important effect on the manufacturing sector development. The location of this research is focused in Central Java Prov-ince, Indonesia. The consideration of the choice of location is that the manufacturing industries in Central Java provide the biggest economic con-tribution to the province, despite the trend of deindustrialization in some of the regencies (Suhardi & Kuncoro, 2013) and related also to the manufacturing disparity among regions in Central Java Province.
This research seeks to understand why manufacturing industries tend to polarize to cer-tain regions in Central Java Province. It looks to analyze some of the factors that affect manufac-turing development. The purposes of this re-search are: (1)To determine how strongly some institutional factors (bureaucratic financial per-formance, ethno linguistic, law enforcement, and democracy) affect the manufacturing sector in regencies/cities in Central Java Province; (2) To analyze the impact of the geographic aspect (city fascination, regional location index, and form of regional administration) on the manufacturing sector in regencies/cities in Central Java Prov-ince; and (3) To measure the impact of the eco-nomic policy factors (infrastructure, labor activ-ity, and financial activity) on the manufacturing sector in regencies/cities in Central Java Prov-ince.
ANALYTICAL FRAMEWORK
The object of this research is manufacturing development. In the economic view, the manu-facturing sector’s importance is related to its role in economic growth and the whole economy (Szirmai, 2009). Specifically, the problem emerging from the manufacturing sector is that encouraging regions to increase their manufac-turing performance has affected regional dis-parities. To analyze it, the first theoretical back-ground is from the institutional aspect, which is the New Institutional Economics (NIE) theory. The second theory is the New Economic Geog-raphy (NEG) theory. These theories will be ap-plied to this research to give empirical evidence and to support quantitative causality analyses.
In the New Institutional Economics theory, Jaya (2010) claimed that the theory covered to comprehensive aspects: include market and non-market perspectives, formal and informal sides, and also appropriate to apply in the real world. In detail, Williamson had divided some stages of the institution into 4 levels: embeddness, institu-tional environment, governance, and also re-source allocation and employment. Related to this empirical research, some institutional vari-ables that are important to push the development process are political bureaucracy (Net &
Swedberg, 2005; Dorward, et al., 2005), ethno linguistic (Fearon, 2003; Engerman, 2005;), law enforcement and the judiciary system (Brunt, 2007; Furubot & Richter, 2008), and democracy (Luckham, et al., 2001; Chang, 2010).
The second theory perspective is the New Economic Geography. Scott (2004) declared that the New Economic Geography (NEG) has made an important contribution to economics. The theory emphasized on the issues of when the spatial concentration from economic activities will happen, and when the symmetric equilib-rium of spatial un-concentrated will be unstable (Fujita, et al., 1999). Kilkenny (1998) viewed the prototype of NEG as including two regions where each region would concentrate on farming and manufacturing industry, and two factors of production where farmers and manufacturing labor are involved. In this case, manufacturing is the subject of an increasing return to sale. The NEG established that spatial configuration for every economic activity was the impact of con-flicting actions: centripetal forces and centrifugal forces (Bekele & Jackson, 2006). According to Krugman (1998) the type of centripetal forces in spatial concentration are characterized by market scale (linkage effect), a dense labor market, and the push of positive economic activities (like information spillover). While centrifugal forces have some characteristics like production factors that are immobile, land rent, and negative eco-nomic externalities (Brakman, 2005). It was driven by the high costs from the centrifugal forces that have impacted on the de-urbanization process, and generated new cities that will be the new growth areas (Anas, 2002).
eco-nomic growth of the area. Dawkins (2003) stressed that the labor market is important re-lated to its function as a source of labor for firms and this labor also has a role as a market for the output of the firm. Another policy is related to the financial sector. WEF (2012) reported that the financial intermediation institution provided benefits to consumers and firms. Other empirical works, Garzón and Galvis (2005) proved how important the role of the financial intermediation sector is.
Data and Variables Measurement
This research covers to panel data. It in-cludes 35 regions in Central Java Province and over the time period of 2000-2009.
For the definition, the common measurement of economic performance is Gross Domestic Product (GDP). Although it is not exactly accu-rate in determining general economic welfare, GDP is important to evaluate economic progress and it contains the sine qua non condition. In this research, the measurement of the manufac-turing performance is determined by its Regional GDP value’s in manufacturing sector.
To detect if any factor changes manufactur-ing sector performance, three factors are used, these are institutional, spatial, and economic policy factors. North (1997) defined the institu-tion as a bundle of constraints that characterized formal (rule, law and constitution) and informal (norm, custom, behavior, or convention), on human beings that determined the structure of human interaction, encouraged the emergence of specific social characteristics, and formed the structure of incentives in society. Jaya (2010) defined that institutional economics referred to formal and informal rules in economic transac-tions, in the micro or macro environment. The theory could be applied in any organization, market, firm, or government (Furubotn & Richter, 1993). In this research, the institutional variables are used to prove the existence of the New Institutional Economics Theory in the real world. The variables that are chosen are ethno linguistic, bureaucratic financial performance, rule of law, and democracy.
Other factors that determined manufacturing performance are spatial and economic policy factors. In the New Economic Geographic (NEG) perspective, Fujita, et al. (1999) declared that an important question in geographic nomics is when the spatial concentration of eco-nomic activity would be formed and how the benefit of such economic activity could be gen-erated in the concentration. The manufacturing economic concentration can be detected from many factors. In this research, some variables that are determined to be spatial factors are manufacturing base, city fascination, vocational index, and the type of regency administration. The last factor is economic policy. It is deter-mined by infrastructure, labor force, and the in-termediary finance institution. Measurements of each independent variable are:
1. Ethno linguistic refers to ethnic differences. To determine the measurement, Feron (2003) declared the Ethno Linguistic Frac-tional (ELF) concept to count ethnic differ-entiation. In reference to Feron (2003), the ethno linguistic factor in this research is measured by the proportion of non-majority ethnic and majority ethnic of people. The coefficient of regression parameter should be in the positive to show how the extent of ethnic diversity tends to push manufacturing in a region.
2. The rule of law variable is related to current law system. The proxy of the institutional variable is reflected in the time performance of the judicial system in deciding private and public law cases, and the number of agents who are involved in the judiciary system.
in-come, the ability of local government to generate local income, and the effectiveness of budget allocation programs.
4. Democracy is the freedom of public expres-sion and organization (Luckham, et al., 2001). In this research democracy can be counted by the ratio of the number of formal public organizations compared to citizen numbers.
5. In referring to O’Sullivan (2003), city fasci-nation variable means any facilities and business that offer appropriate location to economic transaction. It is also play role as supply center of good production and related servicing, that is more efficient than other region, and supply to labor employment on learning and innovating process. Trend of positive urbanization in a region shows that the city is more fascinate than other city.
6. Regional Location Index is important to show how any industry that wants to operate in an effective and efficient manner will re-quire access to material resources, markets, and other service centers. Each region i gen-erally will be surrounded by many industrial centres. The impact of the centers j of in-dustry on the region i is expressed by the Region’s Location Multiplier (LOCMij). The total impact of all the centres is defined by Gaki et al.(2006) in the formula:
n ji
ij
i LOCM
LOCM
(1)
The regional location index consists of the Size Index of centre j (SIj) and the accessi-bility index (AIij) from region i to centre j. 7. The manufacturing base is referred to the
Location Quotient, that is defined by the share of the manufacturing sector in a region compared to the manufacturing sector on its reference location. In this research, the Lo-cation Quotient Index (LQ) uses symmetric measurement. Ahmad (2013) defined the symmetric Location Quotient (SymLQ) as being determined by the formula:
SymLQ = (LQsi – 1) / (LQsi + 1) (2)
8. An infrastructure is the availability of any materials, institution, and data, to an eco-nomic agent, that gives a contribution to re-muneration which is appropriate to its pro-portional resource allocation, and can create any economic activity in a perfect integrated level (Torrisi, 2009). Referring to Amos (2007) and Soepono’s (1998) model, the in-frastructure variable can be detected by the density level of highways or streets in its region.
9. The labor force refers to the main activity of people of working age for a certain period. The Center of Statistic Bureau (2007) de-fines the labor force as all people of working age that actually work, or have previously held a job, but are now unemployed for awhile.
10. The intermediatery finance institution in this research refers to any banking activity that encourages the development of the manu-facturing sector and is identified by its fi-nancing to produce productive outcomes.
Spatial Econometrics
This research uses the spatial econometric method for its methodological analyses. The main idea of the model is to add spatial weight-ing to the model. The econometric modelweight-ing with spatial weighting initially had been started in 1971 in Fisher’s research that detected spatial dependence on cross-sectional data. Nonetheless the trend of spatial model development tended to move slowly. After last of 1990’s, spatial aspects has had been important notice, and the spatial econometric has been developed as important econometric modeling tool (Anselin, 2006).
differ-ence between spatial and a-spatial models that included up to 57.647 observations of US prop-erty prices, and also Black, et al. (2006) who used spatial econometric modeling to predict the movement of export products.
Methodology of spatial econometrics should be applied in the cross section analyses model. The economics modeling will be different to traditional econometric models. It is related to problems that emerge if the data have location components. There are the spatial inter depend-ency among data observed and the spatial het-erogeneity in model (LeSage, 1999)
Anselin (1999) stated that the spatial econo-metric model can be used as a method to reduce the potential problem that arises in cross section and panel data which has spatial interaction (or spatial autocorrelation), and spatial structure (or spatial heterogeneity). Because the traditional econometric model neglected the issues; it is in defiance of Gausmarkov assumption in his re-gression model.
Spatial dependencies in observed sample data were related to the reality that an observa-tion in i location will relate to j other location, j i, or formally:
yi = f (yj) , i = 1, ..., n j i
There are two reasons why data observed from a point of location will depend on the value of the other location. First, data collected that relates to a spatial unit may contain faults in measurement. It will happen if the data does not represent the natural characteristics of the population. Second, the spatial dimension of social-demographic ac-tivity will be an important aspect in modeling. It relates to the regional economics premise that location and distance are crucial factors in the geographic activity of humans and markets.
On the spatial heterogeneity problem, it re-lates to variations in space. Formally, the linier relationship can be formed;
Yi = Xiβi +εi
where, I refers to observation in space i = 1,…, n. Xi refers to a vector of independent variable (1 x k) that relates to a set of β, parameter. Yi is a
dependent variable in i location and εi is sto-chastic disturbance of the linier relationship.
For each i observation, the relationship will form a function of:
yi = f(Xii + i) (3) The spatial econometric modeling may need geographic data or Geographic Information System (GIS) data. Other approach modeling is using spatial location that is determined by its latitude and longitude coordinates. The spatial model can also use the approach of the contigu-ity matrix. In this empirical research, the weighted spatial data uses spatial location for each region that has had its latitudinal and longitudinal coordinates and also its contiguity established.
informa-tion is shows by the Z matrix which includes each element of Zxi, Zyi , and i for 1…n represent the latitude and longitude coordinates for each observation. Estimated parameter is o which include x ,y that present a complete set of 2k parameter. The vector of parameter in nk x 1 matrix consists to all k independent variable to each observation. The vector of 0 consists to 2k parameter.
The model can be estimated by least square estimation to produce an estimation of 2k pa-rameter, x ,y. It is called the expansion process. To examine it, the second equation must be sub-stituted into the first equation and results in:
y = XJ 0 + e (8) In the new equation, X, Z and J show the in-formation observed and 0 only which is the pa-rameter in the model which should be estimated.
Related to use of spatial panel data in the model, the model without spatial interaction will form:
yit = xit + i + it (9) where, i is an index to cross-sectional dimen sion, with i = 1, ... , N, and t is time series index with t = 1, ..., T. While, y it is independent observed data in i space and t time, and is (K,1) vector for each parameter counted. it is the disturbance effect that distribute independently to y and identically to each i space and t time, with average of 2 is zero, and i is specific spatial effect (Elhorst, 2010).
In the spatial lag modeling, where the de-pendent variable is depended to observed data from other location, the characteristic of the model can be formed by;
it
Where is the spatial autoregressive spatial coefficient and wij is the weighted spatial ele-ment in W matrix that describes spatial condition of the sample unit.
In the randomly coefficient spatial panel data model, Elhorst (2010) formed the general model in equation;
The equation needs minimum observation for each spatial unit as much (K + 1). The trans-formation of the model to full matrix form is;
Elhorst (2010) separated the spatial econo-metric into two principal models: Spatial Auto-regressive Model (SAR), and the extension, Spatial Error Model (SEM). In the SAR model, the general formulation of the model is;
) sectional dependent variables, and X represents the n x k matrix of independent variable, W1 and W2 area spatial weighted matrix (LeSage, 1999). While in the SEM model, the general for-mulation of the model uses maximum likelihood methods;
The uniqueness of the standard spatial econometric model is in the inclusion of the element of real geographic in the model. The geographic element is included in the model as spatial weighting and produces the value of spatial autocorrelation. It means that the model has included the interaction factor among re-gions.
The value of spatial autocorrelation ( that reflects the using of spatial weighting in the model means as follows. First, the location dif-ference is inherent explicitly in the dependent variable. More significant value of parameter shows the increasing importance of location dif-ference among regions. Second, the positive or negative value of shows that a region tends to be close to, or be far away from another region in the variable that is analyzed.
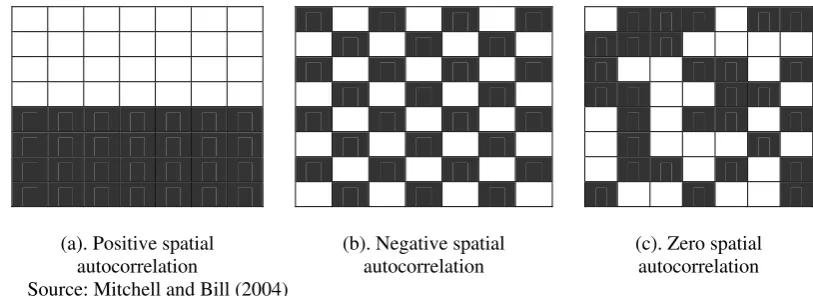
Mitchell & Bill (2004) described clearly the spatial autocorrelation concepts in Figure 1. The figure describes three types of spatial autocorre-lation:
a. Positive spatial autocorrelation will happen in the nearest location with the same attrib-utes.
b. Negative spatial autocorrelation will happen in the nearest location with different attrib-utes.
c. Zero spatial autocorrelation will be detected if the attributes in each region are independ-ent of its location.
EMPIRICAL RESULTS
This empirical work applies the use of spa-tial econometric modeling, because the model is able to accommodate variables which have nor-mally undistributed data, accommodate spatial aspect in an explicit way, and be able to reduce the heteroscedasticity effect in the model. This research applied two spatial econometric mod-els; panel Spatial Autoregressive Model (SAR) and panel Spatial Error Model (panel SEM). After calculation, the models (SAR and SEM) show better than the Ordinary Least Square (OLS) Model. It is identified from the LR statis-tic value test, comparison of R2 determination, and more important is the theoretical consistency of the model.
By comparing between Panel SAR and Panel SEM, the SEM model calculation is better than SAR. It can be detected that the coefficient of spatial weighting of each SAR model is negative and insignificant. Thereby, this empirical result is focused on panel SEM.
Table 1 shows the empirical model that has resulted from panel SEM computation. In the theoretical framework, all of the independent variables in all the models show consistency to the theoretical side. All the variables show a positive influence. In the statistical view, some variables have a significant in = 1%, others in 5% and 10%. The value of adjusted R2 is more than 0.96. It shows that at least 96% of the variation of the dependent variable can be ex-plained accurately by the using of the independ-ent variables.
(a). Positive spatial autocorrelation
(b). Negative spatial autocorrelation
(c). Zero spatial autocorrelation Source: Mitchell and Bill (2004)
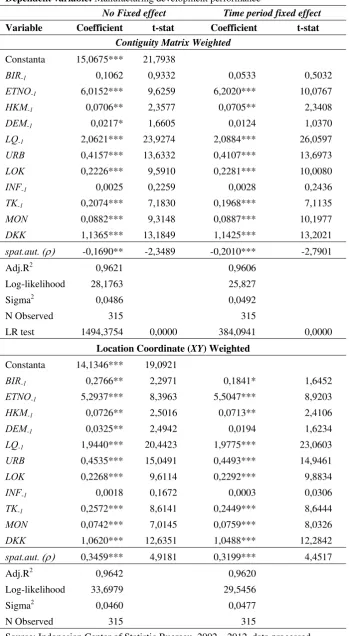
Table 1. Panel Spatial Error Model (Panel SEM) Model
Dependent variable: Manufacturing development performance
No Fixed effect Time period fixed effect
Variable Coefficient t-stat Coefficient t-stat
Contiguity Matrix Weighted
Constanta 15,0675*** 21,7938
BIR-1 0,1062 0,9332 0,0533 0,5032
ETNO-1 6,0152*** 9,6259 6,2020*** 10,0767
HKM-1 0,0706** 2,3577 0,0705** 2,3408
DEM-1 0,0217* 1,6605 0,0124 1,0370
LQ-1 2,0621*** 23,9274 2,0884*** 26,0597
URB 0,4157*** 13,6332 0,4107*** 13,6973
LOK 0,2226*** 9,5910 0,2281*** 10,0080
INF-1 0,0025 0,2259 0,0028 0,2436
TK-1 0,2074*** 7,1830 0,1968*** 7,1135
MON 0,0882*** 9,3148 0,0887*** 10,1977
DKK 1,1365*** 13,1849 1,1425*** 13,2021
spat.aut. ( -0,1690** -2,3489 -0,2010*** -2,7901
Adj.R2 0,9621 0,9606
Log-likelihood 28,1763 25,827
Sigma2 0,0486 0,0492
N Observed 315 315
LR test 1494,3754 0,0000 384,0941 0,0000
Location Coordinate (XY) Weighted
Constanta 14,1346*** 19,0921
BIR-1 0,2766** 2,2971 0,1841* 1,6452
ETNO-1 5,2937*** 8,3963 5,5047*** 8,9203
HKM-1 0,0726** 2,5016 0,0713** 2,4106
DEM-1 0,0325** 2,4942 0,0194 1,6234
LQ-1 1,9440*** 20,4423 1,9775*** 23,0603
URB 0,4535*** 15,0491 0,4493*** 14,9461
LOK 0,2268*** 9,6114 0,2292*** 9,8834
INF-1 0,0018 0,1672 0,0003 0,0306
TK-1 0,2572*** 8,6141 0,2449*** 8,6444
MON 0,0742*** 7,0145 0,0759*** 8,0326
DKK 1,0620*** 12,6351 1,0488*** 12,2842
spat.aut. 0,3459*** 4,9181 0,3199*** 4,4517
Adj.R2 0,9642 0,9620
Log-likelihood 33,6979 29,5456
Sigma2 0,0460 0,0477
N Observed 315 315
The coefficient of spatial weighted, by use of the contiguity matrix weighted method, shows negative impact and insignificant to independent variable. However, the using of coordinate loca-tions (XY) weighting has a positive and signifi-cant impact. The significance of value gives an indication that without spatial weighting the model will be depended on spatial matter.
From the models, the identification of the theoretical tests can be described as follows:
a. For all the SEM models, regression coeffi-cients show bureaucratic finance perform-ance (BIR) has a significant and positive im-pact on regional manufacturing. This result is similar to other empirical works (Bose et al., 2007).
b. The ethno linguistic variable (ETNO) that is represented by ethnic diversity has a positive and significant statistical impact on manu-facturing. It shows ethnic diversity has an important role in pushing manufacturing de-velopment.
c. Law enforcement (HKM) has a positive and significant effect on manufacturing devel-opment performance.
a. This research finds out that democracy (DEM) has a positive and significant effect on manufacturing development.
b. Manufacturing basic activity (LQ) is proven to have a positive and significant impact in pushing manufacturing development.
c. City attraction (URB) that is represented by the urban population in every region shows a positive and significant effect on manufac-turing. It means the increase of an urban population in an area will encourage eco-nomic enhancement through the internaliza-tion of local knowledge spillover effect
d. Location index (LOK) in this research refers to local economic endowment and the de-gree of accessibility to the centre of eco-nomic growth. This research shows that the location index has a positive and significant effect on the manufacturing sector.
e. Infrastructure (INF) coefficient shows a positive effect on manufacturing develop-ment. This conforms with previous research.
f. Labor activity (TK) also has a positive and statistically significant contribution to manu-facturing development.
g. The financing activity of finance institutions (MON) has a positive and significant effect on manufacturing.
h. The model shows that the dummy variable to detect differences in regional administration types also has a positive and significant ef-fect on manufacturing.
i. On panel SEM models with location coordi-nate weighting, the spatial coefficient weight has a positive and significant effect. It indicates there is an existing of spatial de-pendence among regions. It shows that an area with a high concentration of manufac-turing activity will be located close to an-other area which also has a high manufac-turing concentration. The location depend-ence impact will decrease if an area is far away from the high concentration manufac-turing area.
CONCLUSIONS
statisti-cally significant effects on the dependent vari-able.
This empirical evidence of spatial depend-ency in the regions of Central Java where the manufacturing sector are concentrated shows also the tendency of centripetal aspect that forms agglomeration economies. This result supports Kuncoro (2012) who applied the industrial dis-trict theory and found out that the clustering of small and cottage industries in metropolitan ar-eas of Java showed a high spatial concentration. This supports Kuncoro’s (2002) suggestion that the spatial concentration was an important de-terminant in encouraging the improvement of the manufacturing sectors.
This research offers some suggestions for policy makers. First, related to the positive and significant effects of institution variables, finan-cial bureaucracy performance needs to be im-proved, particularly in the government budgeting of increasing capital expenditure to total expen-diture ratio. From the ethno linguistic perspec-tive, manufacturing development can be pushed by increasing ethnic diversity, which means ac-culturation from different cultures. In the democ-racy aspect, every region needs to increase organizational freedom that will reflect the free-dom of civil society to create, activate and run their own business. In another institutional aspect, law enforcement can be improved by encouraging openness in the law and increasing the effort to accelerate the arrangement proce-dure of civil and criminal laws.
Second, related to the effect of spatial vari-ables, public policy needs to prevent the nega-tive impacts of the urbanization process. Gov-ernment needs to expand urban city areas and encourage the emergence of new city areas. Economic development far away from the growth centre area can be overcome by estab-lishing special economic areas and also new economic corridors whose location is expected, given time, to form new economic growth cen-ters. Another result, the positive and statistically significant impact of varying regional admini-strations indicates that the newest cities which emerged from the division of previous adminis-trative territories in early 2000 could not
encour-age their manufacturing sectors. The effort to separate an area into two or more regional administration s has not been effective in en-couraging manufacturing development.
Finally, related to policy factors, busi-ness and government sectors need to increase labor productivity and the financial intermedia-tion sector. The banking sector needs to priori-tize and facilitate manufacturing credit schemes, particularly in areas that are falling behind in their development of their manufacturing sector.
REFERENCES
Acemoglu, D., Johnson, S., and Robinson, J., 2004. “Institutions as the Fundamental Cause of Long-Run Growth”, CEPR Discussion Paper 4458 (prepared for the Handbook of Economics Growth).
Ahmad, A. A. and Priyono R., “Proof of Deindustrialization on Manufacturing Sector in Central Java Province”, Paper presented in International Conference of ICORE, Purwokerto, Indonesia, 2013.
Amos, O. M., 1987. “The Influence of Urban Areas on Regional Development”, The Review of Regional Studies, Number 3, Volume 17, Fall 1987, Southern Regional Science Association.
Anas, A., 2004. “Vanishing Cities: What does the New Economic Geography Imply about the Efficiency of Urbanization?”, Journal of Economic Geography, 4 (2004), pp. 181-199.
Anderson, T.L., Huggins, L.E., 2003. “The Property Rights Path to Sustainable Development”, in Wynne, MA, Rosenblum H & Formaini, RL (ed.), The Legacy of Milton and Rose Friedman’s – Free to Choose – Economic Liberalism at the Turn of the 21sc Century, Federal Reserve Bank of Dallas. Texas.
Anselin, L., 1999. Spatial Econometrics, Bruton Centre School of Social Sciences, University of Texas, Dallas.
Geo-graphy and National Center for Super-computing Applications University of Illinois, Urbana-Champaign, Urbana.
Aron, J., 2000. “Growth and Institutions: A Re-view of the Evidence”, The World Bank Observer, Vol. 15, No. 1 (February 2000).
Bartik, T. J., 1991. Who Benefits From State and Local Economic Development Policies? W.W. Upjohn Institute, Kalamazoo, Michi-gan.
Beer, A. and Kearins, B., 2004. “Regional Dimensions in National Development: Understanding the Role of Regionally Focused Economic Development in Achieving National Growth”, Paper Presented to the Inaugural National Research Colloquium, February 19, 2004.
Bekele, G.W. and Jackson, R.W., 2006. “Theoretical Perspective on Industry Clusters”, Research Paper 2006-5, Regional Research Institute, West Virginia University
Black, D. and Henderson, V., 1999. “A Theory of Urban Growth”, Journal of Political Economy, Vol. 107, No. 2 (1999), the University of Chicago.
Brakman, S., Garretsen, H., and Schramm, M., 2001. “New Economy Geography in German: Testing the Helpman-Hanson Model”, Research Report 01D46 - Research Institute SOM (Systems, Organizations and Management), University of Groningen.
Brunt, L., 2007. Which Institutions Matter for Economic Growth?, ICNIE Publication Article at: http://www.icnie.org, accessed on June 10th, 2009.
Cameron, G., 1998. “Innovation and Growth: A Survey of The Empirical Evidence”, D.Phil Thesis at University of Oxford, Nuffield College, Oxford, UK.
Chang, H.J., 2010. “Institution and Economic Development: theory, Policy and History”, Journal of Institutional Economics 2010, The JOIE Foundation.
Claeys, P. and Manca, F., 2009. A Missing Spatial Link in Institutional Quality, ICNIE Publication Article, http://www.icnie.org/
claeys_manca.pdf, accessed on June 10th, 2009.
Coase, R., 1998. “The New Institutional Eco-nomics”, The American Economic Review, Vol 88, No.2, American Economic Associa-tion.
Coughlin, C.C. and Segev, E., 1999. “Foreign Direct Investment in China: A Spatial Econometric Study”, Federal Reserve Working Paper 1999-001A’, Research Division, Federal Reserve Bank of St. Louis.
Dawkins, C.J., 2003. “Regional Development Theory: Conceptual Foundations, Classic Works, and Recent Developments”, Journal of Planning Literature, Vol. 18, No. 2 (No-vember 2003), Sage Publications.
Dorward, A., Kydd, J., Morrison, J., and Poulton, C., 2005. “Institutions, Markets and Economic Co-ordination: Linking Development Policy to Theory and Practice”, Development and Change, 36 (1), Institute of Social Studies, Blackwell Publishing, Oxford, pp. 1–25.
Eberts, R.W., 1991. Some Empirical Evidence on the Linkage between Public Infrastructure and Local Economic Development, in Henty W Herzog Jr. and Alan M. Schlottmann (ed.). Industry Location and Public Policy, the University of Tennessee Press, Knoxville.
Elhorst, J.P., 2010. “Spatial Panel Data Model”,
at: www.regnoringen.nl/elhorst/doc/ Spatial%20Panel%20Data%20Models.pdf,
University of Groningen.
Engerman, S.L. and Sokolof, K.L., 2005. “Institutional and Non-Institutional Explanation of Economic Differences”, in Claude Menard and Mary M. Shirley (ed.), Handbook of New Institutional Economics, Sprinter, New York.
Fearon, J. D., 2003. “Ethnic and Cultural Diversity by Country”, Journal of Economic Growth, 8 (2003), Kluwer Academic Publisher, Netherlands, pp. 195-222.
Massachusetts Institute of Technology, London, England.
Furubotn, E.G. and Richter, R., 2008. “The new Institutional Economics – A Different Approach to Economic Analysis”, Journal Compilation © Institute of Economic Affairs, Blackwell Publishing, Oxford.
Gaki, E., Angelis, E., Koufodontis, I., and Mvri, M., 2006. “The Impact of ICT on Regional Development”, Gateway No. 6. Accessibil-ity, Transport, Infrastructure and Regions, Department of Business Administration, University of the Aegean, Chios, Greece.
Gartner, Stefan, 2001. “Clusters, Growth Poles and Industrial Districts: Growth Agenda ver-sus Cohesion”, Paper on Regional Transi-tions – Gdansk Conference, 15-18 Septem-ber 2001, Institute Work and Technology, Germany.
Garzón, J.C.E. and Galvis, A.M.F., 2005. “The Social Impact of the Banking Sector in Colombia, 1995 – 2002”, DEGIT Conference Papers c010_039, DEGIT
Glaeser E.L., Kallal, H.D., and Scheinkman, J.A., 1992. “Growth in Cities”, Journal of Political Economy, Vol.100, No.6, The University of Chicago.
Grossman, G.M. and Helpman, E., 1994. “Endogenous Innovation in the Theory of Growth”, The Journal of Economic Perspec-tive, Volume 8, Issue I (Winter 1994), American Economic Association.
Higgins, B. and Savoie, D.J, 1995. Regional De-velopment Theories & Their Application, Transaction Publisher, New Jersey.
Hoff, K. and Stiglitz, J.E., 2001. Modern Economic Theory & Development, in Gerlad M, Meier & Joseph E, Stiglitz (ed), Frontier of Development Economics – The Future in Perspective, Oxford University Press.
Jaya, W.K., 2010. Kebijakan Desentralisasi di Indonesia dalam Perspektif Teori Ekonomi Kelembagaan, Universitas Gadjah Mada, December 23, 2010,
Kilkenny, M., 1998. “New Economic Geography for Low Density Places: Insights
from Kaldor & Lancaster”, Proceeding paper at Analytical Economic Geography & Regional Change, Storss, CT, March 23-24, 1998
Klein, P. G., 1999. “New Institutional Economics”, in B, Bouckaert& G, DeGeest (ed.) Encyclopedia of Law and Economics, Vol 1, Cheltenham: Edward Elgar.
Krugman, P., 1998. “The Role of Geography in Development”, Paper presented for the An-nual World Bank Conference on Develop-ment Economics, Washington, DD, April 20-21, 1998.
Kuncoro, M., 2012. “Economic Geography of Small and Cottage Industrial Clusters in Java Island Indonesia”, Global Advanced Re-search Journal of Geography and Regional Planning, Vol. 2(1) pp. 006-018, January, 2013.
Kuncoro, M., 2002. Analisis Spasial dan Re-gional – Studi Aglomerasi dan Kluster In-dustri Indonesia, UPP AMP YKPN, Yogya-karta, pp. 119 – 144.
Laliberte, L.J., 2009. Centripetal & Centrifugal Forces, Master of Urban & Regional Plan-ning, Florida Atlantic University, Florida.
LeSage, J.P., 1999. The Theory & Practice of Spatial Econometrics, Department of Econometrics, University of Toledo, Febru-ary 1999.
Luckham, R., Goetz A.M., and Kaldor, M., 2000. “Democratic Institutions & Politics in Contexts of Inequality, Poverty, & Conflict”, Institute of Development Studies Working Paper 104, January 2000
Mardiasmo, 2002. Otonomi dan Manajemen Keuangan Daerah. Yogyakarta: Penerbit Andi.
Marthur, A., 2005. “Essays in Spatial Econo-metrics”, Unpublished Dissertation, Faculty of Graduate School of the University of Maryland, College Park.
2004, The University of Newcastle, Callaghan, Australia.
Net, V. and Swedberg, R., 2005. Economic Sociology & New Institutional Economics, in Menard, C & Shirley, MM (ed.), Handbook of New Institutional Economics, Sprinter, New York.
North, D, C., 1997. Economic Performance Through Time, ICNIE Publication Article, at: http://www.icnie.org, accessed on June 10th, 2009.
O’Sullivan, A., 2003. Urban Economics, Fifth Edition, McGraw-Hill Irwin.
Pace, R.K. and LeSage, J.P., 2003. “Closed-Form Maximum Likehood Estimates for Spatial Problems”. Available at: http://www.spatial-statistics.com, accessed on September 3rd, 2003
Perry, N. and Schonerwald, C., 2009. “Insti-tution, Geography, & Term of Trade in Latin America: A Longitudinal Econometric Analysis”, Department of Economic Work-ing Paper Series, No: 2009 – 09, University of Utah.
Puga, D., 2001. “European Regional policies in Light of Recent Location Theories”, CEPR Discussion Paper 2767, Revised on Decem-ber 2001 to be published in the Journal of Economic Geography.
Scott, A.J., 2004. “A Perspective of Economic Geography”, Journal of Economic Geogra-phy Vol .4, No.5, Oxford University Press.
Shirley, M.M., 2005. Institutions & Development, in Menard, C & Shirley, MM (ed.), Handbook of New Institutional Economics, Sprinter, New York.
Soepono, P., 1998. “Peranan Daerah Perkotaan Bagi Pembangunan Regional: Penerapan Model Thunen yang Dimodifikasi di Indo-nesia”, Jurnal Ekonomi dan Bisnis Indone-sia, Volume 13, No.2, Faculty of Economic and Business, Universitas Gajah Mada.
Suhardi, B. and Kuncoro, M., 2013. “Key Determinants of Deindustrialization in Textile and Products of Textile Industries in Surakarta and Karanganyar, Indonesia”, The Empirical Economics Letters, A Monthly International Journal of Economics, Volume 12, Number 5. May 2013
Szirmai, A., 2009. “Industrialization as an Engine of Growth in Developing Countries”, UNU-MERIT Working Papers 2009-010, United Nations University.
Torrisi, G., 2009. “Public Infrastructure: Defini-tion, Classification & Measurement Issues”, Munic Personal RePEc Archive (MPRA), January 2009, Ludwig Maximilians, Munich University, Munchen.
Verspagen, B., 1992. “Endogenous Innovation in Neo-Classical Growth Models: A Survey”, Journal of Macroeconomics, Fall 1992, Vol.14, No.4, Louisiana State University Press.
Williamson, O.E., 2000. “The New Institutional Economics: Taking Stock, Looking Ahead”, Journal of Economic Literature, Vol XXXVIII, September 2000.