1
THE COMPETITIVENESS OF INDONESIAN TUNA EXPORT
FACING THE ASEAN ECONOMIC COMMUNITY
Apridar
Faculty of Economics, University of Malikussaleh, Lhokseumawe, Aceh, Indonesia
Corresponding Author: [email protected]
Abstract: This study tried to estimate the competitiveness of Indonesian tuna exports in the ASEAN market during the period 2005-2010 and analyze the factors affecting the competitiveness of exports of tuna. Several data analysis methods were used to measure the commodity of Indonesian tuna with competitiveness to the ASEAN market are the Revealed Comparative Advantage (RCA) and Constant Market Share Analysis (CMSA); while the panel data regression is used to examine the factors that affect the export competitiveness of Indonesian tuna to the ASEAN countries. This is indicated by the value of RCA obtained less than 1. This also shows that the competitiveness of Indonesian tuna is still relatively high (strong); while the value of CMSA is positive, it indicates that Indonesia is still be able to maintain the competitiveness of tuna fish in the ASEAN market. RCA and CMSA size is then used as the dependent variable in the regression analysis panel. The results of the panel regression estimated using a random effects indicate that GDPi negative and significant, while GDPj, POPj, Distance and exports have a positive and significant effect on RCA. The result of the pooled least square estimation indicates that GDPi and POPi are negative and significant, while the POPj gives a positive and significant influence toward CMSA decreased.
Keywords: Competitiveness Revealed Comparative Advantage, Constant Market Share Analysis, Panel Data Regression.
Introduction
Indonesia is the largest archipelagic state in the world, possesses abundance marine and fisheries natural resources. With a sea area of 5.8 million km2 (Ministry of Maritime Affairs and Fisheries 2010), the development of marine and fisheries sector can be one of promising future national economic development. FAO (2000) states that currently, fishes are accounted to provide for
approximately 13.8 to 16.5% of the animal protein of humans’ intake. During the period 1961 to
1998, despite the 3.6% per year, the growth of the world's fish supply for food consumption remained fall of sort. The fish are marketed worldwide at 79.60% for food consumption (food) and the rest (20.40%) for non-food consumption, there is evidence that fish is on demand for consumption.
The increasing demand for the food in the world which includes fishery commodities will indirectly increases the transaction for Indonesian fish production in the international market. According to World Fishery Organization (2010) there are three potential markets for Indonesian fishery commodities, namely the Asian, the US and the European regions. The Marine and Fisheries Data Statistics of 2010 shown that Indonesia's main export commodities in the period 2005-2010 were shrimp and tuna. Indonesia also plans to implement the agreements of ASEAN
Economic Community by 2015 which can also be a challenge to the fisheries sector, particularly of the tuna products. Based on data from FAO (2011a) among ASEAN countries which are potential tuna exporters are Indonesia, Malaysia, the Philippine and Thailand. Of the four countries, Indonesia is the largest Tuna exporter in the ASEAN.
2
open their market for Indonesian Tuna; and that had doubled up the value of exports and the flow of foreign exchange into the country.
Based on FAO report (2011a), ASEAN produces at least four types of tuna: albacore (Thunnus alalunga), Bigeye Tuna (Thunnus sp), Skipjack and Yellowfin (Thunnus albaca). In addition, the data from UN-Comtrade (2011) showed that in the last ten years, the Indonesian fish and fishery products exports have been experiencing significant changes. In 2000, Indonesian fish and fishery products had exported mainly to Japan (50%), the United States (19%), the EU (6%) and other Asian countries. However, in 2010, the direction of export, instead of Japan and the EU, had shifted to Asian countries, such as Malaysia, Singapore, Thailand, the Philippines, Vietnam, China, Hong Kong and several other East Asian countries.
The total volume of tuna exports to countries like the E U, Taiwan, and Singapore had decreased respectively approximately between 1152.8 tons, 1614.5 tons, and 3105.5 tons in 2007 compared with the total export in 2003. The Decline in tuna exports to the E U was not mainly due to the competitiveness, but more to the provisions of the E U trade policy. The EU had discriminatively applied the duty rate for Tuna Exporter countries. It had imposed discriminatively import duty of 9.5 per cent for Indonesian fishery products, but not for the similar products that of Vietnam and some other countries. Such trade barriers obviously would affect the Indonesia tuna export to the E U. Nevertheless, there were other reasons that caused the uncertain condition of Indonesian tuna export to those countries. Seemed the Indonesian tuna products were not well managed, because of several constraints, such as the limitation or ill equipped port facilities and transportation that had caused the quality of tuna dropped. In terms of the tuna price it was very competitive at the local and international lever, approximately, the variance between 15.000 IDR at the local and 3 to 4 USD at the international market. Although the market is open competitively, it remained unable to compete at the global market.
Accordingly, it was very important to examine the competitiveness of Indonesian fisheries sector, focusing on the prospect of tuna commodities in facing the ASEAN Free Trade in 2015. Certainly, this study would provide very useful input for the sustainability of Indonesia economy at the marine and fishery sectors, which would especially helped in improving the welfare of the fishermen, fish farmers and fish processed company, as well as the securing the sustainability of fish resources.
Literature Review
In such a competitive world market, a country to compete fairly, it should be able to evaluate the comparative and competitive advantages of its specialized products with in the world market, as exporter or importer. Through this strategy, each country could identify the differences in terms of factors related to the production or efficiency and cost comparative advantage. For a country to be able to compete it should focuses on ability to increase level of productivity and efficiency. In this case, the government plays important role to boost competitiveness, as facilitator and regulator to maintain market dynamism. It can do so through research and development policies, socialization, enhancing access to the market, improvement of infrastructure and market information center.
This strategy is the main point of the competitive advantage theory, which aims to improve
the system for Industries’ development in a country. It has refuted the present assumption that
the success of Industrial development is mainly influenced by present of the comparative advantage.
An analysis of Revealed Comparative Advantage (RCA) is a method that is used to analyze or measure the competitive advantage of a country. It is considered to be an exceptional method, because the value of comparative advantage is reflected in value of exports. Meanwhile, the
3
due to the concentration on the export of relatively less demanded commodities, stagnant region as its distention of export, as well as the inability to compete with other exporter countries.
Cahya (2010), using Revealed Competitive Advantage (RCA) stated that fresh and processed tuna are commodities with high comparative competitiveness, but not for the frozen tuna. Putthipokin (2001) has used RCA indexes to examine the comparative advantages of the canned tuna industry in Thailand in comparison with the Philippines and Indonesia, whereby Thailand was the prime competitor, to the big five importers, the United States, The European Unions, Canada, Australia and Japan in the year 1994-1999. It found the Thailand’s export RCA indexes was higher than the Philippines and Indonesia, with the exception of the European Unions.
Furthermore, Kijboonchoo and Kalayanakupt (2003) analyze the comparative and competitive advantages of canned tuna exports in the world market. They compared the RCA index against the major exporter for over four (4) periods: 1982-1986, 1987-1991, 1992-1995, and 1996-1998. The results showed that the comparative advantage of Thai canned tuna exports has
declined. Despite that the Philippines’ and Indonesian’s comparative advantage exports of canned tuna was relatively lower than Thailand. The reasons were that Thailand's have a bigger resources of tuna, more efficient and lower cost fishing vessels on the high seas.
Gates et.al (2007) analyzed the fluctuation of Indonesia’s net exports vis a vis the other two export competitors. The results showed that within the period of 1999-2005 there were positive changes in the Indonesian exports especially to Japan, ASEAN, and the East Asian countries. Indicating that after liberalization the export performance in general was very encouraging, with the exception of exports to the United States and the EU, in comparison to the others.
However, Yuniarti (2007), in her analysis of the determination of Indonesia's bilateral trade, found that the gravity model could explain the conditions of the Indonesia’s bilateral trade with the 10 major trading partners. She argued that the variables -national income of the trading partners both exporters and importers, importers population, the similarity of economic growth- have positive effect on bilateral trade, but the distance of trading partner variable showed negative effect. The relative differences of the endowment factor and membership in the free trade zone have no influence on the bilateral trade.
Cahya (2010) argued that the monopolistic structure of the market for tuna commodities tends to create an oligopoly trading condition; and that would make the Indonesia's position weaker, as the followers of the market. It cannot set its own price for the products. Such a weak position is due to several reasons, the availability of resources, intense competition structure, and lower support for related industries. Thus, based on the analysis, it can be concluded that the competitive advantage of the Indonesian tuna commodity does not have a competitive advantage.
Research Methodology The Model Specification
To analyze the comparative advantage, this article applied the Revealed Comparative Advantage (RCA) model. The RCA is the ratio between the country market share of a product and a market share of a country's exports to total world exports. Utkulu and Seymen (2004) offered the following Philippine and Vietnam), Yi is j Country’s total export, Xi is the total export tuna type i or total export of fishery product of the country j to the world, and Y is World Total export (tuna or fishery products).
To analyze competitive advantage, it can be done by adopting Constant Market Share Analysis
4
export growth. The basic assumption of the model is a country's market share in the world market remains constant over time.
q = Value of Country’s Export under investigation, Q = Value World Total Exports
s = Export share (q/Q), 0 = Base Year,
i = Commodities under investigation, and j = Country or Territory.
The value of RCA and CMSA are considered as dependent variable in the regression analysis panel, then it is supported by the gravity model which has widely been applied in economic research; and the basic of the gravity model (Hemkamon, 2007) is as followed:
= � � �� �� �� �� �
Dij : Distance between country i and j
Aij : Other factors (increase/decrease trade) between country i and j
εij : error term
Data
5
countries (POPj), distance between Indonesia to other ASEAN countries (distance), and Total value of Indonesian export of tuna to ASEAN countries (Export). Those data were based on statistical report provided by the Indonesian Fisheries and Marine Board, Secretariat of ASEAN in Jakarta and the Bureau of Statistics Centre.
Empirical Results
Among the major tuna exporters of the ASEAN countries to the world market were Indonesia, Malaysia, Singapore Thailand, the Philippines and Vietnam. Based on Data provided by the UN-Comtrade (2011) pointed that within the period of 2000-2010, Indonesia, on average, tuna export growth was lower than Thailand and the Philippines. The former could only achieve 5,2 per cent which was below average of 7,and 4 per cent of the world growth of tune exports. Thailand and the Philippines achieved respectively up to 14,3 and 12,0 per cent.
Table 1. Tuna Export Growth based on Type and Form of Products 2000-2010
Type of Exported Tuna Product Indonesia Malaysia Singapore Thailand The Philippines Vietnam World
Tuna (albacore,longfin) Fresh or
Chilled, whole -22.5 - - 345.8 - - 1.3
Tuna (yellowfin,longfin) Fresh or
Chilled, whole -9.3 2.1 -1.27 11.5 -17.5 0.01 0.4
Tuna (Skipjack,stripe-belly bonito)
Fresh or Chilled, whole -20 0.12 11.2 24.6 52.2 0.25 -2.1
Tuna nes, Fresh or Chilled, whole 9.5 0.17 1.12 -44.3 -23.9 - 2.3
Tuna (albacore,longfin) Frozen, whole -3.6 -2.02 - 65.2 - 0.21 3.1
Tuna (yellowfin,longfin) Frozen, whole 6 1.1 3.16 31.4 23.6 2.12 4.8
Tuna (Skipjack,stripe-belly bonito)
Frozen, whole 19.8 0.023 2.09 25.8 -8.9 - 16.4
Tuna nes, Frozen, whole 12.1 (2,01) 10.05 -8.9 43.5 10.1 -3.6
Tuna,Skipjack, Bonito,
prepared-preserved, not minced 9 0 16.14 14.2 16.4 - 12.7
Avarage 5.2 1.9 10 14.3 12 - 7.4
Source: The Indonesian Fisheries and Marin Board, ITC calculations based on Eurostat, United Nations Statistics Division, World Trade Organisation, International Monetary Fund, Organisation for Economic Co-operation and Development (OECD) statistics, 2011
6
Table 2. Export Share of the Major ASEAN Countries According to Type and Form of Commodities in the World Market 2010 (in percentage)
Tuna Commodities Indonesia Malaysia Singapore Thailand The Philippines Vietnam
1. Fish, Fresh or Chilled
a. Tuna Albacore 0,00 - - - - -
b. Tuna Yellowfin 0,72 - 0,00 0,00 - -
c. Tuna Skipjack 0,00 - - - - 0,02
d. Other 1,40 0,00 0,02 0,00 -
Total 2.12 0.00 0.02 0.00 - 0.02
2. Frozen Fish
a. Tuna Albacore 0,36 0,00 0,06 0,12 - 0,13
b. Tuna Yellowfin 1,34 0,01 0,02 0,09 0,03 0,06
c. Tuna Skipjack 3,31 0,01 0,01 0,75 0,01 0,02
d. Other 0,87 0,00 0,05 0,10 0,01 0,13
Total 5.87 0.02 0.14 1.07 0.04 0.34
Source: The Indonesian Statistic Fisheries Export and Marin Board, ITC calculations based on Eurostat, United Nations Statistics Division, World Trade Organisation, International Monetary Fund, Organisation for Economic Co-operation and Development (OECD) statistics, 2011
Notes : 0,00 : Relative Lowest value, (e.g. Tuna Albacore Indonesia value 0,0001) - : No export
7
Table 3.Revealed Comparative Advantage Tuna Export, Period 2005-2010
Year Indonesia Malaysia Singapore Thailand The Philippines Vietnam
2005 3.34 2.44 1.04 1.61 5.52 4.26
2006 2.83 1.65 0.81 1.22 4.26 3.44
2007 3.34 0.41 0.57 0.30 4.15 3.96
2008 3.66 2.13 0.71 0.38 4.67 4.41
2009 3.30 0.60 0.77 0.37 4.39 4.32
Source: The Indonesian Statistic Fisheries Export, United Nations Statistics Division, World Trade Organisation, International Monetary Fund, Organisation for Economic Co-operation and Development (OECD) statistics, (processed), 201
The Philippines also showed similar pattern of export growth. It performed better in supplying frozen yellow fin and skipjack tuna. The value of RCA respectively increased from 0.15 in 2005 to 0.22 in 2009.
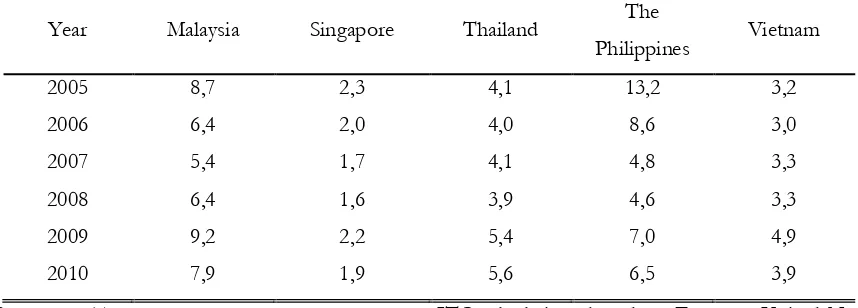
In terms of tuna export ratio in the world market, Indonesia was far behind Thailand. It had decreased from 0,4 in 2000 to 0,and 2 in 2009. Yet, comparing to the Philippines, the former performed slight better, and closely followed by the latter.
Table 4. Ratio of Indonesian Tuna Export Value vis-à-vis the ASEAN countries in 2005 – 2010 (percentage)
Year Malaysia Singapore Thailand The
Philippines Vietnam
2005 8,7 2,3 4,1 13,2 3,2
2006 6,4 2,0 4,0 8,6 3,0
2007 5,4 1,7 4,1 4,8 3,3
2008 6,4 1,6 3,9 4,6 3,3
2009 9,2 2,2 5,4 7,0 4,9
2010 7,9 1,9 5,6 6,5 3,9
Source: The Indonesian Statistic Fisheries Export, ITC calculations based on Eurostat, United Nations Statistics Division, World Trade Organisation, International Monetary Fund, Organisation for Economic Co-operation and Development (OECD) statistics (2011).
Furthermore, in Tabel4, Indonesia still performed better in providing fresh and frozen skipjanc and nes tuna. For fresh and frozen Nes tuna, Indonesia is ahead of Thailand, it had increased in terms of export ration from 14,4 and 6,1 in 2000 to 6.253,4 and 39,4 in 2009. Nevertheless, it had experienced down slop in fresh and frozen skipjack and frozen albacore tuna. Especially, for fresh albacore, frozen yellowfin and processed tuna Thailand exceeded the Indonesian export in the global market.
8
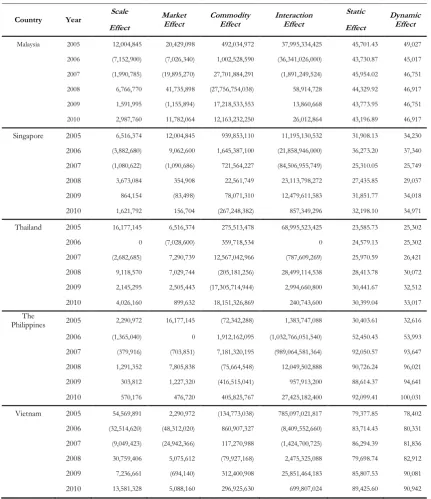
Table 5.Constant Market Share Analysis of Indonesian Tuna export to the ASEAN countries 2005-2010 (US $)
Malaysia 2005 12,004,845 20,429,098 492,034,972 37,995,334,425 45,701.43 49,027 2006 (7,152,900) (7,026,340) 1,002,528,590 (36,341,026,000) 43,730.87 45,017 2007 (1,990,785) (19,895,270) 27,701,884,291 (1,891,249,524) 45,954.02 46,751 2008 6,766,770 41,735,898 (27,756,754,038) 58,914,728 44,329.92 46,917 2009 1,591,995 (1,155,894) 17,218,533,553 13,860,668 43,773.95 46,751 2010 2,987,760 11,782,064 12,163,232,250 26,012,864 43,196.89 46,917 Singapore 2005 6,516,374 12,004,845 939,853,110 11,195,130,532 31,908.13 34,230 2006 (3,882,680) 9,062,600 1,645,387,100 (21,858,946,000) 36,273.20 37,340 2007 (1,080,622) (1,090,686) 721,564,227 (84,506,955,749) 25,310.05 25,749 2008 3,673,084 354,908 22,561,749 23,113,798,272 27,435.85 29,037 2009 864,154 (83,498) 78,071,310 12,479,611,583 31,851.77 34,018 2010 1,621,792 156,704 (267,248,382) 857,349,296 32,198.10 34,971 Thailand 2005 16,177,145 6,516,374 275,513,478 68,995,523,425 23,585.73 25,302 2006 0 (7,028,600) 359,718,534 0 24,579.13 25,302 2007 (2,682,685) 7,290,739 12,567,042,966 (787,609,269) 25,970.59 26,421 2008 9,118,570 7,029,744 (205,181,256) 28,499,114,538 28,413.78 30,072 2009 2,145,295 2,505,443 (17,305,714,944) 2,994,660,800 30,441.67 32,512 2010 4,026,160 899,632 18,151,326,869 240,743,600 30,399.04 33,017 The
Philippines 2005 2,290,972 16,177,145 (72,342,288) 1,383,747,088 30,403.61 32,616 2006 (1,365,040) 0 1,912,162,095 (1,032,766,051,540) 52,450.43 53,993 2007 (379,916) (703,851) 7,181,320,195 (989,064,581,364) 92,050.57 93,647 2008 1,291,352 7,805,838 (75,664,548) 12,049,502,888 90,726.24 96,021 2009 303,812 1,227,320 (416,515,041) 957,913,200 88,614.37 94,641 2010 570,176 476,720 405,825,767 27,425,182,400 92,099.41 100,031 Vietnam 2005 54,569,891 2,290,972 (134,773,038) 785,097,021,817 79,377.85 78,402 2006 (32,514,620) (48,312,020) 860,907,327 (8,409,552,660) 83,714.43 80,331 2007 (9,049,423) (24,942,366) 117,270,988 (1,424,700,725) 86,294.39 81,836 2008 30,759,406 5,075,612 (79,927,168) 2,475,325,088 79,698.74 82,912 2009 7,236,661 (694,140) 312,400,908 25,851,464,183 85,807.53 90,081 2010 13,581,328 5,088,160 296,925,630 699,807,024 89,425.60 90,942
Source: The Indonesian Statistic Fisheries Export, ITC calculations based on Eurostat, United Nations Statistics Division, World Trade Organisation, International Monetary Fund, Organisation for Economic Co-operation and Development (OECD) statistics (2011).
Notes: ( ) figure in bracket was negative
9
However, based on scale effect analysis, Indonesian commodities were better than other ASEAN countries. It had opportunity to produce large quantity of tuna productions and market seemed to love them. Yet, the growing import into the country had weakened Indonesia export. To calculate further the competitiveness of Indonesian tuna against ASEAN countries, fixed Effect
model was adopted by testing panel data.
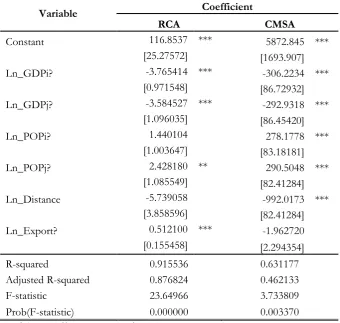
Table 6. Result of the Calculation Regression Data Panel
Variable Coefficient
RCA CMSA
Constant 116.8537 *** 5872.845 ***
[25.27572] [1693.907]
Ln_GDPi? -3.765414 *** -306.2234 ***
[0.971548] [86.72932]
Ln_GDPj? -3.584527 *** -292.9318 ***
[1.096035] [86.45420]
Ln_POPi? 1.440104 278.1778 ***
[1.003647] [83.18181]
Ln_POPj? 2.428180 ** 290.5048 ***
[1.085549] [82.41284]
Ln_Distance -5.739058 -992.0173 ***
[3.858596] [82.41284]
Ln_Export? 0.512100 *** -1.962720
[0.155458] [2.294354]
R-squared 0.915536 0.631177
Adjusted R-squared 0.876824 0.462133
F-statistic 23.64966 3.733809
Prob(F-statistic) 0.000000 0.003370
Source: fishstat.seafdec.org (processed), 2013
Explanation: ***, ** and *, Significant level 1%, 5% and 10% GDPi = GDP Indonesia; GDPj = GDP MEA countries;
POPi = Indonesian Population; POPj = MEA Countries Population
Table 6, above, showed that the total output of variables independent and dependent with the significant level at 1% and 5% with R-squared (R2) value at 91.55% (RCA) and 63.12%
(CMSA). Thus, the ASEAN countries’ tuna export was influenced by their independent variables.
(GDPi, GDPj, POPi, POPj, Distance and Export).
GDPi (GDP of Indonesia) and GDPj (GDP MEA countries) had negative influence and the level of significant against constant market share at 1%. It can be concluded that GDPi influence negatively and significant against constants market share and revealed comparative advantage. POPi (Population of Indonesia) and POPj (Population of MEA countries) affected positively the constant market share and revealed comparative advantage. The variable (distance) influenced negatively constant market share and revealed comparative advantage. Meanwhile, the variable (export) had negative effect on constant market share, but positively affected revealed comparative analysis.
10
to FAO data in 2007, Indonesia had produced 26,2% of the world tuna product or 1,7 million ton; and that had generated considerable income for the country. In 2011, the tuna export from Indonesia had increased 30,1 per cent from 122.450 ton = US $ 383 million in 2010 to 141.774 ton with market value US $ 499 million.
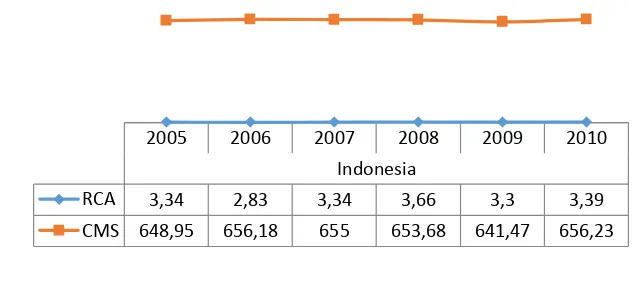
The Export also increased to the ASEAN countries. In 2011 it had reached 75,88 per cent, it was expected to increase in 2015. Notwithstanding that, during the unfriendly weather season and fishing was impossible had increased the import of tuna; and that certainly affected tuna production in the country. Further explanations about the value of Revealed Comparative Advantage
and Constants Market Share of Indonesian tuna export to several ASEAN countries in 2005- 2010 are provided in the following figure.
Figure 1. The Growth of Indonesian RCA and CMSA Period 2005 – 2010
Source: The Indonesian Statistic Fisheries Export and fishstat.seafdec.org, (processed), 2012
Within the period of 2011 – 2015, Indonesian competitiveness had increased in
comparison to other ASEAN countries’ tuna export commodities to Indonesian market. Yet, the
growth of import in the country had caused the Indonesian RCA and CMSA indexes condition was stable. Only the value of constant market share analysis (CMSA) was fluctuating, a condition that reflexes that in certain season the value of Indonesian export was higher than the import.
The value of fishery export had experienced surplus in 2007 greater than in 2006. It was due to the Indonesian fishery products won market confidence of several major developed countries like America, EU and Japan. To main and increase its tuna export, Indonesia signed trade agreement bilaterally or joined regional cooperation with other ASEAN countries. Indonesia signed agreement with Malaysia on the safe guard of the sea against pirate and fishery theft. ASEAN is the world largest tuna producers region, but there was no proper coordination among them. They had to face all problems from tariff and other disadvantages policies of destination countries individually; and that had slow down the growth of export.
To improve this unfavorable condition, Indonesian government had jointly established corporation on tuna fishery and pushed the world tuna market. It improved the usage of technology and human resources development. These moves were expected to improve and upgrade the quality and value of tuna product, fresh, frozen and even the use of tuna bone.
During the years 2011-2015, the volume of Indonesian tuna export has been expected to increase based on the assumption that the RCA will increase by 5% annually at the rate of ASEAN
countries economic growth. The greater the ASEAN countries’ economic are growth, the greater comparative value that Indonesia will gain. Based on this projection, the prospect of Indonesian tuna export are very promising and it might contribute much for the national income; and so does the fishermen, who would gain more income in few year to come, as long as other factors rare
2005 2006 2007 2008 2009 2010
Indonesia
RCA 3,34 2,83 3,34 3,66 3,3 3,39
11
constants (Cateris Paribus). In 2011, Indonesian tuna export increased from 122.450 ton in 2010 to 141.774 ton.
In 2012 the tuna export had positively increased and the destination also had expanded not only to the ASEAN countries, but also some developed countries, the US and Japan. By 2011, the value of Indonesian tuna export was closed at 499 million US dollar, increased by 30,1 per cent. Indonesia had to maintain this surplus and continued to look for more market for its tuna products to push the alternative source of national income.
Having such huge natural marine and fishery resources, and varieties of tuna in particular, Indonesia is a very potential state that out run the other tuna exporter such as Vietnam and the Philippines. It has 11 fishery (Wilayah Potensi Perikanan/ WPP), the Andaman SEA (Malacca Straits), Western Sea of Sumatera, Southern Sea of Java, Java Sea, Karimata Straits, Makassar Straits, Banda Sea, Halmahera Sea, Sulawesi Sea, Papua Sea and Aru sea. For the tuna, exclusively they populated the eastern Indonesian water, the Halmahera and Banda Sea.
Conclusion
According to Revealed Comparative Advantage (RCA), Indonesian tuna competitiveness was weaker than the Philippines. The latter had produced most fovourable tuna, because of it nutritious and supple flesh. Based on Constant Market Share Analysis (CMSA) the weakness was due to relative higher growth of export dominated by commodities factors. Indonesian tuna has been favored among ASEAN countries because of the taste and high quality. On the scale effect and commodities composition, it has higher competitive advantage than other ASEAN countries. Indonesia gained third position after the Philippines and Vietnam. It was higher than Malaysia, Singapore and Thailand.
The result of gravity model explained factors influenced tuna trading among ASEAN countries. . For the Revealed Comparative Advantage (RCA) model was better to use random models effect. As for the Constant Market Share (CMS) model the pooled least squares model was better. Factors influenced revealed comparative advantage (RCA) were GDPi, GDPj, POPi, POPj and Export, with exception the distance. Each significant value was below 5%. So did Constant Market ShareAnalysis (CMSA) all independent variables -GDPi, GDPj, POPi, POPj, Distance, and Export were significantly affected.
Despite the expectation that in 2015, Indonesian tuna export will increase, but the rise in exports was not able to improve competitiveness, because it is still dependent on imports although at certain seasons, however, the level of imports will dominate the Indonesian market; and that would lower competitiveness.
South East Asia is the world largest tuna producers. Cooperation in the fishery sector among ASEAN countries must be built and strengthened. One of the strategies is by establishing an integrated economic development that specifically focuses on developing tuna industry center that closed to the fishing ground, with reasonable infrastructure, such as Fish Processed Industry, Fish landing Flat form, Cold Storage, etc. There must be an agreement and commitment among ASEAN economic community as the force in identifying all opportunities, challenges, and weaknesses that confronted them. Then they must be able to formulate strategies for development in marine sector that might work efficiently and effectively for Indonesia. To encourage more tuna trading among ASEAN countries, improve product competitiveness, cooperation for sustainable management of tuna fisheries, and strengthen and build alliances in dealing with regional and international issues.
12 References
[Anonimus]. 2011. Indonesia Minta UE Kaji Ulang Kuota Ekpsor Tuna. AntaraNews.Com. http:/www.antaranews.com/print/1173678500. [Tanggal diakses, 23 Januari 2012]. [Deperind]. Departemen Perindustrian. 2009. Roadmap Pengembangan Industri Pengolahan Hasil
Laut. Jakarta: Direktorat Jenderal Industri Agro dan Kimia.
[FAO]. Food and Agriculture Organization, 2000. FISHSTAT Plus: Universal Software for Fishery Statistical Time Series, Version 2.3. Fisheries Department, Fishery Information, Data and Statistics Unit. Available online at www.fao.org/fi/statist/FISOFT/FISHPLUS.asp [FAO]. Food and Agriculture Organization, 2001. Multilateral Trade Negotiations on Agriculture:
A Resource, Manual I, Module 1. Rome : Food and Agriculture Organization of The United Nations.
[FAO]. Food and Agriculture Organization, 2011a. FishStatJ
[FAO]. Food and Agriculture Organization, 2011b. Food Outloook. Global Market Analysis. Edisi Juni 2011
[KKP]. Kementerian Kelautan dan Perikanan, 2010. Rencana Strategis Kementerian Kelautan dan Perikanan 2010-2014
[KKP]. Kementerian Kelautan dan Perikanan, 2011. Kebijakan Importasi Ikan. Direktur Jenderal Pengolahan dan Pemasaran Hasil Perikanan (P2HP) Kementerian Kelautan dan Perikanan Republik Indonesia. Bahan disampaikan pada Rapat Dengar Pendapat Ditjen P2HP dengan Komisi IV DPR-RI pada Taggal 25 Oktober 2011.
[SIABE]. Sistem Informasi Agroindustri Berbasis Ekspor, Bank Indonesia. 2011. Diakses di http://www.bi.go.id/sipuk/id/?id=3
[UNComtrade]. United Nations Commodity Trade Statistics Database, 2011. http://unstats.un.org/unsd/trade/imts/anntotpubs.htm [Diakses tanggal 14 Desember 2011].
Abdul Kohar Muzakir, 2001, Optimasi Keuntungan Usaha Penangkapan Ikan Tuna di Indonesia (Studi Ksus di PT Perikanan Samudra, Benoa, Bali), Laporan Hasil Penelitian, Fakultas Perikanan dan Ilmu Kelautan Universitas Diponegoro, Semarang.
Alder, Jackie and Reg Watson. 2007. Fisheries Globalization : Fair Trade or Piracy?. In Globalization : Effect on Fisheries Resources Edited by William W. Taylor, Michael G. Schechter and Lois G. Wolfson. Cambrige University Press. Page 47-74.
Cahya Indry Nilan. 2010. Analisis Daya Saing Ikan Tuna Indonesia di Pasar Internasional. Bogor: Departemen Agribisnis Fakultas Ekonomi dan Manajemen Institut Pertanian Bogor.Chen, N. 2004. Intra-national versus international trade in the European Union: Why do national borders matter? Journal of International Economics, 63, pp.93-118.
Deardorff, V.A. 2995. Determinants of Bilateral Trade : Does Gravity Work in a Neoclassic World ?. NBER working Paper No 5377.
Gates Carolyn L., Phuong Le Quoc, Maidir Imelda. 2007. International Trade Policy Analysis: A Handbook of Applied Metdholologies with Case Studies from Indonesia and East Asia. Jakarta: The European Union-Indonesia Trade Support Programme.
Hemkamon, Kanwana., (2007), Determinants of Trade and Invsment in Southeast Asia: An Application of the Gravity Trade Model, Thesis Ph. D, Departement of Economics, School of Social Sciences, The University of Birmingham.
Kijboonchoo, T. And Kalayanakupt, K. 2003. Comparative Advantage and Competitive Strenght of Thai Canned Tuna Export in the World Market: 1982-1998. ABAC Journal, 23, (1).Lindert, Peter H. and Charles P. Kindleberger, International Economics, Eigth Edition, Richard D. Irwin, Inc., 1986, hlm. 80.
13
Nazzaruddin. 1993. Komoditi Ekspor Pertanian: Perikanan dan Peternakan. Jakarta: Penebar Swadaya.
Putthipokin, P. 2001. An Analysis of Comaparative Advantage of Thailand Canned Tuna Industry. Thesis. Kasetsart University.
Utkulu, Utku and Seymen, Dilek., 2004, Revealed Comparative Advantage and Competitiveness: Evidence for Turkey vis-à-vis the EU/15, http://www.etsg.org/ETSG2004/Papers/ seymen.pdf. [Tanggal diakses, 23 Januari 2013].
Yuniarti, Dini. 2007. Analisis Determinan Perdagangan Bilateral Indonesia Pendekatan Gravity Model. Jurnal Ekonomi Perdagangan Volume 12 Nomor 2, Agustus 2007. Halaman 99-109.