LAND COVER CLASSIFICATION USING A UAV-BORNE SPECTROMETER
Sowmya Natesana, Guy. Benarib, Costas Armenakisa*, Regina Leeb
a
Geomatics Engineering, GeoICT Lab, bSpace Engineering Department of Earth and Space Science and Engineering
Lassonde School of Engineering, York University 4700 Keele St., Toronto, Ontario, M3J 1P3 Canada
{sowmy}{gbenari}{armenc}{reginal}@yorku.ca
Commission I, ICWG I/II
KEY WORDS: UAV, Spectrometer, Calibration, Spectral Exposure, Land Cover
ABSTRACT:
Small fixed wing and rotor-copter unmanned aerial vehicles (UAV) are being used for low altitude remote sensing for thematic land classification and precision agriculture applications. Various sensors operating in the non-visible spectrum such as multispectral, hyperspectral and thermal sensors can be used as payloads. This work presents a preliminary study on the use of unmanned aerial vehicle equipped with a compact spectrometer for land cover type characterization. When calibrated, the measured spectra by the UAV spectrometer can be processed and compared reference data to generate georeferenced reflection spectra enabling the identification, classification and characterization of land cover elements. For this case study we used a DJI Flamewheel F550 hexacopter and the FLAME-NIR spectrometer for hyperspectral measurements. The calibration of the spectrometer is described as well the approach to determine its spatial footprint. The spectrometer spectral exposure labeled ground point can be used to determine the land cover classification. Preliminary results of a case-study are presented.
* Corresponding author
1. INTRODUCTION
There is an increase use of small UAV platforms for low altitude remote sensing for thematic land classification and precision agriculture. Usually light weight multispectral, hyperspectral and thermal imaging sensors are used. Nebiker et al., 2016 and Sona et al., 2016 have investigated the performance of new light-weight multispectral sensors for micro UAV and their application in agronomical research and precision farming applications. Berni et al., 2008 used lightweight multispectral and thermal imaging sensors for remote sensing vegetation from UAV platforms. Thermal imager and hyperspectral sensor in visible-NIR bands have been used on fixed wing and quadcopter platforms (Buettner and Roeser, 2013; Chrétien et al., 2015). UAS hyperspectral imagery has been used for leaf area index estimation (Kalisperakis et al., 2015; Proctor and He, 2015), while UAS thermal images have been used to monitor stream temperatures (Jensen et al., 2012) and roof heat losses (Zhang et al., 2015).
Recently we see increasing-use of UAV-borne spectrometers, which are now becoming lighter and more compact. Burkart et al., 2014 synchronized a UAV-borne spectrometer with a ground one to investigate the fast airborne acquisition of hyperspectral measurements over large areas as an useful complement for conventional field spectroscopy. A UAV spectrometer system carried on an octacopter UAV has been developed as part of a multi-sensor approach for multitemporal assessment of crop parameters (Burkart, 2015). A lightweight unmanned aerial vehicle (UAV)-based spectrometer system was employed to measure water reflectance measured and assesses environmental impacts (Zeng et al., 2017). Bareth et al., 2016 used a spectrometer to compute the NDVI for agronomic applications while Suomalainen et al., 2015 developed a new
method to measure reflectance factor anisotropy using a pushbroom spectrometer mounted on a multicopter UAV. A combination of multi-spectral cameras, and visible-NIR and NIR spectrometers onboard UAV allow for high spectral and spatial resolution to enhance the level of details for land cover maps (Mancini et al., 2016).
A spectrometer measures the spectral signatures of all features within the sensor's field of view by analysing the spectral characteristics of light radiation and breaking down the incoming energy into different wavelengths. While the optical, multispectral and hyperspectral cameras capture several bands of the electromagnetic spectrum and have area coverage of lxw pixels the spectrometer’s footprint is only one pixel determined by its field of view but it has high spectral resolution and capture well the reflectance. In this work we use the UAV RGB images to provide the geospatial data, i.e., sensor exterior orientation and orthoimagery, to determine the position and the footprint of the UAV-borne spectrometer.
2. SYSTEM DESCRIPTION
balanced by mounting the battery for the UAV flight on the gear and on the opposite side from the payload and mount. Sliding the battery mount along the rails of the landing gear allowed the UAV to be properly balanced prior to flight.
The FLAME-NIR spectrometer was fitted with an Ocean Optics 74-DA collimating lens at the entrance slit for gathering incident light. It weighs 265 g and operates in the 927 nm to 1658 nm region, with spectra resolution is less than 10 nm, thus obtaining hyperspectral measurements. This lens has a focal length of 5 mm and a diameter of 10 mm, corresponding to a field of view of 5° x 2.5° due to the slit size of 1 mm x 25 µm. Optical imagery was gathered using the Raspberry Pi camera module version 2.1, which consisted of a sensor with a rectangular 62.2° x 48.8° field of view with a focal length of 3.04 mm.
Figure 1. UAV system consisting of DJI Flamewheel F550 with mounted FLAME-NIR spectrometer and Raspberry Pi board
and camera module payload.
3. CALIBRATION OF THE SPECTROMETER
The radiometric calibration of NIR spectrometers involves relating the energy received by the instrument to the number of detector counts measured by the detector electronics of the instrument. In order to properly relate these quantities, an in-lab calibration was performed using the FLAME-NIR, a calibrated light source, and an off-axis parabolic mirror (OAP) as shown in Figure 2.
Figure 2. Laboratory setup of spectrometer radiometric calibration.
The OAP is used to collimate the light from the lamp in the direction of the spectrometer. The spectrometer is placed on a rotation stage that is located in the path of the collimated light. The rotation stage is used to rotate the spectrometer so that its optics are perpendicular to the collimated light. Initially, the instrument settings, such as exposure time, are set to high values in order to saturate the instrument in order to easily detect that the instrument reaches the correct orientation as it is rotated. The data from the spectrometer is monitored as it is
rotated using the rotation stage to ensure that all the pixels of the detector reach maximum saturation. At the point that all the pixels reach maximum saturation, the instrument is properly aligned relative to the collimated light and the calibration can be performed. While the calibration process is being performed, non-reflective black foil is used to surround the lamp and mirror in order to reduce the effect of stray on the calibration. The use of a calibrated lamp and off-axis parabolic mirror for collimation is a common technique for the calibration of infrared detectors, as described in (Holst, 2008).
Once the spectrometer was in the correct orientation, data was collected using the spectrometer at a series of instrument settings at which two criteria were met.
-the instrument was not saturated at all pixels.
-the number of counts on the detector was distinguishable from background noise signal at all pixels
The calibration equations used are based on the assumption that the irradiance M of the ORIEL SN7~1993 calibrated lamp can be treated as a point source. The irradiance of the lamp is provided by Newport at a distance l=50 cm, which is then adjusted using the inverse square law to the reflected focal length RFL of the OAP mirror, as this the distance between the lamp and the centre of the mirror in the experimental setup. Further scaling of the irradiance is then performed to take into
account the reflectance α_OAP of the OAP mirror, which is a function of wavelength, and the angle θ between the OAP
mirror and the spectrometer field of view (FOV). The irradiance is then converted to energy by multiplying it by the exposure time setting of the instrument.
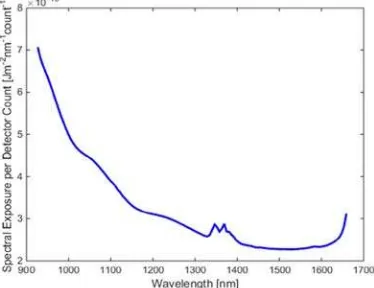
In order to perform radiometric calibration, the power from the lamp was reduced to 250 W, 500 W, and 750 W in order to be able to acquire sufficient quantities of data at different exposure time settings. The irradiance of the lamp was assumed to scale linearly with reduced power, i.e. the irradiance curve of the lamp was scaled by the ratio of output power over 1000 W. For each data set, 1000 spectral measurements were made with the FLAME-NIR, resulting in a total of 8 data sets. 6 data sets were acquired at varying exposure times but with a lamp output power of 250 W, while the remaining data sets were acquired with a lamp output power of 500 W and 750 W respectively. A spectral exposure per detector count conversion function was computed for the FLAME-NIR and is shown in Figure 3. The conversion function shown in Figure 3 is the mean of all the conversion functions computed for each measurement of each data set.
4. DATA AND PROCESSING
4.1 Camera locations
The test area was about 200 m x 100 m. A total of 294 images of 2592 x 1944 resolution were processed using Agisoft PhotoScan (Agisoft, 2017). The flying height was about 40 m above ground. Camera calibration was included in the adjustment solution. The exterior orientation parameters of 268 images were estimated using bundle adjustment based on a local reference system defined by the ground control points. The control points RMSE were 3.5, 2.6 and 3.5 cm respectively in X, Y and Z. One check point was used with error 3.5 cm in X, 2.2 cm in Y and 3.5 cm in Z respectively. A very dense DSM was generated with 853 points/m2. The final orthoimage mosaic was generated at 2 cm spatial resolution. Figure 4 shows the image locations plotted on the orthoimage mosaic.
Figure 4. Orthoimage mosaic and camera locations.
4.2 Spectrometer footprint
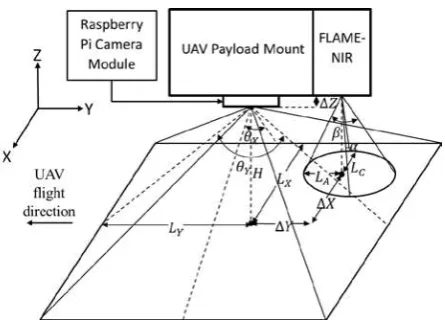
In order to use the spectrometer data for analysis, the location of the spectrometer FOV relative to the camera FOV was determined by analyzing the geometry of the camera and spectrometer in the mounting system, as shown in Figure 5.
Figure 5 shows the relative geometry of the Raspberry Pi camera module and FLAME-NIR spectrometer along with their respective rectangular and elliptical fields of view. The centre of the field of view of the FLAME-NIR is offset from the centre of the camera image by offsets ∆X, ∆Y, and ∆Z, which are measured values from the design of the mounting system.
Angles θX and θY are the Raspberry Pi field of view angles of
62.2° and 48.8° respectively, while α and β are the spectrometer
field of view angles of 2.5° and 5° respectively due to the 74-DA lens. The height H of the camera above the ground is used to determine the lengths on the ground imaged by both the camera and spectrometer lenses in each direction due to the non-uniform fields of view.
Based on the linear offsets s between RGB camera and FLAME NIR, exterior orientation parameters of the RGB images, and the FLAME NIR optical geometry the location and coverage of the ellipse shape footprint of the spectrometer were determined (Fig. 6). Regarding the orientation angles, the kappa angle was used to determine the orientation of the major axis of the spectrometer’s footprint ellipse while the impact of omega and
Figure 5. Side view of FLAME-NIR spectrometer and Raspberry Pi camera payload geometry.
Figure 6. Location of the spectrometer footprints.
phi angles was not considered at this time due to their small magnitude and the small flying height above ground.
4.3 Spectrometer spectral exposure
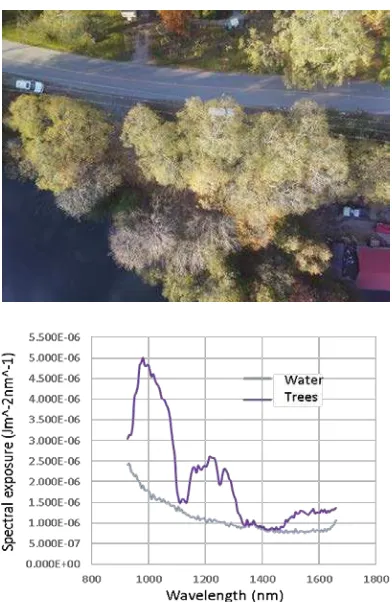
For the spectrometer ground ellipse the spectral exposure /wavelength graphical representations were generated. The labelling of the spectral exposure was based on the visual inspection of the RGB corresponding image. Figure 7 shows the spectral graph plot for various tree land coverages. Figure 8 shows a water image and the water spectral exposure.
Figure 8. Spectral exposure of water based on the spectrometer’s footprint ellipse.
Figure 9. Spectral exposure signatures of Tree and Water classes.
Training samples of land cover elements can be identified based on homogeneous footprint coverage (e.g., Fig. 8) as the various land cover types can be distinguished based on their spectral exposure graphs (Figure 9). Then the spectrometer graphical representations for all ellipse footprints can be compared (matched) to the training samples of the graphical representations and their centres are labelled, thus generating a set of land cover irregular points. To achieve continuous ground coverage a grid is superimposed on the area and the grid centres are labelled by applying spatial interpolation from the irregularly distributed labelled spectrometer points.
5. CONCLUSIONS AND OUTLOOK
This work presents the use of a lightweight compact UAV spectrometer for land cover classification. A bundle adjustment was used on the UAV RGB data to determine the camera locations which together with the lever arm geometry between the camera and the spectrometer sensors and the viewing geometry of the spectrometer determine the ellipse shape ground footprint of the spectrometer. The spectral exposure at each footprint generates spectral signatures of the land cover types which can be used for thematic land cover classification. Future work will cover the training footprint samples, an automated spectral exposure matching process, the continuous land cover, and its accuracy assessment.
ACKNOWLEDGEMENTS
This work is financially supported by the Natural Sciences and Engineering Research Council of Canada (NSERC) and York University.
REFERENCES
Agisoft, 2017. Agisoft PhotoScan, http://www.agisoft.com/.
Bareth G, A Bolten, M L Gnyp, S. Reusch, J Jasper, 2016. Comparison of uuncalibrated RDBVI with spectrometer-based NDVI derived from UAV sensing systems on field scale. The International Archives of the Photogrammetry, Remote Sensing and Spatial Information Sciences, Volume XLI-B8, XXIII ISPRS Congress.
Berni J, P Zarco-Tejada, L Surez, V. González-Dugo, E Fereres, 2008. Remote sensing of vegetation from UAV platforms using lightweight multispectral and thermal imaging sensors. Proc. 37th Int. Archives Photogram., Remote Sens. Spatial Inf. Sci., pp. 1–6.
Buettner A, H P Roeser, 2013. Hyperspectral remote sensing with the UAS STUTTGARTER ADLER: challenges, experiences and first results. International Archives of the Photogrammetry, Remote Sensing and Spatial Information Sciences, Volume XL-1/W2.
Burkart A, 2015. Multitemporal assessment of crop parameters using multisensorial flying platforms. Dissertation, University of Bonn, 79p.
Chrétien L-P, J Théau, P Ménard, 2015. Wildlife multispecies remote sensing using visible and thermal infrared imagery acquired from an unmanned aerial vehicle (UAV). UAV-g 2015 - International Archives of the Photogrammetry, Remote Sensing and Spatial Information Sciences, XL-1/W4: 241–248.
Holst G C, 2008. Testing and Evaluation of Infrared Imaging Systems, 3rd ed., WinterPark, Florida: JCD Publishing.
Jensen, A M, B T Neilson, M McKee, Y Chen, 2012. Thermal remote sensing with an autonomous unmanned aerial remote sensing platform for surface stream temperatures. IGARSS, pp. 5049–5052.
Kalisperakis I, Ch. Stentoumis, . Grammatikopoulos, K Karantzalos, 2015. Leaf area index estimation in vineyards from UAV hyperspectral data, 2D image mosaics and 3D canopy surface models. UAV-g 2015 International Archives of the Photogrammetry, Remote Sensing and Spatial Information Sciences, XL-1/W4:299-303.
Mancini A. E Frontoni, P Zingaretti, 2016. A multi/hyper-spectral imaging system for land cover/land use using unmanned aerial systems. IEEE International Conference on Unmanned Aircraft Systems (ICUAS), Arlington, VA, USA, pp. 1148-1155.
Nebiker S, N Lack, M Abacherli, S Landerach, 2016. Light-weight multispectral UAV sensors and their capabilities for predicting grain yield and detecting plant diseases. International Archives of the Photogrammetry, Remote Sensing and Spatial Information Sciences, Volume XLI-B1, XXIII ISPRS Congress.
Proctor C, Y He, 2015. Workflow for building a hyperspectral UAV: Challenges and opportunities. UAV-g 2015 International Archives of the Photogrammetry, Remote Sensing and Spatial Information Sciences, Vol. XL-1/W4:415-419.
Sona G, D Passioni, L Pinto, D Pagliari, D Masseroni, B Ortuani, A Facchi, 2016. UAV multispectral survey to map soil and crop for precision farming applications. International Archives of the Photogrammetry, Remote Sensing and Spatial Information Sciences, Volume XLI-B1, XXIII ISPRS Congress.
Suomalainen J, P Roosjen, H Bartholomeus, J Clevers, 2015. Reflectance anisotropy measurements using a push-broom spectrometer mounted on UAV and a laboratory goniometer – preliminary results. UAV-g 2015 International Archives of the Photogrammetry, Remote Sensing and Spatial Information Sciences, XL-1/W4:257-259.
Zeng C, M Richardson, D J King, 2017. The impacts of environmental variables on water reflectance measured using a lightweight unmanned aerial vehicle (UAV)-based spectrometer system. ISPRS Journal of Photogrammetry and Remote Sensing, 130 (2017) 217–230.