HIGH RESOLUTION POLSAR IMAGE CLASSIFICATION BASED ON GENETIC
ALGORITHM AND SUPPORT VECTOR MACHINE
P. X. Li a, , W. D. Sun a, J. Yang a, L. Shi a, F. K. Lang a, W. Jiang a
a
The State Key Laboratory of Information Engineering in Surveying, Mapping and Remote Sensing of Wuhan University, 430079, No.129 Luoyu Road, Wuhan, P. R. China -
KEY WORDS: PolSAR, Classification, Feature Selection, GA, SVM
ABSTRACT:
This paper focuses on backscattering mechanisms selection and supervised classification works for CETC38-X PolSAR image. Thanks to the high radar resolution, many classes of man-made objects are visible in the images. So, land-use classification becomes a more meanful application using PolSAR image, but it involves the selection of classifiers and backscattering mechanisms. In this paper we apply SVM as the classifier and GA as the features selection method. Finally, after we find the best parameters and the suitable polarimetric information, the overall accuracy is up to 97.49%. The result shows SVM is an effective algorithm compared to Wishart and BP classifiers.
E-mail address: [email protected] 1. INTRODUCTION
Thanks to the high radar resolution, now many classes of man-made objects, as well as vegetation and ground, are visible in PolSAR images so that PolSAR image classification is more significant. But unfortunately, previous works have shown us the problems of SAR image processing are far from being solved by a gain in resolution. Obviously, the high resolution helps discriminate small objects, but it creates new problems (Tison, 2004). So there requires a high robustness classifier. In the previous research, SVM (Support Vector Machine) is a good algorithm for classification and regression which is based on SRM (Structural Risk Minimization). In the recent literatures, it has been used for many fields, for instance, matching of SAR images and optical images (Hui, 2004), SAR image target recognition (Xue, 2005).
As we know, the 4-D coherency T4 matrix and the covariance C4 matrix are proposed in order to describe distributed targets, which can reduce to 3-D matrices for the reciprocity constrains. From T3 or C3, we can extract a lot of backscattering mechanism information based on polarimetric target decompositions. Intuitively, we try to obtain more helpful features to improve the classification accuracy, but the complicated relationships among them are always harmful. And thus we can first select the most useful backscattering features before classification. As a classical heuristic algorithm, GA (Genetic Algorithm) is routinely used to generate solutions to optimization and search problems (GoldBerg, 1989). In this paper, we simply utilize this algorithm to select features to enhance the subsequence classification accuracy.
2. METHODS
2.1 Support Vector Machine
In machine learning, SVM, also named support vector nerworks (Cortes, 1995), are supervised learning models with associated learning algorithms that analyze data and recognize patterns, used for classification and regression analysis.
For simplicity, let us first consider a supervised binary classification problem. Let us assume that the training set consists of
N
vectorsx
i
d(
i
1, 2,
,
N
)
from thed-dimensional feature space X . To each vector
x
i , we associate a targety
i
{ 1, 1}
. The linear SVM classification approach consists of looking for a separation between the two classes inX
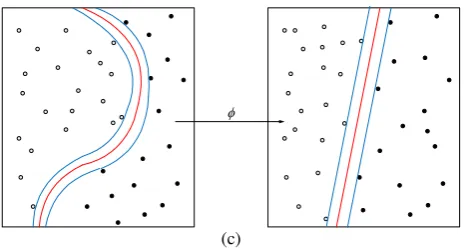
by means of an optimal hyperplane that maximizes the separating margin. In the nonlinear case, which is the most commonly used as data are often linearly nonseparable, they are first mapped with a kernel method in a higher dimensional feature space '( )
d( '
)
X
d
d
. Themembership decision rule is based on the function
sign f x
[ ( )]
, wheref x
( )
represents the discriminant function associated with the hyperplane in the transformed space and is defined as* *
( )
( )
f x
w
x
b
(1)The optimal hyperplane defined by the weight vector
w
*
d'and the bias
b
*
is the one that minimizes a cost functionX1
X2
H1
H3
H2
X1
X2
2 w Maxinum-margin
hyperplane
(c)
Figure 1. Discriminant hyperplane, (a) H1 does not separate the classes, H2 does, but only with a small margin, H3 separates
them with the maximum margin. (b) Maxinum-margin hyperplane and margins for an SVM trained with samples from
two classes, samples on the margin are called the support vectors. (c) Kernel machine for nonlinear classification.
that expresses a combination of two criteria,namely: 1) margin maximization and 2) error minimization. It is expressed as
2
This cost function minimization is subject to the constrains
(
( )
) 1
,
1, 2,
,
where
iare the so-called slack variables introduced to account for nonseparable data. The contantC
represents a regularization parameter that allows to control the shape of the discriminant function and, consequently, the decision boundary when data are nonseparable. The above optimization problem can be The final result is a discriminant function conveniently expressed as multipliers
i, which define the so-called support vectors. The kernel function we use is the Gaussian function2
( , )
iexp(
i)
K x x
x
x
(9)where
represents a parameter inversely proportional to the width of the Gaussian kernel.The basic SVM takes a set of input data and predicts, for each given input, which of two possible classes forms the output, making it a binary classifier. To apply on multi-classification, different multi-classification strategies can be adopted. Here we adopt one-against-one voting strategy.
2.2 Genetic Algorithm
GA is a search heuristic that mimics the process of natural evolution in the computer science field of artificial intelligence. It finds applications in a large of fields, such as engineering, chemistry, bioinformatics.
There have three main operations: 1) selection operation selects better individuals to keep down based on their fitness, 2) crossover operation recombines individuals according to a certain probability, 3) mutation operation keep the diversity of population, but its possibility must not be set too large.
In a genetic algorithm, a population of individuals to an optimization problem is evolved towards better solutions. Each individual has a set of chromosomes which can be mutated and altered. At first, individuals were represented only in binary overall accuracy. The more fit individuals are more possible to preserve to next generation, and according to a certain probability, individuals are also probable to be recombined and randomly mutated, so finally there form a new generation. Until either the maximum number of generations or a satisfactory fitness level is achieved, the evolution stops. The best individual in the last generation is just what we want.
direction. The original image size is 2048x2048 pixels and the 5x5 pixels multi-look process is given to reduce the speckle noise, in Fig.2 (a); in Fig.2 (b), there are total five classes, respectively corresponding to paddy in different growth stages.
(a)
(b)
Figure 2. PolSAR image of Paddyland in Linshui City, (a) Pauli based on PolSAR image: red for |HH-VV|, green for 2|HV|, and blue for |HH+VV|. (b) Ground truth region of total five classes.
3.2 Cross Validation
Here SVM is used to achieve multi-classification. 30 samples of each class are randomly got as a training set. Applying SVM and Gaussian function, there are two parameters need to set: Gauss kernel
and penalty factorC
. Setting them different values, the classification accuracy probably changes dramatically, which shows in Fig.3 (a)-(c). We use the Cross Validation (CV) algorithm to obtain the best
andC
. The final experiment results show the best
andC
are 0.03125and 445.7219, and the corresponding accuracy is 93.17% in Fig.3 (d).
3.3 Features Selection
After finding
andC
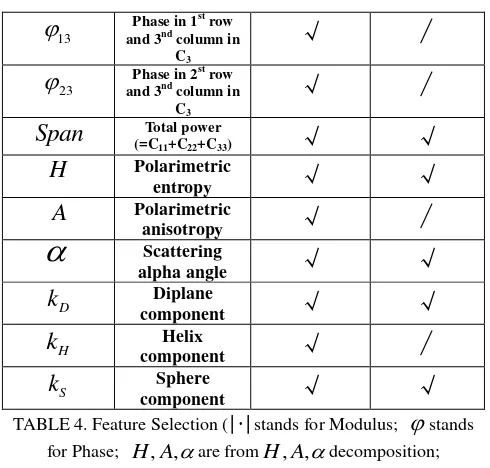
, the next issue is multi-backscattering mechanisms selection. We utilize GA to select backscattering features. Coded binary form makes each gene in chromosomes stands for the existence of a feature. The overall classification accuracy is treated as fitness. The number of individuals and evolution generations are 30 and 100. In Fig.3 (e) and (f), it shows that the suitable features improve the classification accuracy to 97.49%. TABLE 4 lists the features which we usein the beginning and which we select later.
(a) (b)
(c) (d)
(e) (f)
Figure 3. The influences of different combinations of
andC
, (a)
=1 andC
=10, accuracy is 65.33%. (b)
=0.1 andC
=300, accuracy is 87.50%. (c)
=0.5 andC
=30, accuracy is 60.02%. (d)
=0.03125 andC
=445.7219, accuracy is 93.17%. (e) Select suitable features to classify paddy, accuracyis 97.49%. (f) GA race evolutionary curve.
Features Description beginning selection
11
C
Modulus in 1row and 1ndst column in C3√
√
22
C
Modulus in 2row and 2ndst column in C3√
√
33
C
Modulus in 3row and 3ndst column in C3√
√
12
C
Modulus in 1row and 2ndstcolumn in C3
√
√
13
C
Modulus in 1st
row and 3nd column in C3
√
√
23
C
Modulus in 2row and 3ndstcolumn in C3
√
∕
12
Phase in 1st row and 2nd column inC3
√
∕
Paddy1
Paddy2
Paddy3
Paddy4
13
k
k
k
are based on Krogager decomposition. )3.4 Contrast Results
In this section, we compare SVM classifier with another two classifiers: Wishart and BPNN (back-propagation neural network), the classification results are in Fig.5 and TABLE 6.
In the previous research, literature (Lee, 2009) derived the complex Wishart measurement to classify PolSAR images. But the Wishart measurement does not work well in very high resolution SAR images. The supervised Wishart classification result is obtained in Fig.4 (c) and the overall classification accuracy is 74.85%. Obviously, the Wishart classifier utilizes the covariance matrix and coherence matrix directly, but the physical decomposition results are omitted. On the other hand, the results display that the BP classifier also performances not very well in this data set. Among the three, only the overall accuracy from SVM classifier is good enough.
(a)
(b)
(c)
Figure 5. Contrast of three classifiers, (a) SVM classifier, accuracy is 97.49%, kappa is 0.9641. (b) BPNN classifier, accuracy is 70.12%, kappa is 0.5887. (c) Wishart classifier,
accuracy is 74.85%.
TABLE 6. Confusion matrix of SVM and BPNN, (a) Confusion matrix of SVM. (b) Confusion matrix of BPNN.
4. CONCLUSIONS
technology, we can observe many man-made objects in PolSAR images in recent years, and this brings PolSAR image classification tasks. Though the coherency T3 matrix and the covariance C3 matrix include a large number of polarimetric information, the blend information is useless to analysis targets precisely. So we need to extract different kinds of information based on polarimetric target decompositions. But how to effectively make use of these features, it is still an unresolved problem.
This paper introduces GA and SVM to high resolution PolSAR image classification. Firstly, we expound the theory of SVM and GA. Then, we verify the effectiveness of this method with the contrast of three classifiers using the CETC38-X Paddyland data set: the Wishart classifier directly use the C3 or T3 matrix, but can not use additional polarimetric information, and thus its overall accuracy is only 74.85%; contrary to Wishart, the BPNN classifier can apply additional information, but theoretically it is probable to fall into local minimum, so its accuracy is not good yet; finally, the SVM classifier gets the best result, as a result of its SRM theory and the use of additional information, the accuracy is up to 97.49%. Experimentally, it is obvious that SVM is a rather effective algorithm to classify high resolution PolSAR images. In future, we will focus on improving the classification capability via integration algorithm.
5. REFERENCES
Cortes, C., Vapnik, V., 1995. Support-Vector Networks. Machine Learning, 20, pp. 273-297.
Goldberg, D., 1989. Genetic Algorithms in Search, Optimization, and Machine Learning. Addison-Wesley Professional, New Jersey, pp. 1-21.
Hui, C., Zheng, S., Yu, Q., Tian, J., Liu, J., 2004. Matching of SAR images and optical images based on edge feature extracted via SVM. IEEE Signal Processing, 2, pp. 930-933. Lee, J., Pottier, E., 2009. Polarimetric Radar Imaging. Chemical Rubber Company, Florida, pp. 265-274.
Tison, C., Nicolas, J., Tupin, F., 2004. A new statistical model for markovian classification of urban areas in high-resolution SAR images. IEEE Transactions on geoscience and remote sensing, 42(10), pp. 2046-2057.
Xue, X., Zeng, Q., Zhao, R., 2005. A new method of SAR image target recognition based on SVM. IEEE Geoscience and Remote Sensing Symposium, 7, pp. 4718-4721.
6. ACKNOWLEDGEMENTS
This work was supported by the National Natural Science Foundation under Grant 60890074 and in part by the National High-Technology R&D Program (863 Program) under Grant 2011AA120404.