FUSION OF HYPERSPECTRAL AND MULTISPECTRAL IMAGE DATA FOR ENHANCEMENT
OF SPECTRAL AND SPATIAL RESOLUTION
Somdatta Chakravorttya and Pallavi Subramaniamb
a
Assistant Professor, Department of Information Technology, Govt. College of Engineering & Ceramic Technology, Kolkata email: [email protected]
b
Research Fellow, Department of Information Technology, Govt. College of Engineering & Ceramic Technology, Kolkata
KEY WORDS: data fusion, spectral re-sampling, band remapping, hyperspectral, multispectral
ABSTRACT:
Hyperspectral image enhancement has been a concern for the remote sensing society for detailed end member detection. Hyperspectral remote sensor collects images in hundreds of narrow, continuous spectral channels, whereas multispectral remote sensor collects images in relatively broader wavelength bands. However, the spatial resolution of the hyperspectral sensor image is comparatively lower than that of the multispectral. As a result, spectral signatures from different end members originate within a pixel, known as mixed pixels. This paper presents an approach for obtaining an image which has the spatial resolution of the multispectral image and spectral resolution of the hyperspectral image, by fusion of hyperspectral and multispectral image. The proposed methodology also addresses the band remapping problem, which arises due to different regions of spectral coverage by multispectral and hyperspectral images. Therefore we apply algorithms to restore the spatial information of the hyperspectral image by fusing hyperspectral bands with only those bands which come under each multispectral band range. The proposed methodology is applied over Henry Island, of the Sunderban eco-geographic province. The data is collected by the Hyperion hyperspectral sensor and LISS IV multispectral sensor.
1. INTRODUCTION
Remote sensing is the science of acquiring reflected energy from an object by sensors, without the sensor being in contact with it. It provides us with data covering various spectral and spatial resolutions. In this study, hyperspectral data is acquired by the Hyperion sensor on board EO-1 satellite and multispectral data by the LISS-IV sensor, covering Henry Island of the Sunderbans province, West Bengal. The hyperspectral spectrum is split into 242 channels or bands with a spectral range of 0.4 to 2.5 mm, covering from visible to SWIR region. LISS-IV multispectral image comprises of 3 bands, the green band (0.52 to 0.59 mm), red band (0.62 to 0.68 mm) and the NIR band (0.76 to 0.86 mm) respectively of the electromagnetic spectrum. The spatial resolution of the multispectral image is 5.8m and hyperspectral image is 30m.
Due to the low spatial resolution of hyperspectral image, mixed pixels originate in hyperspectral pixel and classification of endmembers is difficult, which is a major issue and it has been studied extensively. Pixels which contain spectral signature of only one endmember is known as pure pixels and pixels with more than one endmember is known as mixed pixels (Duran et.al. 2004). We apply algorithms such as spectral unmixing to the data for better endmember detection.
However spectral unmixing does not locate the end members spatially. Therefore we fuse the multispectral and hyperspectral image to obtain an image of higher spatial and spectral resolution, which would result in more accurate end member detection, which is also our motivation for this study.
In the recent past, advanced analytical techniques have been studied for enhancing the hyperspectral spatial resolution. Some of which are non fusion based and some fusion based. In non-fusion based methods the spectral resolution is enhanced by analysing the
hyperspectral data or the pixel reflectance value. Each hyperspectral pixel is divided into subpixels and the fractional abundance of end members are calculated and rearranged (Gary et. al. 2003). The main advantage in this process is, this technique does not require any further information apart from the data available in the hyperspectral image but this method is not efficient when it comes to detailed study of the image or provision for spatially extracting information of objects. The fusion based methods required information from various sensors. Eismann and Hardie, 2002 proposed a maximum a posteriori estimation method. It enhances the spatial resolution of hyperspectral images by applying the features of panchromatic or multispectral images, but in this technique the spatial enhancement is limited to several principal components of the hyperspectral image. Most of the initial research was based on Pan sharpening like PCA based techniques (Licciardi et. al. 2012), CN sharpening, Gram-Schmidth Sharpening (Maurer, 2013 ). These methods basically improve the photo interpretation of the image but they are not efficient for image analysis and spatial study. There also other algorithms based on frequency for enhancement of spatial resolution such as wavelets (Krista, 2007), purely statistical based methods such as spatial distortion optimization (Khan 2009), vector Bi-lateral filtering (Peng, 2009). However the above stated techniques do not consider the band remapping issues of image fusion of hyperspectral and multispectral sensors.
bands. Most of the analytical methods do not consider this issue and ignore this concept. Ignoring this fact may lead to modification of spectral signatures of the fused hyperspectral data due to addition of spectral information from different spectral regions. This study tries to overcome these shortcomings and obtains an image which has spectral signature of the original hyperspectral image and spatial resolution of the multispectral image.
2. OBJECTIVE
This study deals with end member (mangrove species) in the Sunderbans Delta of West Bengal, India by spectrally unmixing the mixed pixels by applying N-FINDR and Linear Spectral Unmixing algorithms to the hyperspectral image and therefore injecting only the spectral sensitive hyperspectral bands into the multispectral band for fusion for accurate retrieval of spectral signatures. The main objective of this study is to fuse the high spatial resolution pixels of the multispectral image with high spectral resolution of the hyperspectral image which would enhance the spatial details of the imagery while preserving its spectral details. The mangrove forests of Sunderbans comprise of highly mixed mangrove species and for its proper mapping and monitoring fused data would enable spatial mapping of pixel locations (mangrove species) of mixed pixels (mixed mangrove patches) with more accuracy.
3. STUDY AREA
As a case study, the pristine mangrove habitats of Henry island (approximately 10 sq.km. in area, extending between 21o36 00 N to 21o34 00 N latitude and 86o16 30 E to 88o18 30 E longitude) of the Sunderban Biosphere Reserve of West Bengal have been selected for the present study. The selection of the study area is based considering the fact that this island is rich in bio-diverse mangrove community with a wide variety of mangrove species that are rare and also endangered.
4. METHODOLOGY
4.1 Acquisition of Data
An EO-1 Hyperion (hyperspectral) image of the study area has been procured from the USGS Earth Resources Observation and Science (EROS) Center through Data Acquisition Request (DAR) on the 27th of May, 2011. A Resourcesat-2, LISS-IV (multispectral image) of the study area (Henry Island, Sunderbans, West Bengal) is also acquired from National Remote Sensing Center(NRSC), ISRO.
4.2 Pre-processing of Data
Atmospheric correction was done on hyperspectral and multispectral data using MODTRAN based FLAASH (Fast Line-of-Sight Atmospheric Analysis of Spectral Hypercubes) algorithm available in the ENVI software. It is observed that FLAASH was highly efficient for atmospheric correction (Chakravortty and Chakrabarti, 2011) of data captured by the Hyperion and LISS-IV sensors. Accurate geo-registration of the hyperspectral and multispectral image has been done with the help of topographic sheets of the study area. Co-registration of hyperspectral and multispectral data was done using the ENVI software for further processing. Minimum Noise Fraction (MNF) has been applied for dimensionality reduction of the hyperspectral data which sufficiently retains the requisite information for successful unmixing in the lower dimension.
4.3 Data Fusion
The accuracy of the end member classification depends on the no. of pure and mixed pixels present in the image (Villa et.al. 2010). The lesser the no. of mixed pixels, better is the accuracy. Unfortunately, most of the hyperspectral pixel are mixed pixels. Therefore, we apply Linear Spectral Unmixing (LSU) (Keshava and Mustard, 2002) on the imagery and derive fractional abundances of the end members. However unmixing does not provide us with information in spatially locating the end members. Hence, we fuse the multispectral and hyperspectral image, to obtain an image having the high spectral resolution of hyperspectral image and high spatial resolution of the multispectral image.
The architecture of the proposed method is discussed as follows: Firstly, we apply the concept of channels remapping or band selection for hyperspectral data, which is discussed in this section further. After selecting hyperspectral channels, we select the end members using NFINDR (Winter,1999) and unmix the endmember
pixel using LSU. We obtain a matrix ‘M’, which is composed of the ‘n’ end member pixel reflectance for each hyperspectral band. The
matrix ‘M’ is derived for the hyperspectral image, which is to be
resampled into multispectral channel model. The resampling process is also discussed in this section further below.
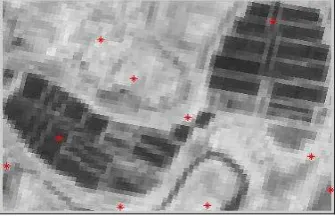
Figure 1. End member selection on the hyperspectral image
Next we apply LSU followed by FCLS, to the resampled spectrum and calculate the endmember abundances. Finally a new high resolution hyperspectral image is retrieved using the result of multispectral unmixing and hyperspectral unmixing (using Eq.1 mentioned below).
Excoecaria Agallochha, Avicennia Alba, Avicennia Marina, Ceriops Decandra, Aquaculture1, Sea Water1, Sea Water 2, Aquaculture 2, Beach
Figure 2. Spectral profile for 10 endmembers from 400 to 2400nm.
The linear spectral unmixing model for mixed pixel of hyperspectral image is the linear combination of the endmembers (Dimitris et. al, 2001).
To obtain the fused image (f), we apply the linear mixing model again:
Xf = Mh am (1)
The matrix Mh (end member matrix of hyperspectral image) is multiplied by the abundance matrix from the multispectral image, and as a result we obtain a new pixel am with l bands. The fused image has the same spatial resolution as the multispectral image.
4.3.1 Band Selection:
As mentioned earlier, the original hyperspectral data has channels covering electromagnetic spectrum range from blue region to SWIR region, whereas multispectral covers just a part of this spectrum, which is green, red and infrared region. While resampling the hyperspectral channels to multispectral channels, extra regions of hyperspectral region gets mapped to the multispectral region. This leads to overlapping of spectrum and the obtained image loses its core aspect. For example, in the NIR region, it is generally observed that the vegetation region of the image is highlighted. In this study we have observed that, on overlapping the entire hyperspectral bands with the multispectral bands, the vegetation region is not very well highlighted and the result has low correlation with the original hyperspectral image. Hence, the multispectral channels fuse details into only those hyperspectral channels which come into the sensitive range of the hyperspectral channels. The fused image has spatial details of the multispectral image while maintaining spectral characteristics of the original hyperspectral data.
4.3.2 Spectal unmixing :
It has been observed that NFINDR algorithm and LSU have shown (Chakravortty, 2013) good results for the study area. We have applied fully constrained linear spectral unmixing to obtain the endmember spectral abundances.
1.1.3 Spectral Resampling : The hyperspectral channels are resampled to the multispectral channel to obtain the resampled
spectral response given by S(ωi):
(5) where, S(ω) is the value of radiance from the hyperspectral sensor at the specific wavelength 'ω' and Ri(ω) response of the ith channel at a wavelength 'ω' (J. Bieniarz , D. Cerra, J. Avbelj, P. Reinartz , R. Muller, 2011). If we discretize these equations then ‘ω’ will be the wavelength of the hyperspectral band and ' ωi' for multispectral band. We assume the spectral response function Ri(ω) to be Gaussian distributed for the multispectral sensor, and we model it as:
(6)
Where, ‘ω’ is the continuous spectrum of hyperspectral image, while
'µi' and 'σ' are the central wavelength and the standard deviation respectively for the ith channel of the multispectral sensor. Hence we calculate the Ri(ω) each ith channel of the multispectral sensor.
5. RESULTS
We tested the above methodology with Hyperion sensor (242 bands before band reduction, 155 subsequently). After band mapping we have 66 bands, i.e., green region has 10 bands, red region has 10 bands, and IR region has 46 bands, according to the multispectral band (green, red and NIR) of the electromagnetic spectrum. We selected 10 types of end members for the hyperspectral image (which includes soil, aquaculture area, apart from the mangrove species). After applying NFINDR, resampling, LSU and FCLS, we obtain an image which has the spectral characteristics of hyperspectral channels (66 channels) and spatial resolution of the multispectral bands (5 meter). Figure 3 shows the fused image (Wavelength ~ 1130 nm) with spatial resolution of the multispectral image.
Figure 3. Original Hyperspectral image (1153nm)
Figure 4. Original Multispectral Image (815 nm)
Figure 5. Fused Image having spatial resolution of multispectral image and spectral resolution of hyperspectral image ( 1130 nm)
Excoecaria Agallochha, Avicennia Alba, Avicennia Marina, Ceriops Decandra, Aquaculture1, Sea Water1, Sea Water 2, Aquaculture 2, Beach
Figure 6. Spectral profile of fused image for 10 endmembers from 500 to 1200 nm
Figure 6 shows the spectral profile of end members identified from the fused image. The end members comprise of mangrove species, water and soil. The spectral profile for the original image starts from 400 nm to 2300nm wavelength range (Figure 2.), whereas the fused
image’s range is from 500 to 1200 (Figure 7.). When we compare the
spectral profile of the two images from the range 500 to 1200nm, we find similarity in the curves. Hence the spectral signature of the image is maintained.
We have meticulously verified the spectral profile and the fused image. Now we measure the accuracy of the resultant image by computing the normalized cross correlation (Kai Briechle et.al,2001) between each pixel in the original hyperspectral image and in the fused image. The processed image is first normalised from external factors such as variation in brightness by subtracting the mean and diving by the standard deviation and then finding the cross correlation between the two images. Normalised cross correlation is given by:
(7)
Where, 'h' is the original hyperspectral pixels', 'f' is the fused image
pixels. 'n' is the no. of measurements or no. pixels. 'h‾' and '‾f' are the
mean of h and f. 'σh' and 'σf' are the standard deviation of the hyperspectral and fused image pixels. The normalized cross correlation was calculated in spectral domain. The spectrum of original hyperspectral image was compared with the spectrum of the fused image. The figure below shows the band vs normalized cross correlation of the fused vs the original pixels.
0 10 20 30 40 50 60 70
0.7 0.75 0.8 0.85 0.9 0.95 1
Figure 7. No. of bands vs Normalized cross correlation between the fused and hyperspectral pixels (for 66 bands)
The above figure shows the normalized cross correlation between the fused pixels and the original hyperspectral pixels. The 10 selected hyperspectral pixel coordinates are the same as that of the fused pixel. The values of normalized cross correlation is always lesser than 1. When the normalized cross correlation values is nearer to 1, it means that the pixels in the band are ideally cross correlated and the values towards 0 means that the pixel are not correlated. Hence ideally the value of normalized cross correlation should be on the higher side of 0.5. Our result (Figure 4.) shows that, all the bands greater than the 15th band, there is precision in the correlation and the bands which are below 15 are still on the greater side of the correlation.
0 50 100 150
0.62 0.64 0.66 0.68 0.7 0.72 0.74 0.76 0.78 0.8
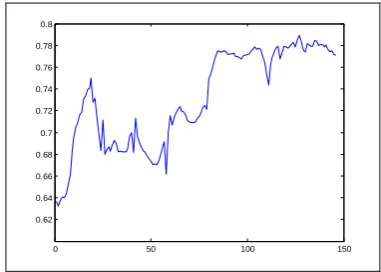
Figure 8. No. of bands vs Normalized cross correlation between the fused and hyperspectral pixels (for 146 bands)
Figure 8 shows the normalised cross corelation between all the bands of the original hyperspectral pixels and the fused image. In this technique we have ignored the band selection process depeding of the multispectral range and we have added various spectrum regions from the hyperspectral bands which is not available on the multispectral sensors. As we can observe the normalised cross correlation for the bands is very less and not as accurate as the fused image with 66 bands. The curve for Figure 9 is not smooth when compared to the Figure 8. Hence it is advisable to consider proper selection of bands and band mapping according the multispectral range for precise result. In order to measure the similarity between the images for each band, we computed a normalized cross correlation in the spatial domain. In Figure 9, we have plotted band vs reflectance of the pixels. There are selected pixels in the image. We have observed that pixels where vegetation is high, the cross correlation between those pixels is high and there is very less variation. The pixels which have soil and water bodies also present in them will have comparatively lesser correlation. The spatial correlation for 66 bands is better than that of fused image with 146 bands.
A single band from the restored image was compared to the same band from the original image using equation 7. The cross correlation in the spatial domain has value above 0.89 in the spatial domain, where 0 and 1 represent respectively uncorrelated measurements and total correlation. From this we can observe that even when that, even when the cross correlation is lower, the main absorption features are preserved and remain clearly distinguishable.
0 10 20 30 40 50 60 70
Figure 9: Spectral Profile of Fused Hyperspectral-Multispectral Data and Original Hyperspectral
6. Conclusion
In this work a method for image fusion of hyperspectral and multispectral data based on spectral unmixing has been proposed. An image with high spatial resolution of 5m and high spectral resolution of 66 bands has been restored from a 30m resolution hyperspectral image with 155 bands and a 5m resolution multispectral image with 3 bands. The hyperspectral bands are selected with respect to the particular band range of the multispectral sensor. Hence the spectral signature of the image is preserved. High values of cross correlation between the images show that both the spectral and the spatial information are well preserved. The algorithm is easy to use and could be employed to increase the spectral information of a multispectral image, given a co-registered hyperspectral image. This procedure can work for sensor with more than one band. In future we can modify the technique to fuse a panchromatic with a hyperspectral image.
Acknowledgement
The corresponding author expresses her sincerest thanks to DST for extending financial support in the form of a Major Research Project on the above study problem.
References
Bieniarz J., Cerra D., Avbelj J., Reinartz P., Muller R., 2011.Hyperspectral Image Resolution Enhancement Based on Spectral Unmixing and Information Fusion". ISPRS.
Briechle K., Uwe and Hanebeck D, 2001. Template Matching using Fast
Normalised Cross Correlation” Proceeding of SPIE, Aero-Sense Symposium, V ol.4387,Orlando, Florida.
Chakravorty S, Chakrabarti S, 2011.Pre-processing of hyperspectral Data: A case study of Henry and Lothian Islands in Sunderban Region, West Bengal, India. International Journal Of Geomatics And Geosciences, Volume 2, No 2, ISSN 0976–4380.
Chakravortty, S., 2013. Analysis of end member d et ec t i on and subpixel classification algorithms o n hyperspectral imagery for tropical mangrove species discrimination in the Sunderbans Delta, India. J. Appl. Remote Sens. 7 (1), 073523; doi:10.1117/1.JRS.7.073523,
Dimitris M., Siracusa C, Shaw G, 2001.Hyperspectral Subpixel Target Detection Using The Linear Mixing Model. IEEE Transactions on Geoscience and Remote Sensing, Vol. 39, No. 7.
Duran O, Petrous M. ,2004. Mixed Pixel Classification in Remote Sensing – Literature Survey, University of Surrey, Guildford
Eismann M. , Hardie R.,2005. Hyperspectral resolution enhancement using high-resolution multispectral imagery with arbitrary response functions.
Geosciences and Remote Sensing, IEEE Transactions on 43(3), pp. 455 – on Sensor Simulation and Vector Decompostion. ISBN no: 978-1-4577-0267-9,
Keshava, Mustard J., 2002. Spectral Unmixing, IEEE Signal Processing Magazine, USA, 19(1),PP 44-57.
Khan M.M. et al.,2009. Pan Sharpening of Hyperspectral Image Using Spatial
Distortion Optimisation”, International Conference on Image Processing, Cario,pp.2853-2856.
Licciardi G. A., Khan M. M., Chanussot J., Montanvert A., Condat L. and Jutten C.,2012.Fusion of Hyperspectral and Panchromatic Images Using Multiresolution Analysis and Nonlinear PCA BAND Reduction, EURASIP Journal on Advances in Signal Processing.
Maurer T. ,2013.How To Sharpen Images Using The Gram-Schmidt Pan-Sharpening Method.International Archives of the Photogrammetry, Remote Sensing and Spatial Information Sciences, Volume XL-1/W1, ISPRS Hannover Workshop, Hannover, Germany.
Shaw G.A, Hsiao-hua and Burke K.,2003. Spectral Imaging for Remote Sensing" Lincon Laboratory Journal, Vol 14, No.1.
Villa, A., Chanussot, J., Benediktsson, J. A., Ulfarsson, M. and Jutten, C, 2010. Super-resolution: An efficient method to improve spatial resolution of hyperspectral images. IGARSS.
Winter M.E,1999. N-FINDR: An Algorithm for Fast Autonomous Spectral Endmember determination in hyperspectral data ., Imaging Spectrometry V, Proc. SPIE 3753, pp266-277.