EFFECTIVENESS OF SPECTRAL SIMILARITY MEASURES TO DEVELOP PRECISE
CROP SPECTRA FOR HYPERSPECTRAL DATA ANALYSIS
Hasmukh Chauhana*, B. Krishna Mohanb
a
Civil Engineering. Department, BVM Engineering College, V.V. Nagar, Gujarat, India- [email protected] b
Centre of Studies in Resources Engineering, Indian Institute of Technology Bombay, Mumbai, India- [email protected]
KEY WORDS: Spectral Similarity Measure, Spectral Discrimination Measure, Hyperspectral, Kappa analysis and Z-statistic.
ABSTRACT:
The present study was undertaken with the objective to check effectiveness of spectral similarity measures to develop precise crop spectra from the collected hyperspectral field spectra. In Multispectral and Hyperspectral remote sensing, classification of pixels is obtained by statistical comparison (by means of spectral similarity) of known field or library spectra to u nknown image spectra. Though these algorithms are readily used, little emphasis has been placed on use of various spectral similarity measures to s elect precise crop spectra from the set of field spectra. Conventionally crop spectra are developed after rejecting outliers based only on broad-spectrum analysis. Here a successful attempt has been made to develop precise crop spectra based on spectral similarity. As unevaluated data usage leads to uncertainty in the image classification, it is very crucial to evaluate the data. Hence, notwithstanding the conventional method, the data precision has been performed effectively to serve the purpose of the present research work. The effectiveness of developed precise field spectra was evaluated by spectral discrimination measures and found higher discrimination values compared to spectra developed conventionally. Overall classification accuracy for the image classified by field spectra selected conventionally is 51.89% and 75.47% for the image classified by field spectra selected precisely based on spectral similarity. KHAT values are 0.37, 0.62 and Z values are 2.77, 9.59 for image classified using conventional and precise field spectra respectively. Reasonable higher classification accuracy, KHAT and Z values shows the possibility of a new approach for field spectra selection based on spectral similarity measure.
1. INTRODUCTION
1.1 Introduction
Spectral similarity measures are effectively used to distinguish among vegetation and background soil (Chang, 2000 and Du et. al, 2004) to distinguish among mineral spectra (Van der meer 2005) and discriminating crop varieties (Kong et al. 2010). Spectral similarity measures can be effectively used to match the similarity among the collected field spectra. To serve the purpose of study three spectral similarity measures are used. The said measures are selected in such a way that they reveal the complete information for spectral similarity. The study uses two deterministic, i.e. i) Spectral distance based and ii) Spectral Angle based and one Stochastic (self-information based) measures. Spectral similarity values among same crop spectra are computed by the three measures and the spectra having larger values are considered as outlier and hence rejected. The effectiveness of the selected spectra to classify the remotely sensed hyperspectral data into required classes is evaluated by spectral discriminatory measures. Therefore, it results into authenticity and precision of comparison. Spectral discriminatory values decide the measure that is best discriminating among the various crop classes in which image is to be classified. Conventionally crop spectra are selected by averaging collected field spectra after rejecting outlier based on spectral shape. However, the effectiveness of the selected spectra to classify the image into required classes is never evaluated in conventional method. Thus the offspring of the present research would create a fresh opportunity for the evaluation of the spectra used to carry out classification. ___________________________________________________
* Corresponding Author
1.2 Novel Contribution from the Study
Outlier rejection addressed through 'training set refinement' conventionally uses divergence, transformed divergence, Jeffries-Matusita distance etc, which uses second order and third order statistics. Hence class separability is measured in training data by second order and third order statistics. Most commonly used classification algorithms such as Minimum distance to means classifier uses mean vector i.e. second order statistics, parallelepiped classifier uses minimum and maximum limits of spectral response i.e. first order statistics and maximum likelihood classifier uses variance, co-variance i.e. only MLC uses same statistics which used for training set refinement conventionally.
Outlier rejection addressed through 'training set refinement' in this study uses the same statistics which is used by classification algorithm. Spectral distance based measure uses the first order statistics hence if spectral distance based measure predict high separability among the classes in which image is to be classified spectral distance based classifier such as Euclidian distance can be used. Spectral angle and Stochastic (self-information) based measures uses the second order statistics. Hence if spectral angle based or stochastic measure predicts high separability among the classes in which image is to be classified spectral angle based classifier such as Spectral Angle Mapper (SAM) or stochastic classifier such as Spectral Information Divergence (SID) can be used. The other outcome of the study is that the user is guided that which classification algorithm is best suited to classify the image into desired classes.
2. DATA USED
Satellite based hyperspectral single date data from Hyperion sensor of 145/45 path/row were acquired. The date of the pass was January 7, 2008 with overpass time 09:22 hrs IST. Hyperion’s level one product which is only radiometrically corrected was distributed by USGS. Out of 242 bands data of Hyperion ranges from 356 to 2577 nm, calibrated 198 bands (band numbers 8-57 & 77-224) were retained for further analysis (Pearlman et. al, 2003). Atmospheric correction needs to be applied before further processing and analysis. Fast Line-of-sight Atmospheric Analysis of Spectral Hypercubes (FLAASH), an efficient correction code for atmospheric correction was applied using ENVI commercial software package (Kruse F.A., 2008). An atmospheric correction removes the effect of atmospheric scattering and absorption features, corrected data contains 168 bands. Acquired Hyperion image covers the regions with central coordinates 20º N latitude and 76.5 º E longitudes are Lonar, Mehekar in Buldhana District of Maharashtra, India. Study area having climate of tropical semi arid with alluvial soil types. The area is fertile having irrigated crops in Rabi season which prolongs October through February. The major crops during Rabi season are chickpea, sorghum and wheat. The minor crops are seasonal vegetables and fruits.
Field observations were carried out concurrent to the satellite pass. The field observations include ground based hyperspectral reflectance using GER 1500 spectroradiometer with GPS locations covering all major crop types. The field observations were taken over 106 sites. The spectroradiometer has a range of 512 channels with a range of 325 to 1075 nm. Gathering spectra at a given location involves optimizing the integration time providing fore-optic information, recording dark current and collecting white reference reflectance. The target reflectance is the ratio of energy reflected off the target (crop) to energy incident on the target (measured using BaSO4 white reference). The reflectance measurements were made from one meter above the crop canopy with the sensor facing the crop and oriented normal to the plant. The readings were taken on cloud free days at around solar before noon local time. While taking the observations, explicit care was taken not to cast shadows over the area being scanned by the instrument.
3. SPECTRAL SIMILARITY AND DISCRIMINATION MEASURES
The effectiveness of three spectral similarity measures was evaluated by two spectral discrimination measures in this study.
3.1 Spectral Similarity Measures
Three spectral similarity measures, i) City Block Distance (CBD),(Chang 2003), ii) Spectral Angle Measure (SAM), determine spectral similarity. For a given hyperspectral pixel vector x = (x1………..,xL)
T
, each component xl represents a
pixel in band image Bl which is acquired by a certain
wavelength
l in a specific spectral range. Let s = (s1,……, sL)T be the corresponding spectral signature (i.e., spectrum) of x where sl represents its spectral signature of xl in the form ofeither radiance or reflectance values.
} channel. The difference vector between two spectral signatures of two pixel vector si and sj can be derived from l1, l2,…. lm spectral similarity metric in remote sensing. It measures spectral similarity by finding the angle between the spectral signatures of two pixel vectors si and sj.
3.1.3. Spectral Information Divergence Measure: The spectral information divergence measure (Chang 2000) calculates the distance between the probability distributions produced by the spectral signatures of two pixels defined as, Eqs. (4)and (5)represent the relative entropy of rj with respect to ri.
3.2 Spectral Discrimination Measure
Spectral discrimination measures were used as objective statistical criteria to evaluate the performance of spectral similarity measures. Probability of Spectral discrimination (PSD; Chang 2003) and the Power of Spectral discrimination (PWSD; Chang 2003) spectral discrimination measures are used to check the effectiveness of spectral measure to classify a set of spectral classes on the basis of a set of spectral library.
discriminatory probabilities of all the spectral signatures in a spectral library or database.
Let {sk}
K
k1
, be the K spectral signatures in the set which can
be considered as a database and t be any specific target spectral signature to be identified using. Probabilities of spectral discrimination of all sk’s in relative to t as follows.
P t,
(k) = m (t, sk) /
L j 1m(t,sj)
for k= 1,……,K (6)
where,
L j1m(t,sj)
is a normalization constant determined by t
and . The resulting probability vector P t,
= (Pt,
(1), Pt,
(2),…….., Pt,
(K))T is called probability of spectral discrimination (PSD) of
with respect to t or spectral discriminatory probability vector of relative to t.3.2.2 Power of Spectral Discrimination (PWSD): Assume that
m(.,.) is any given hyperspectral measure. Let d be the spectral signature of a reference pixel vector and si, sj is the spectral
signatures of any pair of two pixel vectors. The PWSD of m(.,.) denoted by PWSDm(si, sj; d) is defined by,
PWSDm(si, sj; d) = max {m(si ,d)/m(sj ,d),m(sj,d)/m(si ,d)} (7)
More precisely, PWSDm(si, sj; d) selects the discriminatory
power of m(.,.) the maximum of two ratios, ratio of m(si , d) to m(sj , d) and ratio of m(sj , d) to m(si , d). PWSDm(si, sj; d) is 1 if
si= sj and in all other cases larger than 1except for the case in
which two spectra are different and equidistant from a third spectrum. The PWSDm(si, sj; d) defined by eqn. (7) provides a
quantitative index of spectral discrimination capability of a specific hyperspectral measure m(.,.) between two spectral signatures si and sj relative to d. Obviously, the higher the
PWSDm(si, sj; d) is the better discriminatory power the m(.,.) is.
4. RESULTS AND DISCUSSION
4.1 Analysis of Spectral Similarity to select Precise Spectra
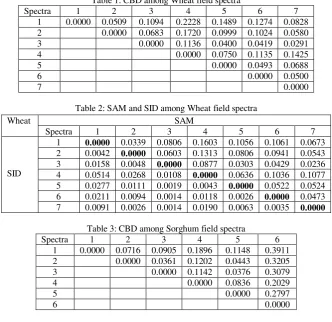
The spectra collected during field study were processed using GER 1500 data acquisition software. Conventionally collected field spectra were averaged after rejecting outlier based on spectral shape for three major crops such as chickpea, sorghum and wheat (Rao et al. 2007). It was identified as field spectra developed conventionally as presented in figure 1(a). To develop precise spectra based on spectral similarity CBD, SAM and SID similarity values were computed among same crop spectra. The spectra having larger values with other spectra of a crop class were considered as outlier and rejected.
Table 1: CBD among Wheat field spectra
Spectra 1 2 3 4 5 6 7
1 0.0000 0.0509 0.1094 0.2228 0.1489 0.1274 0.0828 2 0.0000 0.0683 0.1720 0.0999 0.1024 0.0580
3 0.0000 0.1136 0.0400 0.0419 0.0291
4 0.0000 0.0750 0.1135 0.1425
5 0.0000 0.0493 0.0688
6 0.0000 0.0500
7 0.0000
Table 2: SAM and SID among Wheat field spectra
Wheat SAM
Spectra 1 2 3 4 5 6 7
SID
1 0.0000 0.0339 0.0806 0.1603 0.1056 0.1061 0.0673 2 0.0042 0.0000 0.0603 0.1313 0.0806 0.0941 0.0543 3 0.0158 0.0048 0.0000 0.0877 0.0303 0.0429 0.0236 4 0.0514 0.0268 0.0108 0.0000 0.0636 0.1036 0.1077 5 0.0277 0.0111 0.0019 0.0043 0.0000 0.0522 0.0524 6 0.0211 0.0094 0.0014 0.0118 0.0026 0.0000 0.0473 7 0.0091 0.0026 0.0014 0.0190 0.0063 0.0035 0.0000
Table 3: CBD among Sorghum field spectra
Spectra 1 2 3 4 5 6
1 0.0000 0.0716 0.0905 0.1896 0.1148 0.3911 2 0.0000 0.0361 0.1202 0.0443 0.3205
3 0.0000 0.1142 0.0376 0.3079
4 0.0000 0.0836 0.2029
5 0.0000 0.2797
6 0.0000
Table 4: SAM and SID among Sorghum field spectra
Sorghum SAM
Spectra 1 2 3 4 5 6
SID
1 0.0000 0.0532 0.0736 0.1390 0.0849 0.3199 2 0.0064 0.0000 0.0372 0.0960 0.0389 0.2786 3 0.0083 0.0016 0.0000 0.0948 0.0350 0.2754 4 0.0365 0.0129 0.0145 0.0000 0.0666 0.1887 5 0.0142 0.0019 0.0026 0.0060 0.0000 0.2468 6 0.1324 0.0814 0.0851 0.0297 0.0609 0.0000
Table 5: CBD among Chickpea field spectra
Spectra 1 2 3 4 5 6 7 8 9 10 11 12
1 0.0000 0.1062 0.0278 0.0255 0.0328 0.0223 0.0492 0.0223 0.1248 0.0223 0.2824 0.2176 2 0.0000 0.0876 0.0839 0.1370 0.1234 0.0682 0.0932 0.0396 0.1163 0.2824 0.2176 3 0.0000 0.0161 0.0559 0.0408 0.0251 0.0163 0.1020 0.0387 0.2824 0.2176
4 0.0000 0.0548 0.0412 0.0267 0.0176 0.1020 0.0342 0.2824 0.2176
5 0.0000 0.0160 0.0801 0.0473 0.1558 0.0254 0.2824 0.2176
6 0.0000 0.0655 0.0326 0.1423 0.0168 0.2824 0.2176
7 0.0000 0.0354 0.0770 0.0602 0.2824 0.2176
8 0.0000 0.1116 0.0304 0.2824 0.2176
9 0.0000 0.1352 0.2824 0.2176
10 0.0000 0.2824 0.2176
11 0.0000 0.4998
12 0.0000
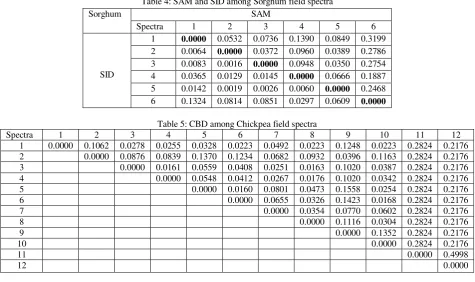
Table 6: SAM and SID among Chickpea field spectra
For table 2, 4 and 6 upper triangle w.r.t. diagonal shows SAM while lower triangle shows SID results. Table 1, 2, 3, 4, 5 and 6 elucidate for wheat - spectra 4, for sorghum-spectra 6 and for chickpea-spectra 11 and 12 having largest CBD, SAM and SID values with all other spectra hence they are considered as outlier and rejected. Average spectra constituted of remaining 6 spectra of wheat, 5 spectra of sorghum and 10 spectra of chickpea, identified as precise field spectra based on spectral similarity as presented in figure 1(b).
Chickpea SAM
S I D
Spectra 1 2 3 4 5 6 7 8 9 10 11 12
1 0.0000 0.0959 0.0251 0.0253 0.0250 0.0175 0.0398 0.0276 0.0977 0.0210 0.2373 0.2197 2 0.0125 0.0000 0.0440 0.0761 0.1171 0.1068 0.0677 0.0867 0.0378 0.0980 0.1667 0.1469 3 0.0007 0.0086 0.0000 0.0178 0.0407 0.0284 0.0202 0.0145 0.0821 0.0298 0.2294 0.2081 4 0.0008 0.0075 0.0003 0.0000 0.0435 0.0325 0.0213 0.0176 0.0779 0.0259 0.2230 0.2022 5 0.0013 0.0206 0.0034 0.0034 0.0000 0.0141 0.0582 0.0401 0.1175 0.0237 0.2555 0.2368 6 0.0006 0.0167 0.0019 0.0019 0.0003 0.0000 0.0464 0.7932 0.1071 0.0168 0.2485 0.2283 7 0.0025 0.0046 0.0007 0.0008 0.0069 0.0048 0.0000 0.0258 0.0628 0.0427 0.2128 0.1913 8 0.0005 0.0103 0.0003 0.0003 0.0023 0.0011 0.0016 0.0000 0.0863 0.0288 0.2329 0.2098 9 0.0163 0.0015 0.0113 0.0110 0.0258 0.0215 0.0063 0.0141 0.0000 0.0998 0.1596 0.1392 10 0.0010 0.0139 0.0022 0.0014 0.0011 0.0005 0.0042 0.0012 0.0188 0.0000 0.2400 0.2197 11 0.0815 0.1012 0.0832 0.0832 0.0812 0.0808 0.0867 0.0822 0.1070 0.0815 0.0000 0.0602 12 0.0130 0.0148 0.0112 0.0113 0.0169 0.0149 0.0105 0.0120 0.0164 0.0143 0.1556 0.0000
(a) (b)
4.2 PSD and PWSD for Conventional and Precise Spectra
The PSD calculates the probability for all spectra or a set of selected spectral signature from a spectral library that is able to classify a spectrum of a pixel to target class. Higher the probability, the better is capability of the set of spectra to predict the pixel spectrum. PWSD evaluates the effectiveness
of spectral similarity measures to predict specific target spectrum. It is designed based on the power of discriminating one pixel vector from another relative to a reference pixel vector (Van der Mir 2005). The Higher PWSD causes the better discrimination among the spectra. PSD and PWSD for the spectrum of figure 2(a) and 2(b) computed separately and comparative analysis is carried out.
Table 7: Spectral similarity and discriminatory values: Spectra developed conventionally
Chickpea Sorghum Wheat
CBD SAM SID CBD SAM SID CBD SAM SID
Chickpea 0 0 0 0.0694 0.0590 0.0056 0.0270 0.0303 0.0009
Sorghum 0.0694 0.0590 0.0056 0 0 0 0.0900 0.0706 0.0066
Wheat 0.0270 0.0303 0.0009 0.0900 0.0707 0.0066 0 0 0
PSD 0.5173 0.5586 0.4957 0.8550 0.8104 0.9283 0.6277 0.6310 0.5760 PWSD 2.5674 1.9463 5.9106 1.2965 1.1964 1.1893 3.3287 2.3285 7.0297
Table 8: Spectral similarity and discriminatory values: Spectra developed precisely based on spectral similarity
Table 7 and 8 extract spectra developed based on spectral similarity increase the PSD of chickpea and sorghum in CBD and SID. Hence chickpea and sorghum now have higher probability for classification of target pixel. Also PWSD of chickpea and wheat is increased for all measures that conclude chickpea and wheat can be better discriminated than sorghum. A marginal decrease in the PSD although increase in the PWSD has been observed for wheat. Thus, wheat has better discrimination from other classes. Eventhough SAM is very widely used algorithm for hyperspectral image classification, results of PSD and PWSD restricts the selection of SAM as classification algorithm. Among all SID is better discriminating among the classes as it has highest PSD and PWSD. Thus, selecting SID as the classification method, higher classification accuracy can be assured.
4.3 Crop Classification and Accuracy Assessment
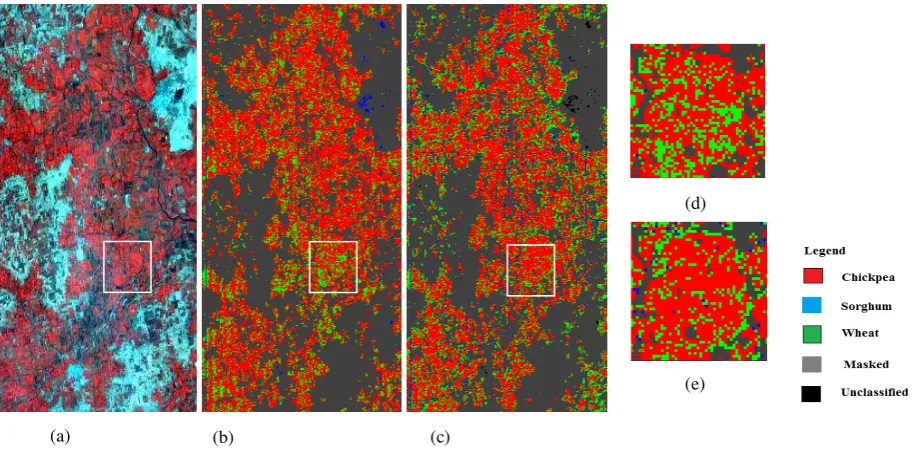
Crop classification has been carried out using Spectral Information Divergence (SID) algorithm. SID (Du et al. 2004) is a spectral classification method that uses a divergence measure to match pixels to reference spectra. The smaller the divergence, the more likely the pixels are similar. Pixels with a measurement greater than the specified maximum divergence threshold are not classified. Hyperion’s atmospherically corrected image is used as an input data for classification. The ultimate aim of the image analysis was crop classification. To carry out classification for agriculture areas only pixels having NDVI value less than 0.4 (threshold decided from the field knowledge) are masked. Classification was carried out as input spectra from
two spectra i.e. field spectra developed conventionally and precise field spectra developed based on spectral similarity. Image was classified into major three crop classes such as chickpea, sorghum and wheat and pixels not belong to these classes’ remains as unclassified. After classification georeferencing was carried out for accuracy assessment. Image was georeferecned using 9 GCP to the accuracy of 0.1 pixel resolution. Accuracy assessment of the classified images was carried out for both the cases by cross validation of classified pixels against testing pixels collected during field study and error matrix is generated to test the accuracy.
Table 9: Error matrix for the image classified using field spectra developed conventionally
Classified Data
Reference Data User’s Accurac y (%) Chick
pea
Sorg hum
Whe at
Total
Chickpea 48 6 18 72 66.67
Sorghum 12 18 6 36 50.00
Wheat 24 18 62 104 59.61
Total 84 42 86 212 Overall
Accurac y =60.38% Producer’s
Accuracy (%)
57.14 42.86 72.09
Accuracy assessment indicates higher overall, user’s and producer’s accuracy which are achieved from the classification carried out using spectra developed based on spectral similarity.
Chickpea Sorghum Wheat
CBD SAM SID CBD SAM SID CBD SAM SID
Chickpea 0 0 0 0.1056 0.0792 0.0111 0.0146 0.0200 0.0016
Sorghum 0.1056 0.0792 0.0111 0 0 0 0.1094 0.0830 0.0126
Wheat 0.01462 0.0200 0.0015 0.1094 0.0830 0.0126 0 0 0
PSD 0.5234 0.5443 0.5000 0.9363 0.8904 0.9384 0.5403 0.5653 0.5616 PWSD 7.2176 3.9655 7.1128 1.0366 1.0484 1.1406 7.4816 4.1574 8.1128
Figure 2: Image data: a) Hyperion data, b) Classified image using field spectra developed conventionally, c) Classified image using field spectra developed precisely based on spectral similarity, d) Zoomed portion of encircled area for image classified using spectra developed conventionally, e) Zoomed portion of encircled area for image classified using spectra developed precisely.
Table 10: Error matrix for the image classified using field spectra developed precisely that indicates precise spectra developed based on spectral similarity is more effective to distinguish among the classes.
4.3.1 Accuracy Assessment of Classification: Assessment of classification accuracy is controlled with the help of Kappa Analysis technique and Z test (Mather and Koch, 2010; Jensen, 2004; Richards and Jia, 2006). Kappa analysis technique is used to measure the agreement between two observers on the same data; for remote sensing, it is used to measure the agreement between the classification approaches. Since, it takes into account the whole error matrix instead of only the diagonal elements, as the overall accuracy does, it has been recommended (Fung and Ledrew, 1988) as suitable measures of accuracy of classification. The Kappa analysis was applied by means of the formula given
x
= total numbers of observations for row ii
x
= total number of observations for column iN = total number of observations in error matrix
Kappa is a dimensionless real number between -1 and 1, the value close to 1 includes the maximum agreement while value of -1 can be interpreted as a total disagreement. Ladis and Koch (1977) proposed a classification of agreement based on the value of Kappa, (Table 11).
Table 11: Interpretation of Kappa
K Value Rating Agreement
0.81 Excellent Almost perfect agreement0.8 - 0.61 Good Substantial agreement
0.60 - 0.41 Moderate Moderate agreement
0.40 - 0.21 Poor Fair agreement
0.20 - 0 Bad Slight agreement
< 0.00 Very Bad Less than chance agreement
Once Kappa coefficients are calculated, the comparison between a pair of Kappa statistics obtained from the error matrices of two classifications was done to determine if they are significantly different.
(b) (c)
(a)
(d)
(e)
them (Skidmore, 1999). The test statistics Z is obtained by using the formula (9) derived by Fleiss et al. (1969).
1 2
classified by conventional and precise crop spectral library respectively and Var1and Var2are the variances of respective
Kappa statistics. The Z statistics follows a normal distribution. For instance, assuming for Z test, the null hypothesis H0: K1 = K2 and the alternative H1: K1
K2, the H0 hypothesis is rejected if Z value is obtained is greater than 1.96; the classification results (error matrices) are significantly different at a 95 % confidence level. Whereas if Z value obtained is lesser than 1.96, the H0 is accepted i.e. the classification results (error matrices) are not significantly different at a 95% confidence level. Z test was carried out for remote sensing data by Dwivedi et al. (2003) and Goncalveset al. (2007).
.
Table 12: Individual Error Matrix Kappa Analysis Results
Error Matrix of Image
Table 13: Kappa Analysis Results for the Pairwise Comparison of the Error Matrices Pairwise Comparison between Error Matrices of Images classified by Spectra
selection
Z Statistics
Conventional and Precise 2.06
Table 12 presents the results of the Kappa analysis on the individual error matrices. The KHAT values are a measure of agreement or accuracy. The values can range from +1 to -1. Table 12 also presents the variance of the KHAT statistics and the Z statistics used for determining if the classification is significantly better than a random result. At the 95% confidence level, the critical value would be 1.96. Therefore, if the absolute value of the test Z statistics is greater than 1.96, the result is significant and it can be concluded that the classification is better than random. The Z statistics values for the two error matrices in Table 12 are both higher than 1.96, so both classifications are significantly better than random. Also the value of pairwise comparison of two classification results computes higher Z statistic value, which shows two classification results are significantly different. According to Kappa value the image classified using spectra selected conventionally shows fair agreement (KHAT = 0.37), while image classified using precise spectra shows substantial agreement due to increased Kappa value (KHAT = 0.62). Hence image classified using precise spectra shows substantial improvement in image classification validated by kappa statistics.
5. CONCLUSIONS
The results of the PSD, PWSD, accuracy assessment, kappa statistics and Z values show that spectra developed based on spectral similarity is the possibly an effective way to develop spectra for crops. A reasonably higher overall accuracy, kappa statistics and Z values shows improvement in classification results indicates spectra developed based on spectral similarity was more effective to distinguish among the classes. As the field has major three classes, the approach covers solely three classes but the scope of developed approach is applicable to any number of classes and also to other land use land cover classes since it is not class specific. The approach can be effectively applied to visually
Chang, C.I. 2000. An information theoretic-based approach to spectral variability, similarity and discriminability for hyperspectral image analysis. IEEE Transaction on
Information Theory, 46 (5), 1927–1932.
Chang, C.I. 2003. Hyperspectral Imaging: Techniques for
Spectral Detection and Classification. Kluwer Academic /
Plenum Publishers, New York.
Cover and J. Thomas. 1991. Elements of Information Theory.
New York: John Willey and Sons.
Dennison P.E., Halligan K. Q. and Roberts D.A. 2004. A Comparison of Error Metrics and Constraints for Multiple Endmember Spectral Mixture Analysis and Spectral Angle Mapper. Remote Sensing of Environment,93, pp.359-367. Du H., C.I. Chang, H. Ren, F.M. D’Amico, J. O. and Jensen J. 2004. New Hyperspectral Discrimination Measure for Spectral Characterization. Optical Engineering, Vol. 43, No. 8, pp.1777-1786.
Dwivedi, R. S., Sreenivas Kandrika and Ramana, K. V., 2003. Comparison of classifiers of remote-sensing data for land-use/ land-cover mapping. Current Science, 86, pp.328-335.
Fleiss, J.L., Cohen, J. and Everitt, B.S., 1969. Large-sample standard errors of kappa and weighted kappa. Psychological
Bulletin, 72, pp. 323-327.
Fung, T. and Ledrew, E., 1988. The determination of optimal threshold levels for change detection using various accuracy indices. Photogramm. Engg. & Remote Sensing, 54, pp.1449-1454.
Goncalves, R.P., Assis, L.C. and Vieria, C.A.O., 2007. Comparison of sampling methods to classification of remotely sensed images. IV International Symposium in Precision in Agriculture, 23-25 October, Vicosa, Brazile.
Jensen John R, 2004, Introductory Digital Image Processing, 3rd edition, Prentice Hall, Upper Saddle River, NJ, 316 p.
Kullback, S. 1959. Information Theory and Statistics. John Wiley & Sons, N.Y.
Kong Xiangbing, Shu Ning, Huang Wenyu and Fu Jing. 2010. The Research on Effectiveness of Spectral Similarity Measures for Hyperspectral Image. Presented in 3rd International Congress on Image and Signal Processing (CISP2010), 978-1-4244-6516-2010, IEEE.
Kruse F. A. 2008.“Comparison of ATREM, ACORN, And FLAASH Atmospheric Corrections using low altitude AVIRIS data of Boulder, Co. USA.” Accessed September 21. http://www.hgimaging.com/FAKPubs.
Landis, J.R., Koch, G.G, 1977. The measurement of observer agreement for categorical data. Biometrics, 33:159-174.
Mather Paul and Magaly Koch, 2010, Computer Processing
of Remotely-Sensed Images: An Introduction, 4th Edition
ISBN: 978-0-470-74239-6.
Pearlman J.S., Barry P.S., Segal C.C., Shepanski J., Beiso D. and Carman S.L. 2003. Hyperion, a Space Borne Imaging Spectrometer. IEEE Transactions on Geosciences and
Remote Sensing. 41 (6), pp.1160-1173.
Richards, J.A. and Jia, X., (2006), Remote Sensing Digital
Image Analysis: An Introduction, Springer-Verlang, Berlin.
Rao N.R., Garg P.K. and Ghosh S.K. 2007. Development of an agricultural crops spectral library and classification of crops at cultivar level using hyperspectral data. Precision
Agriculture. 8, pp.173-185, DOI:
10.1007/s11119-007-9037-x.
Skidmore, A.K. (1999). Accuracy assessment of spatial information. In: A. Sten et al. (eds). Spatial statistics for
remote sensing, Netherlands, Kluwer academic publishers,
pp. 197-209.
Van der Meer F. 2005. “The effectiveness of spectral similarity measures for the analysis of hyperspectral imagery.” International Journal of Applied Earth
Observation and Geoinformation.
doi:10.1016/j.jag.2005.06.001.