Full Terms & Conditions of access and use can be found at
http://www.tandfonline.com/action/journalInformation?journalCode=cbie20
Download by: [Universitas Maritim Raja Ali Haji] Date: 18 January 2016, At: 21:42
Bulletin of Indonesian Economic Studies
ISSN: 0007-4918 (Print) 1472-7234 (Online) Journal homepage: http://www.tandfonline.com/loi/cbie20
Post-crisis export performance: The Indonesian
experience in regional perspective
Prema-Chandra Athukorala
To cite this article: Prema-Chandra Athukorala (2006) Post-crisis export performance: The Indonesian experience in regional perspective, Bulletin of Indonesian Economic Studies, 42:2, 177-211, DOI: 10.1080/00074910600873658
To link to this article: http://dx.doi.org/10.1080/00074910600873658
Published online: 20 Aug 2006.
Submit your article to this journal
Article views: 218
View related articles
ISSN 0007-4918 print/ISSN 1472-7234 online/06/020177-35 © 2006 Indonesia Project ANU DOI: 10.1080/00074910600873658
POST-CRISIS EXPORT PERFORMANCE:
THE INDONESIAN EXPERIENCE
IN REGIONAL PERSPECTIVE
Prema-chandra Athukorala* Australian National University
This paper examines post-crisis export performance in Indonesia against the back-drop of pre-crisis experience and the comparative export performance of other Southeast Asian countries. It surveys trends and patterns of export performance, focusing on comparative experience in major commodity categories and changing revealed comparative advantage. It also examines the implications for Indonesia’s export performance of China’s emergence as a major competitor in world trade, considers market prospects for textile and garment exports following the demise of the Multi-fi bre Arrangement, and explores the factors contributing to the
post-crisis export slowdown. The fi ndings support the view that Indonesia’s poor export
performance in the post-crisis era is largely supply driven. They strengthen the case for reversal of recent backsliding in macroeconomic policy reform, and for speedy implementation of the unfi nished reform agenda. Prudent macroeconomic
man-agement, while necessary, is not suffi cient to achieve rapid and sustained export
growth in an era of rapid economic globalisation.
INTRODUCTION
The economic boom in Indonesia from the late 1980s until the onset of the fi nan-cial crisis in mid-1997 was underpinned by rapid export growth, accompanied by a dramatic shift in the commodity composition of exports away from crude oil, then the principal export, towards non-oil primary products and manufactur-ing. Rapid growth of non-oil exports was the foundation of Indonesia’s success in maintaining international creditworthiness and macroeconomic stability fol-lowing the end of the oil boom in the mid-1980s. The expansion of manufactur-ing exports, in particular, was instrumental in brmanufactur-ingmanufactur-ing about rapid employment growth. Against this backdrop, there is serious concern in contemporary Indo-nesian policy circles about the failure of export performance to regain its pre-crisis
* The author is indebted to Satish Chand, Chris Manning, Thee Kian Wee and the two anonymous referees for critical comments and helpful advice. Thanks are also due to Nobuaki Yamashita and Tran Quang Tien for help with preliminary data tabulations, and to the Indonesia Project at the Australian National University for fi nancial support.
dynamism.1 The purpose of this paper is to inform this debate by examining
post-crisis export performance in Indonesia from a comparative East Asian perspective, against the backdrop of pre-crisis experience and ongoing changes in patterns of international production. Particular attention will be paid to the perceived or real challenges arising from China’s meteoric rise as a major competitor in global markets, and from the phasing out of the Multi-fi bre Arrangement (MFA), which regulated world trade in textiles and garments for over 40 years.
The paper begins with an overview of Indonesia’s export trends—with empha-sis on the relative growth performance of oil and gas and non-oil and gas exports— and a survey of comparative ASEAN experience in the post-crisis era.2 The next
section examines comparative export experience using a commodity classifi cation specifi cally designed to focus on emerging trends in world merchandise trade. This section also compares Indonesia’s changing revealed comparative advantage in merchandise trade with that of Thailand. The subsequent sections deal with the possible implications for Indonesia’s export performance of China’s emergence as a major force in world trade, and the implications of MFA abolition for textile and garment exports from Indonesia. This is followed by an assessment of the causes of the post-crisis export slowdown. The key fi ndings are summarised in the fi nal section.
EXPORT TRENDS
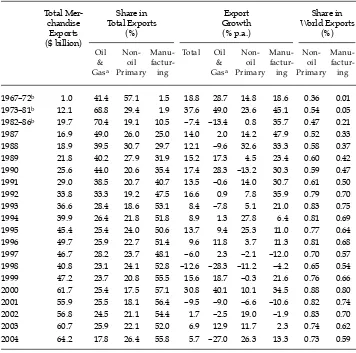
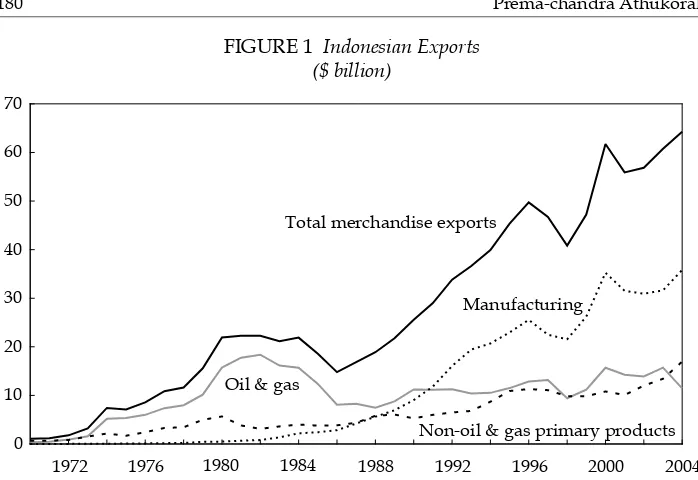
At the end of the oil boom in the early 1980s, petroleum and petroleum and gas products (henceforth referred to as ‘oil’ for brevity) accounted for almost three-quarters of total merchandise exports from Indonesia (table 1, fi gure 1). The collapse of oil prices in 1982, followed by another precipitous fall in 1985–86, therefore brought about a massive decline in total export earnings. Export earn-ings (in current dollars) contracted at an average annual rate of 7.4% between 1982 and 1986 (table 1), compared with a staggering 37.6% growth between 1973 and 1981. In the trough of 1986, total exports amounted to $15 billion (18% of GDP), compared with a peak level of $22 billion (31% of GDP) in 1982. But the Indonesian economy managed to regain export dynamism from about 1987 by shifting to non-oil exports of both primary products and manufactures. In the decade 1987–96, total export earnings grew at an average rate of 13% per year, with all years except 1993, 1994 and 1996 (when the growth rates were slightly below 10%) recording double-digit growth. Rapid export expansion, with man-ufacturing exports playing the pivotal role, was a key factor in Indonesia’s rapid economic growth. The dramatic shift in export composition towards manufac-turing lessened the vulnerability of the economy to sudden external shocks, and thus provided a congenial setting for sound macroeconomic management. Rapid growth of labour-intensive exports also made a signifi cant contribution to employment expansion and poverty alleviation (Hill 2000).
1 See, for instance, Aswicahyono and Hill (2004): 288–94; World Bank (2005a).
2 Most of the data used are for the original fi ve members of ASEAN (the ASEAN-5:
Indo-nesia, Malaysia, the Philippines, Singapore and Thailand). Vietnam is included in some of the analysis, with the acronym ‘ASEAN-6’ used for the ASEAN-5 + Vietnam.
Rapid export growth was underpinned by a dramatic shift in export composi-tion away from oil and towards non-oil primary products and manufacturing. By the early 1990s, the share of manufacturing had surpassed that of both agricultural goods and oil and gas in the export structure. The dollar value of total non-oil exports grew at an average annual rate of 17.5% during the period 1990–96, with manufacturing exports expanding at a rate of 20%. By the mid-1990s, manufac-tured goods contributed over 50% of total merchandise exports, compared with around 10% in the mid-1980s. Indonesia’s share in total world non-oil exports increased persistently from 0.47% during the years 1982–86 to 0.77% in 1995. The growth of the share in world manufacturing exports between the two time points was even faster, from a mere 0.21% to 0.64% (table 1).
TABLE 1 Key Indicators of Export Performance, Indonesia
Total
Mer-1973–81b 12.1 68.8 29.4 1.9 37.6 49.0 23.6 45.1 0.54 0.05
1982–86b 19.7 70.4 19.1 10.5 –7.4 –13.4 0.8 35.7 0.47 0.21
1987 16.9 49.0 26.0 25.0 14.0 2.0 14.2 47.9 0.52 0.33
1988 18.9 39.5 30.7 29.7 12.1 –9.6 32.6 33.3 0.58 0.37
1989 21.8 40.2 27.9 31.9 15.2 17.3 4.5 23.4 0.60 0.42
1990 25.6 44.0 20.6 35.4 17.4 28.3 –13.2 30.3 0.59 0.47
1991 29.0 38.5 20.7 40.7 13.5 –0.6 14.0 30.7 0.61 0.50
1992 33.8 33.3 19.2 47.5 16.6 0.9 7.8 35.9 0.79 0.70
1993 36.6 28.4 18.6 53.1 8.4 –7.8 5.1 21.0 0.83 0.75
1994 39.9 26.4 21.8 51.8 8.9 1.3 27.8 6.4 0.81 0.69
1995 45.4 25.4 24.0 50.6 13.7 9.4 25.3 11.0 0.77 0.64
1996 49.7 25.9 22.7 51.4 9.6 11.8 3.7 11.3 0.81 0.68
1997 46.7 28.2 23.7 48.1 –6.0 2.3 –2.1 –12.0 0.70 0.57
1998 40.8 23.1 24.1 52.8 –12.6 –28.3 –11.2 –4.2 0.65 0.54
1999 47.2 23.7 20.8 55.5 15.6 18.7 –0.3 21.6 0.76 0.66
2000 61.7 25.4 17.5 57.1 30.8 40.1 10.1 34.5 0.88 0.80
2001 55.9 25.5 18.1 56.4 –9.5 –9.0 –6.6 –10.6 0.82 0.74
2002 56.8 24.5 21.1 54.4 1.7 –2.5 19.0 –1.9 0.83 0.70
2003 60.7 25.9 22.1 52.0 6.9 12.9 11.7 2.3 0.74 0.62
2004 64.2 17.8 26.4 55.8 5.7 –27.0 26.3 13.3 0.73 0.59
a Exports of natural gas commenced in 1977. Until then the data relate solely to petroleum exports.
b Annual averages.
Source: Compiled from UN Comtrade database.
This impressive export performance record was interrupted by the onset of the crisis in mid-1997. Total export earnings in dollar terms contracted by 6% in 1997 and 12.6% in 1998, with non-oil primary products and manufacturing experienc-ing signifi cant contraction and oil and gas growing by a mere 2.3%. The decline in export value (in dollar terms) was a common pattern observed across all crisis-affected countries. This was mainly the outcome of sluggish adjustment of both domestic-currency export prices and volumes to massive exchange rate deprecia-tion.3 In addition, massive contraction of domestic demand during the crisis may
have encouraged exporters to pass on a part of the exchange rate depreciation to foreign buyers in order to boost export demand (Rosner 2000).
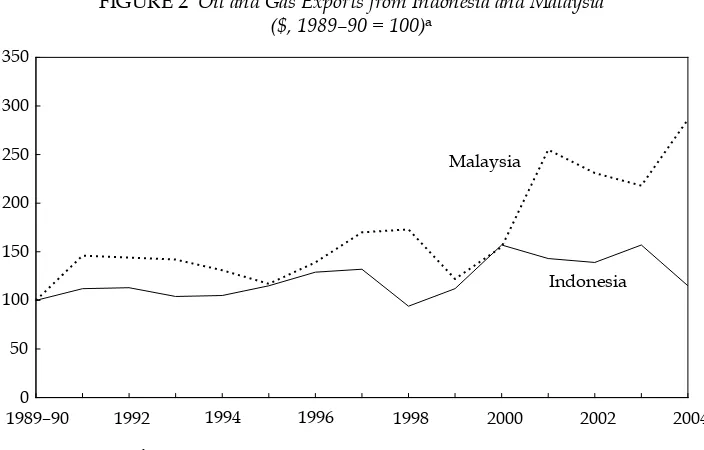
There was a sharp recovery during the next two years, lifting export value by 15% over the pre-crisis (1990–96) average. This was followed by a 9.5% export contraction in 2001, which at the time was interpreted as a refl ection of the global economic downturn. However, the ensuing years have failed to restore Indonesia’s pre-crisis growth dynamism, notwithstanding a notable improve-ment in the international economic environimprove-ment. The average annual growth of total non-oil exports for 2000–04 was a mere 8.7% compared with 17.5% for 1990–96. The average growth rate of manufactured exports declined from 19.6% to 7.5% between these two periods. Oil and gas exports also recorded a sig-nifi cant contraction, notwithstanding Indonesia’s considerable resources, and recent increases in world oil prices.4 Interestingly, over the past fi ve years,
Indo-3 The well-known ‘J-curve’ effect of currency devaluation/depreciation.
4 Given rampant smuggling of oil and oil products from Indonesia to locations with higher prices, because of Indonesia’s subsidised domestic fuel prices, official statis-tics are likely to understate actual oil exports. However, it is unlikely that the
remark-FIGURE 1 Indonesian Exports ($ billion)
1972 1976 1980 1984 1988 1992 1996 2000 2004 0
10 20 30 40 50 60 70
Total merchandise exports
Manufacturing
Non-oil & gas primary products Oil & gas
Source: Based on data compiled from UN Comtrade database.
nesia’s oil and gas exports have clearly lagged behind those of neighbouring Malaysia (fi gure 2).
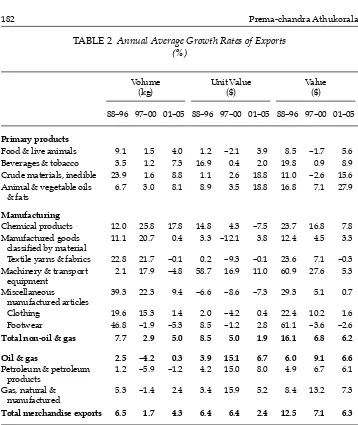
Table 2 summarises changes in export volume, value and price (unit value) by commodity category at the one-digit level of the Standard International Trade Classifi cation (SITC). During the pre-crisis period (1988–96), export earnings growth across non-oil commodity categories was more closely associated with growth of export volume than with changes in unit values. By contrast, during the post-crisis period (2000–05), growth in the export earnings of virtually all products came predominantly from favourable world prices, which more than compensated for sluggish volume expansion. This latter pattern is much more prominent for the three non-oil primary product categories (food and live ani-mals, beverages and tobacco, and crude materials) and for oil and gas than for the manufacturing categories. Given that Indonesia is by and large a price taker (‘small country’) in world trade, these contrasting patterns seem to suggest that the relatively slow export growth during the post-crisis era was predominantly supply, rather than demand, driven.
During the post-crisis years until about 2000, Indonesia’s export growth kept pace with that of its ASEAN neighbours (fi gure 3). Indonesia’s average growth rate of non-oil exports during the pre-crisis years 1990–96 (18.2%) was slightly
able slowdown in reported oil and gas exports can be ascribed to such under-report-ing alone. In any case, there is little room for smugglunder-report-ing or under-reportunder-report-ing when it comes to trade in gas, which accounts for almost half of Indonesia’s total oil and gas exports.
FIGURE 2 Oil and Gas Exports from Indonesia and Malaysia ($, 1989–90 = 100)a
1989–90 1992 1994 1996 1998 2000 2002 2004 0
50 100 150 200 250 300 350
Malaysia
Indonesia
a 1989–90: average of two years.
Source: Based on data compiled from UN Comtrade database.
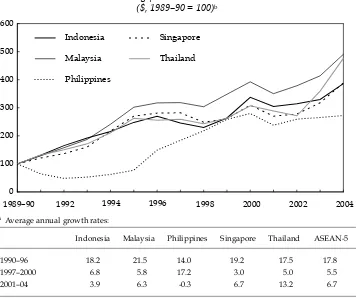
below that of Malaysia (21.5%) and Singapore (19.2%), but above that of the other two countries and above the regional average (17.8%). The export contraction fol-lowing the onset of the crisis continued for a much longer time in Indonesia than in Malaysia, Singapore and Thailand, but by and large export performance dur-ing the crisis and immediate post-crisis years (1997–2000) was consistent with regional trends. However, from 2000 to 2004, Indonesia’s export growth persist-ently lagged behind that of the other countries; its exports grew at an annual average rate of 3.9%, compared with 13.2% in Thailand, 6.3% in Malaysia and 6.7% in Singapore. The 2000–01 global economic downturn affected each of these countries differently, depending on the peculiarities of its export composition.
TABLE 2 Annual Average Growth Rates of Exports (%)
Volume (kg)
Unit Value ($)
Value ($)
88–96 97–00 01–05 88–96 97–00 01–05 88–96 97–00 01–05
Primary products
Food & live animals 9.1 1.5 4.0 1.2 –2.1 3.9 8.5 –1.7 5.6 Beverages & tobacco 3.5 1.2 7.3 16.9 0.4 2.0 19.8 0.9 8.9 Crude materials, inedible 23.9 1.6 8.8 1.1 2.6 18.8 11.0 –2.6 15.6 Animal & vegetable oils
& fats
6.7 3.0 8.1 8.9 3.5 18.8 16.8 7.1 27.9
Manufacturing
Chemical products 12.0 25.8 17.8 14.8 4.3 –7.5 23.7 16.8 7.8 Manufactured goods
classifi ed by material
11.1 20.7 0.4 3.3 –12.1 3.8 12.4 4.5 3.3
Textile yarns & fabrics 22.8 21.7 –0.1 0.2 –9.3 –0.1 23.6 7.1 –0.3 Machinery & transport
equipment
2.1 17.9 –4.8 58.7 16.9 11.0 60.9 27.6 5.3
Miscellaneous manufactured articles
39.3 22.3 9.4 –6.6 –8.6 –7.3 29.3 5.1 0.7
Clothing 19.6 15.3 1.4 2.0 –4.2 0.4 22.4 10.2 1.6
Footwear 46.8 –1.9 –5.3 8.5 –1.2 2.8 61.1 –3.6 –2.6
Total non-oil & gas 7.7 2.9 5.0 8.5 5.0 1.9 16.1 6.8 6.2
Oil & gas 2.5 –4.2 0.3 3.9 15.1 6.7 6.0 9.1 6.6
Petroleum & petroleum products
1.2 –5.9 –1.2 4.2 15.0 8.0 4.9 6.7 6.1
Gas, natural & manufactured
5.3 –1.4 2.4 3.4 15.9 5.2 8.4 13.2 7.3
Total merchandise exports 6.5 1.7 4.3 6.4 6.4 2.4 12.5 7.1 6.3
Source: Compiled from CEIC Asia Database (based on BPS data).
For instance, Korea’s and Malaysia’s export growth was more adversely affected than that of Indonesia and Thailand, because the heavy concentration of exports in electronics and related products was more vulnerable to the global recession. Even then, the export decline in Indonesia in 2001 was greater than that in Thai-land. Over the ensuing three years, Indonesia’s export growth deviated more and more widely from regional trends (fi gure 3).
More specifi cally, what are the products and product categories in which nesia’s performance has lagged behind that of its ASEAN neighbours? Has Indo-nesia’s relatively poor performance come from its failure to diversify into product lines that have shown greater dynamism in world trade, or from its inability to maintain market share in traditional products, or both? We now turn to an analy-sis of comparative export experience at the level of key commodities and com-modity groups, with a view to broadening our understanding of these and related issues.
FIGURE 3 Non-oil Exports from Indonesia, Malaysia, the Philippines, Singapore and Thailanda
($, 1989–90 = 100)b
1989–90 1992 1994 1996 1998 2000 2002 2004 0
100 200 300 400 500 600
Indonesia
Malaysia
Philippines
Singapore
Thailand
a Average annual growth rates:
Indonesia Malaysia Philippines Singapore Thailand ASEAN-5
1990–96 18.2 21.5 14.0 19.2 17.5 17.8
1997–2000 6.8 5.8 17.2 3.0 5.0 5.5
2001–04 3.9 6.3 -0.3 6.7 13.2 6.7
b 1989–90: average of two years.
Source: Based on data compiled from UN Comtrade database.
CHANGING COMMODITY COMPOSITION AND EXPORT PERFORMANCE
Data on the export performance of Indonesia and the other four ASEAN-5 econo-mies are summarised in table 3, and are presented in the context of structural shifts in export composition by broad commodity category. The commodity clas-sifi cation used here has been designed to shed light on the implications of two important developments in world trade that have opened up new export oppor-tunities for developing countries: the emergence of processed food as a dynamic export line within the broader category of food, and the expansion of trade in parts and components within vertically integrated production systems, recorded under the machinery and transport equipment category (SITC 7).5 Before we turn
to analysis of the data, a brief discussion of the rationale for the special treatment of processed food and parts and components, and its implications for assessing export opportunities for Indonesia, is in order.
Since about the late 1970s there has been a notable compositional shift in world food trade. The relative importance of ‘classical’ food products (coffee, tea, sugar, cocoa and so on) has been sharply eroded by the rapid expansion of trade in prod-ucts such as fresh fruit and vegetables, poultry, fi sh and dairy products, which are exported after being subjected to technologically sophisticated processes (i.e. becoming ‘processed foods’).6 Powerful forces on both the demand and the
sup-ply sides have underpinned this structural shift (Athukorala and Sen 1998; Athu-korala and Jayasuriya 2003). On the demand side, ‘internationalisation of food habits’—the increased importance of imported processed items in consumption patterns in developed countries, as well as among large sections of the populace in many developing countries—appears to have played a key role. Factors such as international migration, the communications revolution and international tour-ism have contributed to this phenomenon. This signifi cant demand-side impetus seems to have been supported by important supply-side developments such as improvements in food technology, refrigeration facilities and transport that have made various processed food products, which are generally highly perishable, internationally tradable. Indonesia is well placed to benefi t from this structural shift in world food trade, given its rich agricultural resource base and the ample availability of labour (because food processing and packaging for export are highly labour intensive).
5 The analysis is based on a systematic separation of processed food, and parts and com-ponents, from the UN trade data (SITC Revision 3) at the fi ve-digit level of disaggregation.
The commodity list used in this reclassifi cation of the standard UN trade data is available
from the author on request. For details on the classifi cation system, see Athukorala and Sen
(1998) and Athukorala (2006a).
6 The term ‘processed food’ as used in this paper refers to food items that undergo sub-stantial processing in the country of origin before export; they are typically high value and subject to increasingly stringent food safety standards. While international trade in many of these items is not entirely ‘new’, their trade has experienced very rapid expan-sion in recent years, and they are often described as ‘new food exports’, or ‘non-tradition-al food exports’. To maintain the focus on these new dynamic export items, we exclude from the defi nition traditional beverages (such as tea and coffee) and cereal grains (such
as wheat, maize and rice) exported in bulk form, regardless of the degree of processing involved.
The emergence of parts and components (or ‘middle products’) as a dynamic export line is a refl ection of the ongoing process of product fragmentation7—the
cross-border dispersion of component production and assembly within vertically integrated production processes mostly, but not solely, dominated by multina-tional enterprises (MNEs) (Feenstra 1998; Athukorala 2006a). Internamultina-tional prod-uct fragmentation allows companies to unbundle stages of prodprod-uction so that each stage can be relocated to countries in which the intensively used inputs are cheap. The electronics MNEs based in the US started the process in the mid-1960s as a strategic response to import competition from Japanese fi rms. The involve-ment of Japanese and western European MNEs in outsourcing gained importance from the late 1970s. More recently, MNEs based in East Asian newly industrialising economies (NIEs), notably Korea and Taiwan, have also joined this process of inter-nationalisation of production. In response to rapid domestic wage increases, the growing reluctance of domestic labour to engage in low-paid blue-collar employ-ment, and stringent restrictions on the importation of labour, fi rms in the electronics industry and other durable consumer goods industries in the East Asian NIEs have begun to produce components and carry out sub-assembly activities in neighbour-ing countries where labour costs are still low.
The transfer abroad of component assembly operations now occurs in many industries where the technology of production permits the separation of labour-intensive components from other stages of production. The other products with signifi cant international production sharing include television and radio receivers, optical products, musical equipment, watches, sewing machines, typewriters and other offi ce equipment, aircraft parts, chemicals, pharmaceuticals, synthetic fi bres, wearing apparel and travel goods. In general, industries that have the potential to break up the production process to minimise transport costs are more likely than other industries to move to peripheral countries. This phenomenon has been refl ected in a rapid growth of trade in parts and components, at a rate exceeding that of trade in fi nal goods, because goods cross multiple borders during the pro-duction process. Indonesia is particularly well placed to benefi t from this new form of international specialisation, given the availability of relatively low-cost and train-able labour, and its location in a region that has become the growth centre of com-ponent production and assembly in the world (Athukorala 2006a).
Several important features stand out from the data reported in table 3. First, notwithstanding the rapid growth of manufacturing exports from the late 1980s, non-oil primary products, both agricultural products and minerals, still accounted in 2003–04 for a larger share of non-oil exports from Indonesia (31%) than from the other three resource-rich countries in the region: Thailand (21%), Malaysia (13%) and the Philippines (9%).
Second, there is clear evidence of the emergence of processed food as a dynamic line in Indonesia’s export structure. During the period 2001–04, processed food exports from Indonesia grew at a faster rate (5.7%) than those from Malaysia (2.8%), the Philippines (4.3%) and Thailand (3.0%). However, Indonesia’s world market share of this dynamic product category in 2003–04 (0.91%) was only one-third that of neighbouring Thailand (2.93%), a difference that certainly goes
7 This phenomenon goes under various names, such as ‘vertical specialisation’, ‘slicing the value chain’, ‘international production sharing’ and ‘outsourcing’.
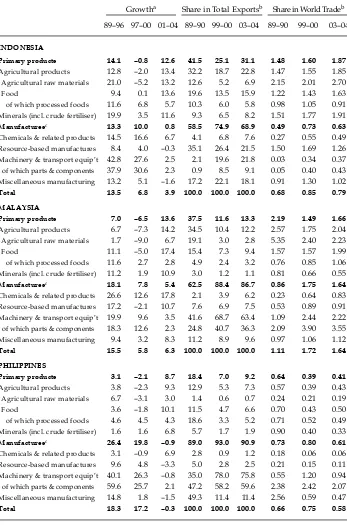
TABLE 3 Non-oil Export Performance by Major Commodity Category
Growtha Share in Total Exportsb Share in World Tradeb
89–96 97–00 01–04 89–90 99–00 03–04 89–90 99–00 03–04
INDONESIA
Primary products 14.1 –0.8 12.6 41.5 25.1 31.1 1.48 1.60 1.87
Agricultural products 12.8 –2.0 13.4 32.2 18.7 22.8 1.47 1.55 1.85
Agricultural raw materials 21.0 –5.2 13.2 12.6 5.2 6.9 2.15 2.01 2.70
Food 9.4 0.1 13.6 19.6 13.5 15.9 1.22 1.43 1.63
of which processed foods 11.6 6.8 5.7 10.3 6.0 5.8 0.98 1.05 0.91
Minerals (incl. crude fertiliser) 19.9 3.5 11.6 9.3 6.5 8.2 1.51 1.77 1.91 Manufacturesc 13.3 10.0 0.8 58.5 74.9 68.9 0.49 0.73 0.63
Chemicals & related products 14.5 16.6 6.7 4.1 6.8 7.6 0.27 0.55 0.49
Resource-based manufactures 8.4 4.0 –0.3 35.1 26.4 21.5 1.50 1.69 1.26
Machinery & transport equip’t 42.8 27.6 2.5 2.1 19.6 21.8 0.03 0.34 0.37
of which parts & components 37.9 30.6 2.3 0.9 8.5 9.1 0.05 0.40 0.43
Miscellaneous manufacturing 13.2 5.1 –1.6 17.2 22.1 18.1 0.91 1.30 1.02 Total 13.5 6.8 3.9 100.0 100.0 100.0 0.68 0.85 0.79
MALAYSIA
Primary products 7.0 –6.5 13.6 37.5 11.6 13.3 2.19 1.49 1.66
Agricultural products 6.7 –7.3 14.2 34.5 10.4 12.2 2.57 1.75 2.04
Agricultural raw materials 1.7 –9.0 6.7 19.1 3.0 2.8 5.35 2.40 2.23
Food 11.1 –5.0 17.4 15.4 7.3 9.4 1.57 1.57 1.99
of which processed foods 11.6 2.7 2.8 4.9 2.4 3.2 0.76 0.85 1.06
Minerals (incl. crude fertiliser) 11.2 1.9 10.9 3.0 1.2 1.1 0.81 0.66 0.55 Manufacturesc 18.1 7.8 5.4 62.5 88.4 86.7 0.86 1.75 1.64
Chemicals & related products 26.6 12.6 17.8 2.1 3.9 6.2 0.23 0.64 0.83
Resource-based manufactures 17.2 –2.1 10.7 7.6 6.9 7.5 0.53 0.89 0.91
Machinery & transport equip’t 19.9 9.6 3.5 41.6 68.7 63.4 1.09 2.44 2.22
of which parts & components 18.3 12.6 2.3 24.8 40.7 36.3 2.09 3.90 3.55
Miscellaneous manufacturing 9.4 3.2 8.3 11.2 8.9 9.6 0.97 1.06 1.12 Total 15.5 5.8 6.3 100.0 100.0 100.0 1.11 1.72 1.64
PHILIPPINES
Primary products 3.1 –2.1 8.7 18.4 7.0 9.2 0.64 0.39 0.41
Agricultural products 3.8 –2.3 9.3 12.9 5.3 7.3 0.57 0.39 0.43
Agricultural raw materials 6.7 –3.1 3.0 1.4 0.6 0.7 0.24 0.21 0.19
Food 3.6 –1.8 10.1 11.5 4.7 6.6 0.70 0.43 0.50
of which processed foods 4.6 4.5 4.3 18.6 3.3 5.2 0.71 0.52 0.49
Minerals (incl. crude fertiliser) 1.6 1.6 6.8 5.7 1.7 1.9 0.90 0.40 0.33 Manufacturesc 26.4 19.8 –0.9 89.0 93.0 90.9 0.73 0.80 0.61
Chemicals & related products 3.1 –0.9 6.9 2.8 0.9 1.2 0.18 0.06 0.06
Resource-based manufactures 9.6 4.8 –3.3 5.0 2.8 2.5 0.21 0.15 0.11
Machinery & transport equip’t 40.1 26.3 –0.8 35.0 78.0 75.8 0.55 1.20 0.94
of which parts & components 59.6 25.7 2.1 47.2 58.2 59.6 2.38 2.42 2.07
Miscellaneous manufacturing 14.8 1.8 –1.5 49.3 11.4 11.4 2.56 0.59 0.47 Total 18.3 17.2 –0.3 100.0 100.0 100.0 0.66 0.75 0.58
a Annual average (%). b Two-year average (%) c Defi ned as SITC 5 through 8 less SITC 68 (non-ferrous metals).
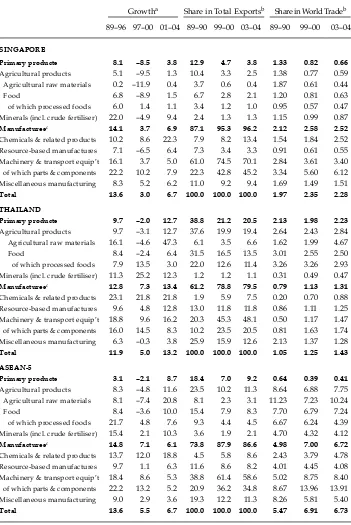
TABLE 3 (continued) Non-oil Export Performance by Major Commodity Category
Growtha Share in Total Exportsb Share in World Tradeb
89–96 97–00 01–04 89–90 99–00 03–04 89–90 99–00 03–04
SINGAPORE
Primary products 8.1 –8.5 3.8 12.9 4.7 3.8 1.33 0.82 0.66
Agricultural products 5.1 –9.5 1.3 10.4 3.3 2.5 1.38 0.77 0.59
Agricultural raw materials 0.2 –11.9 0.4 3.7 0.6 0.4 1.87 0.61 0.44
Food 6.8 –8.9 1.5 6.7 2.8 2.1 1.20 0.81 0.63
of which processed foods 6.0 1.4 1.1 3.4 1.2 1.0 0.95 0.57 0.47
Minerals (incl. crude fertiliser) 22.0 –4.9 9.4 2.4 1.3 1.3 1.15 0.99 0.87 Manufacturesc 14.1 3.7 6.9 87.1 95.3 96.2 2.12 2.58 2.52
Chemicals & related products 10.2 8.6 22.3 7.9 8.2 13.4 1.54 1.84 2.52
Resource-based manufactures 7.1 –6.5 6.4 7.3 3.4 3.3 0.91 0.61 0.55
Machinery & transport equip’t 16.1 3.7 5.0 61.0 74.5 70.1 2.84 3.61 3.40
of which parts & components 22.2 10.2 7.9 22.3 42.8 45.2 3.34 5.60 6.12
Miscellaneous manufacturing 8.3 5.2 6.2 11.0 9.2 9.4 1.69 1.49 1.51
Total 13.6 3.0 6.7 100.0 100.0 100.0 1.97 2.35 2.28
THAILAND
Primary products 9.7 –2.0 12.7 38.8 21.2 20.5 2.13 1.98 2.23
Agricultural products 9.7 –3.1 12.7 37.6 19.9 19.4 2.64 2.43 2.84
Agricultural raw materials 16.1 –4.6 47.3 6.1 3.5 6.6 1.62 1.99 4.67
Food 8.4 –2.4 6.4 31.5 16.5 13.5 3.01 2.55 2.50
of which processed foods 7.9 13.5 3.0 22.0 12.6 11.4 3.26 3.26 2.93
Minerals (incl. crude fertiliser) 11.3 25.2 12.3 1.2 1.2 1.1 0.31 0.49 0.47 Manufacturesc 12.8 7.3 13.4 61.2 78.8 79.5 0.79 1.13 1.31
Chemicals & related products 23.1 21.8 21.8 1.9 5.9 7.5 0.20 0.70 0.88
Resource-based manufactures 9.6 4.8 12.8 13.0 11.8 11.8 0.86 1.11 1.25
Machinery & transport equip’t 18.8 9.6 16.2 20.3 45.3 48.1 0.50 1.17 1.47
of which parts & components 16.0 14.5 8.3 10.2 23.5 20.5 0.81 1.63 1.74
Miscellaneous manufacturing 6.3 –0.3 3.8 25.9 15.9 12.6 2.13 1.37 1.28 Total 11.9 5.0 13.2 100.0 100.0 100.0 1.05 1.25 1.43
ASEAN-5
Primary products 3.1 –2.1 8.7 18.4 7.0 9.2 0.64 0.39 0.41
Agricultural products 8.3 –4.8 11.6 23.5 10.2 11.3 8.64 6.88 7.75
Agricultural raw materials 8.1 –7.4 20.8 8.1 2.3 3.1 11.23 7.23 10.24
Food 8.4 –3.6 10.0 15.4 7.9 8.3 7.70 6.79 7.24
of which processed foods 21.7 4.8 7.6 9.3 4.4 4.5 6.67 6.24 4.39
Minerals (incl. crude fertiliser) 15.4 2.1 10.3 3.6 1.9 2.1 4.70 4.32 4.12 Manufacturesc 14.8 7.1 6.1 73.8 87.9 86.6 4.98 7.00 6.72
Chemicals & related products 13.7 12.0 18.8 4.5 5.8 8.6 2.43 3.79 4.78
Resource-based manufactures 9.7 1.1 6.3 11.6 8.6 8.2 4.01 4.45 4.08
Machinery & transport equip’t 18.4 8.6 5.3 38.8 61.4 58.6 5.02 8.75 8.40
of which parts & components 22.2 13.2 5.2 20.9 36.2 34.8 8.67 13.96 13.91
Miscellaneous manufacturing 9.0 2.9 3.6 19.3 12.2 11.3 8.26 5.81 5.40
Total 13.6 5.5 6.7 100.0 100.0 100.0 5.47 6.91 6.73
Source: Compiled from UN Comtrade database.
beyond contrasts in the agricultural resource endowments of the two countries.8
Indonesia has done much better than the Philippines, however, and more or less matched the performance record of Malaysia in this product category.
Third, miscellaneous manufacturing (predominantly wearing apparel and foot-wear) and resource-based manufacturing (mostly mineral products) continued to account for almost two-thirds of Indonesia’s manufactured exports. By contrast, in Thailand, Malaysia and the Philippines, exports of machinery and transport equip-ment (SITC 7) expanded rapidly, dwarfi ng these ‘traditional’ export products.
Fourth, Indonesia has not so far been able to catch up with its regional neigh-bours in benefi ting from the rapidly unfolding market opportunities associated with international product fragmentation, an increasingly important source of export dynamism. For instance, in 2003–04 parts and components accounted for a mere 9.1% of exports from Indonesia, compared with 36.3% in Malaysia, 59.6% in the Philippines, 45.2% in Singapore and 20.5% in Thailand. During the period 2001–04, parts and components exports from Indonesia grew at an average annual rate of 2.3%, compared with a regional average rate of 5.2%.
Against this background, we now turn to an analysis of Indonesia’s changing comparative advantage in world trade, using Thailand as the comparator.9 In
par-ticular, what are the products in which Indonesia’s performance in world markets has been better than its overall export performance? Has the list of products that meet this criterion expanded or shrunk over the years? A useful analytical tool that helps answer these questions is the index of revealed comparative advantage (RCA), which measures a country’s export performance in individual product cat-egories relative to its overall export performance in world trade (Balassa 1965).
The RCA index of a given country (country i) in the export of product j is
exports of all goods. If the value of the RCAindex exceeds unity for commodity j, the country is said to have ‘revealed’ comparative advantage in world trade of that commodity. In contrast, if the RCAindex is below unity, the country is at a comparative disadvantage in world trade of the commodity.
8 In addition to a rich agricultural resource endowment, a number of other factors seem to have underpinned Thai export success in processed food. These include: a highly liberal for-eign investment policy that facilitated involvement of MNEs in both production (in the early years of export expansion) and trade; the long-standing policy of the Thai government not to intervene in domestic wholesale or retail trade, which provided an environment conducive to the evolution of highly effi cient domestic marketing and distribution networks; and the
pivotal role played by the ethnic Chinese business community—in particular the Charoen Pokphand (CP) Group—in branching out into food processing for export, based on their deep historical roots in domestic trade in agricultural products and as suppliers of fertiliser and seeds to Thai farmers (Jaffee and Gordon 1993; Kohpaiboon 2005: ch. 7).
9 Thailand is perhaps the best regional comparator because of the nature of its resource endowment, its stage of development and its export composition.
We estimated the RCA index of Indonesia and Thailand in commodities identi-fi ed at the two-digit SITC (Revision 3) level over the period 1990–2004. The analy-sis covered total merchandise exports excluding oil and gas (SITC 3) and special export items listed under SITC 9. In table 4, annual average RCA index estimates for 1990–94 (a period of very rapid export growth in the region, before the crisis) and 2000–04 (after the crisis and recovery period) are reported; RCA indices for individual commodities are shown in appendix table A, together with data on the share of each commodity in Indonesian and world exports.
These estimates must be used with caution, because domestic policy measures (such as production subsidies), foreign trade barriers (such as voluntary export restraints, or VERs), or trade preferences (such as preferential market access under the generalised system of preferences, or GSP), which have nothing to do with com-parative advantage, can infl uence the measured value. In analysing Indonesia’s export patterns, we have to keep in mind a notable supply-side factor: the log export ban introduced in 1981, which caused a boom in plywood and other processed wood exports (Lindsay 1989; Barbier et al. 1995; Resosudarmo and Yusuf 2005).10
10 In April 1981, the Indonesian government introduced a ban on manual logging cou-pled with a ‘vertical integration requirement’ for logging rights (that is, logging rights were issued only to companies that operated wood-processing mills) with the aim of reducing tax evasion by logging companies and, more importantly, promoting the domestic ply-wood industry and other ply-wood-based industries. In 1992, the log ban was replaced by a cascading tariff structure for log and other forestry products (with rates as high as 200%). The ban was reintroduced in November 2001, with the declared aim of protecting plywood and other wood-processing industries from competition with China. These interventionist policies have certainly boosted plywood and other wood-based products through high effective protection, but it is questionable whether they have delivered net national eco-nomic gains in terms of government revenue and employment generation.
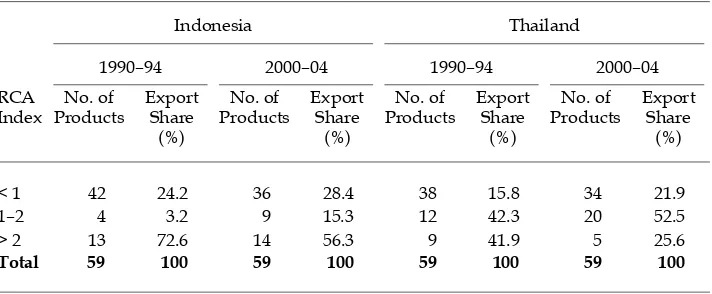
TABLE 4 Indonesia and Thailand: Distribution of Non-oil Exports by Revealed Comparative Advantage (RCA) Category
(5-year averages)
a For details of products by SITC category, see appendix table A.
Source: Compiled from UN Comtrade database.
With this exception, export production in Indonesia during the period under study has not been supported by export taxes on inputs or direct export subsidies. On the demand side, exports of wearing apparel have been signifi cantly infl uenced by export quotas under the MFA. Other than this, Indonesian exports have not signifi -cantly benefi ted from, or been adversely affected by, the trade policies of importing countries. So far Indonesia has resisted the temptation to embrace the newfound global fondness for forming free trade agreements (FTAs).
The fi rst impression from a comparison of the RCA estimates is that the revealed comparative advantage in world trade (the pattern of export speciali-sation) of both Indonesia and Thailand is broadly based, unlike that of many developing countries whose strength in international exchange lies in one or a few products. For instance, in Indonesia 23 products, accounting for 71.6% of total non-oil exports in 2000–04, had RCA indices above unity (table 4). The comparable fi gures for Thailand were 25 products and 78.1% of total export value. However, there are several notable differences in the RCA estimates of the two countries, and these are vital to explaining the differences in their over-all export performance.
First, primary products (food, beverages and tobacco, agricultural raw mate-rials and minerals) have continued to occupy a relatively important position among products with revealed comparative advantage in Indonesia (appendix table A). In 1990–94, there were 11 such products among the 17 products with above-unity RCA indices (‘RCA products’), and they accounted for over one-quarter (27.0%) of total non-oil exports. In 2000–04, 13 of the 23 RCA products belonged to the primary product category, and these accounted for more or less the same share of total exports. By contrast, in Thailand the number of RCA products in the primary category increased from 9 out of 21 to 10 out of 25, and their share in total exports fell from 27.9% to 18.6% between 1990–94 and 2000–04.
Second, within the primary product category, RCA products in Thailand are heavily concentrated in food and beverages, refl ecting the country’s well-known success in the processed food trade. In contrast, Indonesia’s revealed comparative advantage in primary exports is predominantly in agricultural raw materials and minerals. In the food and beverage sub-category, Indonesia has maintained above-unity RCA indices only in fi sh products (SITC 03), coffee, tea, cocoa and spices (SITC 07) and tobacco and tobacco manufactures (SITC 12), whereas Thailand’s revealed comparative advantage in this area has been broadly based, encompassing meat and meat products (SITC 01, mostly chicken meat), fi sh and fi sh products (SITC 03), cereals and cereal preparations (SITC 04), vegetables and fruit (SITC 05) and sugar and sugar preparations (SITC 06). These patterns reconfi rm our earlier inference that, despite having a broadly similar agricultural resource endowment, Indonesia has been less successful than Thailand in benefi ting from the growing world demand for processed food.
Third, within manufacturing, Indonesia’s comparative advantage has contin-ued to remain confi ned largely to traditional labour-intensive manufactures— textiles (SITC 65), furniture (SITC 82), various categories of clothing (SITC 84), footwear (85) and a few domestic resource-based products—fertiliser (SITC 56), rubber goods (SITC 62), cork and wood manufactures (predominantly plywood)
(SITC 63)11 and paper and paper products (SITC 64). Within the broad (one-digit)
category of machinery and transport equipment (SITC 7), which has been the main vehicle for rapid growth in world trade during the period under study, only one product (telecommunications and sound equipment: SITC 76) has achieved RCA status in the Indonesian export structure. In contrast, Thailand’s revealed comparative advantage in manufacturing has become increasingly broad-based over the years, with a number of products belonging to the machinery and trans-port equipment category accounting for an increasing share of total extrans-ports. The RCA indices of offi ce machines (SITC 75), telecommunications and sound equip-ment (SITC 76) and electrical machine apparatus and parts (SITC 77) rose between 1990–94 and 2000–04, accompanied by an increase in their combined share in total exports from 22.6% to 34.4%. Thailand also continued to maintain RCA in a number of resource-based and traditional labour-intensive manufacturing prod-ucts, although the magnitude of the RCA index recorded a notable decline in the cases of travel goods, clothing and footwear.
THE CHINA FACTOR
Ever since the People’s Republic of China (henceforth ‘China’) began to emerge as a major trading nation in the early 1990s, there has been growing concern in Indonesia and other countries in the region that competition from this quar-ter would crowd out their export opportunities (James 2002; James et al. 2003; Holst and Weiss 2004). This concern gained added impetus from China’s acces-sion to the World Trade Organization (WTO) in 2001, and from the abolition of the MFA and the integration of textile and apparel products into the tariff-based system that came into effect from January 2005. The WTO accession not only provides China with most-favoured nation (MFN) status in major markets, but also enhances its attractiveness to export-oriented investment by reducing country investment risk.
The purpose of this section is to bring together some data relevant to this debate. We look fi rst at competition from China in relation to exports from Indo-nesia and the other ASEAN countries in third-country markets. This is followed by an enquiry into new export opportunities for Indonesia in the expanding Chi-nese economy.
Competition from China in third-country markets
A useful starting point for examining the possible displacement of exports from ASEAN countries (or other countries) by exports from China in third-country markets is to gain some idea of the degree of overlap (similarity) in the exports of China and the ASEAN countries to these markets. The trade displacement effect would be important if and only if China exports the same types of com-modities as other countries to a given market. If the exports are dissimilar (that is, subject to little or no ‘commodity overlap’) then there is little scope for trade displacement.
11 The very high RCA index for wood products mainly refl ects high effective export
pro-tection emanating from the restrictions on log exports (see footnote 10).
A useful indicator that permits comparison of commodity composition among countries is the Finger–Kreinin export similarity index (Finger and Kreinin 1979). The index is defi ned by the formula intended to compare only patterns of exports across product categories; it is not infl uenced by the absolute value of total exports.
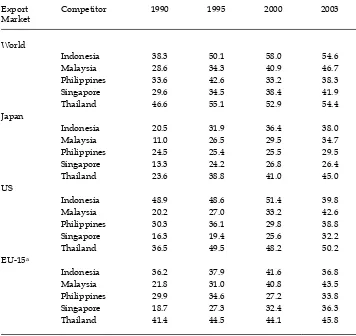
For this analysis we constructed the export similarity index using data for 3-digit SITC products, again excluding oil and gas (SITC 3) and special export items (SITC 9). These are the most disaggregated data available under the constraint that the commodity categories be consistent across the various importing coun-tries. Estimation of export similarity between China and the ASEAN-5 countries was undertaken for the total world market and the three major regional markets, the US, Japan and the original 15 member countries of the European Union (EU). The estimates are reported in table 5.
The overlap between the export composition of China and that of each of the fi ve countries is far from perfect. The index is below 60 for all fi ve countries at all time points. This means that these countries should have ample room to experi-ence independent growth trajectories regardless of China’s rapid export growth. The magnitudes and time patterns of the index for Thailand and Indonesia are remarkably similar. The indices are much smaller for Singapore, Malaysia and the Philippines than for Thailand and Indonesia. This refl ects the fact that the former countries’ exports are more concentrated in electronics and electrical goods than those of China.
In sum, the estimates suggest that the impact of trade displacement occasioned by China’s export expansion could be expected to be less severe than commonly thought. Moreover, it would appear that the impact of trade diversion would be similar for Thailand and Indonesia, but smaller for Singapore, Malaysia and the Philippines. Has the actual export experience of these countries been consistent with these expectations?
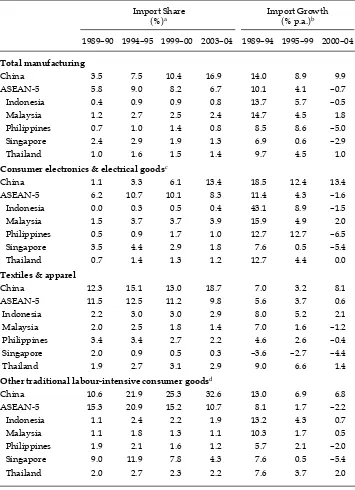
To shed light on this question, data on the comparative export performance of China and the fi ve ASEAN countries in the US market are summarised in table 6. The table covers total manufacturing exports and three sub-categories thereof— consumer electronics, textiles and apparel, and other traditional labour-intensive products (mainly footwear, and travel and sporting goods)—which are of par-ticular relevance to export market penetration for developing countries. Previ-ous studies of competition from China in third-country markets have commonly used the share of China and other countries in imports to the given markets. This approach may be misleading, however, if imports from both China and a given country grow, but China maintains a faster growth rate. To allow for this
ity, both market shares and the growth rate of imports are used as complementary measures in the analysis.
China’s share in US imports of manufactures increased from 7.5% in 1994–95 to 16.9% in 2003–04 (table 6). The combined share of the fi ve ASEAN countries declined, but at a slow rate (from 9.0% to 6.7%) compared with the massive increase in China’s market share. Estimates for other countries (not reported here) suggest that Hong Kong and Taiwan have experienced much sharper contractions in their market share than the ASEAN countries, combined with persistent negative export growth. This comparative performance record is consistent with the view that most of the growth in Chinese exports to devel-oped country markets so far has stemmed from the rapidly diminishing com-parative advantage of the NIEs in conventional labour-intensive product lines. TABLE 5 Indices of Non-oil Export Similarity between China and ASEAN-5 Countries
Export Market
Competitor 1990 1995 2000 2003
World
Indonesia 38.3 50.1 58.0 54.6
Malaysia 28.6 34.3 40.9 46.7
Philippines 33.6 42.6 33.2 38.3
Singapore 29.6 34.5 38.4 41.9
Thailand 46.6 55.1 52.9 54.4
Japan
Indonesia 20.5 31.9 36.4 38.0
Malaysia 11.0 26.5 29.5 34.7
Philippines 24.5 25.4 25.5 29.5
Singapore 13.3 24.2 26.8 26.4
Thailand 23.6 38.8 41.0 45.0
US
Indonesia 48.9 48.6 51.4 39.8
Malaysia 20.2 27.0 33.2 42.6
Philippines 30.3 36.1 29.8 38.8
Singapore 16.3 19.4 25.6 32.2
Thailand 36.5 49.5 48.2 50.2
EU-15a
Indonesia 36.2 37.9 41.6 36.8
Malaysia 21.8 31.0 40.8 43.5
Philippines 29.9 34.6 27.2 33.8
Singapore 18.7 27.3 32.4 36.3
Thailand 41.4 44.5 44.1 45.8
a EU-15 refers to the 15 member states of the European Union before its enlargement in 2004: Austria, Belgium, Denmark, Finland, France, Germany, Greece, Ireland, Italy, Luxembourg, the Netherlands, Portugal, Spain, Sweden and the United Kingdom.
Source: Compiled from UN Comtrade Database (importer records).
These product lines have rapidly ‘migrated’ to China from the NIEs through investment links (Lardy 2002: 160–2). In textiles and apparel, both Indonesia and Thailand have managed to maintain their market shares, even though the rate of growth of exports has declined markedly. In consumer electronics, Indo-nesia has performed poorly compared to Malaysia and Thailand, while in other traditional labour-intensive products (mainly footwear, and travel and sporting goods) there is no notable difference in export performance among the three countries.
One interesting related issue that needs further analysis is whether Indonesia’s poor performance in the US market could be ascribed to preferences offered to partner countries which compete directly with Indonesia in certain products that loom large in its exports to these markets (e.g. much higher tariffs on cloth-ing imports to the US from Indonesia than from Mexico). However, as we shall see later in the paper, preferential tariffs do not seem to be a signifi cant factor in explaining the relative export performance of these two countries in the US textile and clothing market.12
The patterns of change in the import market shares of China and the ASEAN countries in the Japanese and EU markets (not reported here) are broadly simi-lar to those in the US market. The combined shares of the ASEAN countries in imports of textiles and apparel and other traditional labour- intensive products by both Japan and the EU have declined since 1994–95 in the face of rapid mar-ket penetration by imports from China. However, the magnitude of the decline is much smaller than the large increase in China’s market share in both cases. A comparison of data for all major source countries (also not reported here) reveals that, as in the US case, the brunt of competition from China was borne by the East Asian NIEs, in particular Taiwan and Hong Kong. In both markets, there is no notable difference in the changes in market share in textiles and apparel and other traditional labour-intensive products between Indonesia, Thailand, Malaysia and the Philippines.
In sum, competition from China has obviously begun to have a considerable impact on the trading environment faced by Indonesia and other developing coun-tries in the region. However, there is clear evidence that competition from China does not necessarily imply a proportionate loss in market share for all develop-ing countries. In general, the East Asian NIEs have begun to experience greater market share losses than Indonesia, Malaysia, Thailand and the Philippines. It is also important to note that China’s comparative advantage is not going to remain
12 An important point to note here is that the term ‘free trade agreement’ is a misnomer, because in order to become eligible for duty-free market access, partner countries must meet rules of origin (ROOs), which in most cases eat into the ‘published’ preference mar-gin in practice. For instance, under the North American Free Trade Agreement (NAFTA), Mexico gains duty-free access to the US clothing market only if the products meet the ‘triple transformation’ condition (that is, that the transformation from raw material to fi
n-ished clothing has been undertaken within the NAFTA area). The relative cost disadvan-tage arising from the use of yarn and textiles imported from the US (instead of from a low-cost source such as China or India) to meet this condition could well erase all or a signifi cant portion of the preference margin for clothing exports to the US offered under
NAFTA (Krishna 2004).
TABLE 6 Manufacturing Imports to the US from Selected Asian Countries
Import Share
(%)a Import Growth (% p.a.)b
1989–90 1994–95 1999–00 2003–04 1989–94 1995–99 2000–04
Total manufacturing
China 3.5 7.5 10.4 16.9 14.0 8.9 9.9
ASEAN-5 5.8 9.0 8.2 6.7 10.1 4.1 –0.7
Indonesia 0.4 0.9 0.9 0.8 13.7 5.7 –0.5
Malaysia 1.2 2.7 2.5 2.4 14.7 4.5 1.8
Philippines 0.7 1.0 1.4 0.8 8.5 8.6 –5.0 Singapore 2.4 2.9 1.9 1.3 6.9 0.6 –2.9
Thailand 1.0 1.6 1.5 1.4 9.7 4.5 1.0
Consumer electronics & electrical goodsc
China 1.1 3.3 6.1 13.4 18.5 12.4 13.4
ASEAN-5 6.2 10.7 10.1 8.3 11.4 4.3 –1.6 Indonesia 0.0 0.3 0.5 0.4 43.1 8.9 –1.5
Malaysia 1.5 3.7 3.7 3.9 15.9 4.9 2.0
Philippines 0.5 0.9 1.7 1.0 12.7 12.7 –6.5 Singapore 3.5 4.4 2.9 1.8 7.6 0.5 –5.4
Thailand 0.7 1.4 1.3 1.2 12.7 4.4 0.0
Textiles & apparel
China 12.3 15.1 13.0 18.7 7.0 3.2 8.1
ASEAN-5 11.5 12.5 11.2 9.8 5.6 3.7 0.6
Indonesia 2.2 3.0 3.0 2.9 8.0 5.2 2.1
Malaysia 2.0 2.5 1.8 1.4 7.0 1.6 –1.2
Philippines 3.4 3.4 2.7 2.2 4.6 2.6 –0.4 Singapore 2.0 0.9 0.5 0.3 –3.6 –2.7 –4.4
Thailand 1.9 2.7 3.1 2.9 9.0 6.6 1.4
Other traditional labour-intensive consumer goodsd
China 10.6 21.9 25.3 32.6 13.0 6.9 6.8
ASEAN-5 15.3 20.9 15.2 10.7 8.1 1.7 –2.2 Indonesia 1.1 2.4 2.2 1.9 13.2 4.3 0.7
Malaysia 1.1 1.8 1.3 1.1 10.3 1.7 0.5
Philippines 1.9 2.1 1.6 1.2 5.7 2.1 –2.0 Singapore 9.0 11.9 7.8 4.3 7.6 0.5 –5.4
Thailand 2.0 2.7 2.3 2.2 7.6 3.7 2.0
a Period average (% per annum).
b Annual averages.
c Computers, peripherals, and television and radio receivers (including parts and components).
d Mainly footwear, and travel and sporting goods.
Source: Compiled from UN Comtrade database (importer records).
the same over time. Economic theory and historical experience tell us that China’s economic dynamism will change its international comparative advantage. As the Chinese economy becomes more integrated into the global economy, domestic wages will start to increase, eroding China’s comparative advantage in labour-intensive products.
China as a new export market
China’s trade has expanded at a record-setting pace with the promise its market offers to foreign fi rms. Its foreign trade expanded from about $20 billion annu-ally in the late 1970s to over $800 billion in 2004. By that year, its share of total world trade had increased ten-fold since 1977, and it was the world’s third-largest trading country after the US and Germany (WTO 2005). China has also become part of global production networks for computers and other information technol-ogy hardware, having increasingly been drawn into these networks as foreign fi rms took advantage of the combination of low labour costs and a liberal foreign investment environment. To what extent has Indonesia benefi ted so far from the new market opportunities in China, compared with its ASEAN neighbours?
Total merchandise exports from Indonesia to China increased from about $350 million annually (about 2% of total Chinese imports) in the fi rst half of the 1990s to over $10 billion (5%) in 2004, recording an average annual growth rate of 28%. The growth of non-oil exports was somewhat slower, rising from $300 million to $9 billion (an average annual growth rate of 18%).
1989–90 1992 1994 1996 1998 2000 2002 2004 0
100 200 300 400 500 600
Indonesia
Malaysia
Philippines
Singapore
Thailand
FIGURE 4 Non-oil Exports to China: Indonesia, Malaysia, the Philippines, Singapore and Thailanda
($, 1989–90 = 100)
a Compound annual growth rates for 1990–2004 are: Indonesia, 18.1%; Malaysia, 22.6%; Philippines, 33.2%; Singapore, 23.0%; Thailand, 27.8%; ASEAN-5, 22.2%. 1989–90 data are an average of the two years.
Source: Based on data compiled from UN Comtrade database.
Total non-oil exports from the ASEAN-5 countries to China in the years 1989–90 to 2004 are plotted in fi gure 4. While Indonesia’s export growth rate for the period (18%) is respectable, it is notably lower than those of the other four countries (Malay-sia 23%, Singapore 23%, Thailand 28%, and the Philippines 33%). The growth rate differentials between Indonesia and the other four countries have in fact widened over the years. For instance, during the period 2000–05, Indonesian exports grew at an average annual rate of 22.2%, whereas the growth rates for the other countries varied between 29.4% for Malaysia and 46.5% for Thailand, and the regional aver-age was 33.1%.13 Refl ecting these differences in growth rates, Indonesia’s share in non-oil exports from the ASEAN-5 countries plus Vietnam (‘ASEAN-6’) to China declined from 25.7% in 1989–90 to 10.7% in 2004 (table 7). Meanwhile Thailand’s share rose markedly and those of the other ASEAN-5 countries stayed much the same. While the proportion of each economy’s exports going to China rose, the increase was slower for Indonesia than for the other countries.
The data reported in table 8 help to explain the sources of Indonesia’s rela-tively poor performance in penetrating the Chinese market. Contrary to popular belief, manufactured goods, not primary products, have been the most dynamic export product category in ASEAN–China trade. Manufacturing’s share in total
13 Growth rates computed from data obtained from the UN Comtrade database. TABLE 7 ASEAN-6 Non-oil Exports to Chinaa
1989–90b 1994–95b 1999–00b 2001 2002 2003 2004
Country composition of exports to China (%)
Indonesia 25.7 21.0 17.5 13.5 14.1 12.8 10.7 Malaysia 20.1 27.0 19.5 23.3 25.5 22.6 19.4 Philippines 4.5 2.5 4.6 4.9 6.6 7.2 7.9 Singapore 35.3 32.3 33.8 32.1 32.9 33.6 35.1 Thailand 14.4 17.3 16.7 17.4 14.0 19.0 23.5
Vietnam 0.0 0.0 8.0 8.7 6.9 4.8 3.4
ASEAN-6 100 100 100 100 100 100 100
Exports to China as a share of total exports (%)
Indonesia 2.9 3.6 4.4 3.9 5.1 6.3 7.2
Malaysia 2.1 3.0 3.0 4.3 5.6 6.7 6.9
Philippines 0.9 1.9 1.7 2.5 3.9 5.9 9.1
Singapore 2.1 2.2 3.7 4.5 5.6 7.2 8.8
Thailand 1.9 2.5 3.7 4.5 4.9 7.3 9.8
Vietnam 0.0 0.0 8.6 9.5 8.6 7.8 7.0
ASEAN-6 2.1 2.7 3.6 4.4 5.4 6.9 8.3
a ASEAN-6 is Asean-5 plus Vietnam.
b Two-year average (%).
Source: Compiled from UN Comtrade database.
TABLE 8 ASEAN-5 Non-oil Exports to China by Commodity Group
Growtha Share in Total Exportsb
1989–2000 2001–04 1989–04 1989–90 1999–2000 2003–04
INDONESIA
Primary products 12.8 12.0 11.6 11.9 41.5 46.3
Agricultural products 14.9 10.1 12.6 7.9 40.3 39.9
Agricultural raw materials 20.5 8.4 15.9 1.7 23.1 20.6
Food 11.6 12.2 10.8 6.2 17.1 19.3
of which processed foods 47.8 12.3 43.7 4.2 7.1 3.3 Minerals (incl. crude fertiliser) 0.1 40.3 8.2 4.2 1.2 6.4
Manufacturesc 4.1 8.9 4.9 88.0 58.5 53.7
Chemicals & related products 8.2 13.2 8.7 11.6 17.2 20.6 Resource-based manufactures 2.8 3.0 2.6 71.0 36.4 22.7 Machinery & transport equipment 4.4 24.9 8.4 5.4 3.8 9.1 of which parts & components 38.0 22.5 31.0 0.0 2.3 4.5
Miscellaneous manufactures 28.6 13.8 22.6 0.0 1.1 1.4
Total 6.2 10.3 6.6 100.0 100.0 100.0 MALAYSIA
Primary products 3.1 14.9 5.5 81.9 30.7 27.9
Agricultural products 2.6 15.8 5.3 81.6 27.7 26.7
Agricultural raw materials 4.2 8.3 4.8 24.8 11.5 7.0
Food 1.8 19.8 5.5 56.9 16.3 19.7
of which processed foods 9.2 60.5 25.9 14.2 3.0 6.1 Minerals (incl. crude fertiliser) 21.1 2.5 14.9 0.2 2.9 1.2
Manufacturesc 15.3 17.1 14.5 18.1 69.3 72.1
Chemicals & related products 15.7 22.6 15.9 2.3 9.4 13.4
Resource-based manufactures 9.8 7.3 8.4 9.0 12.5 7.1
Machinery & transport equipment 19.3 17.8 17.4 5.8 44.5 48.4 of which parts & components 23.9 19.7 20.9 1.9 30.5 36.8
Miscellaneous manufactures 14.0 18.2 13.8 0.9 2.8 3.1
Total 8.1 16.5 9.3 100.0 100.0 100.0 PHILIPPINES
Primary products 6.5 11.5 7.1 44.2 32.5 14.6
Agricultural products 8.0 10.4 7.9 10.0 9.9 4.1
Agricultural raw materials 6.3 5.4 5.6 2.0 1.3 0.4
Food 8.4 11.1 8.3 8.0 8.5 3.7
of which processed foods 46.9 18.1 34.9 4.0 6.7 2.9 Minerals (incl. crude fertiliser) 6.0 12.0 6.9 34.2 22.7 10.5
Manufacturesc 9.1 29.6 12.7 55.8 67.5 85.4
Chemicals & related products –5.8 7.4 –2.5 53.8 3.2 1.0
Resource-based manufactures 14.8 7.7 11.9 0.9 2.9 1.0
Machinery & transport equipment 41.3 30.5 35.1 0.2 59.0 78.5 of which parts & components 69.6 26.0 52.0 0.0 52.1 54.2
Miscellaneous manufactures 13.2 44.1 18.5 0.9 2.4 6.4
Total 8.1 25.2 11.1 100.0 100.0 100.0
a Annual average (%). b Two-year average (%). c Defi ned as SITC 5 through 8 less SITC 68 (non-ferrous metals).
TABLE 8 (cont.) ASEAN-5 Non-oil Exports to China by Commodity Group
Growtha Share in Total Exportsb
1989–2000 2001–04 1989–04 1989–90 1999–2000 2003–04
SINGAPORE
Primary products –0.2 9.7 2.0 36.6 5.9 4.0
Agricultural products –3.0 8.0 –0.4 34.2 3.1 1.9
Agricultural raw materials –2.2 4.7 –0.5 17.0 1.8 0.9
Food –3.9 11.8 –0.2 17.3 1.2 1.0
of which processed foods –4.4 51.6 10.3 13.3 0.5 0.5 Minerals (incl. crude fertiliser) 9.8 11.3 9.3 2.4 2.8 2.1
Manufacturesc 11.1 16.3 11.3 63.2 94.1 96.0
Chemicals & related products 6.8 18.6 8.9 25.5 16.8 19.5
Resource-based manufactures 6.9 10.7 7.2 6.0 4.1 2.9
Machinery & transport equipment 13.4 16.3 13.0 28.3 64.6 65.9 of which parts & components 17.3 17.1 15.8 9.0 42.0 44.8
Miscellaneous manufactures 13.8 13.6 12.6 3.6 8.6 7.5
Total 9.0 16.0 9.8 100.0 100.0 100.0 THAILAND
Primary products 2.7 16.5 5.5 89.9 31.4 25.1
Agricultural products 2.5 17.0 5.5 89.8 30.2 24.9
Agricultural raw materials 3.1 28.1 8.2 42.7 16.3 24.9
Food 1.9 4.0 2.3 47.1 14.0 5.1
of which processed foods 19.5 34.3 27.3 21.2 9.0 5.7 Minerals (incl. crude fertiliser) 18.6 13.7 15.9 0.2 1.1 0.8
Manufacturesc 18.6 21.9 17.8 10.0 68.6 74.9
Chemicals & related products 17.8 21.8 17.3 2.4 14.5 15.7 Resource-based manufactures 14.8 22.2 15.2 3.1 11.0 12.1 Machinery & transport equipment 23.3 21.9 21.0 2.6 41.0 44.6 of which parts & components 34.2 13.3 26.2 0.3 29.8 19.5
Miscellaneous manufactures 8.8 22.6 11.1 1.8 2.2 2.4
Total 8.1 20.4 10.1 100.0 100.0 100.0 ASEAN-5
Primary products 4.8 11.9 4.0 51.9 26.1 19.9
Agricultural products 4.4 12.1 6.1 48.3 22.7 17.5
Agricultural raw materials 5.0 16.1 9.6 19.4 10.2 10.1
Food 4.0 10.5 5.7 28.9 12.5 8.6
of which processed foods 12.3 26.3 19.2 12.4 3.9 2.7 Minerals (incl. crude fertiliser) 8.0 13.4 15.4 3.6 3.5 2.9
Manufacturesc 10.6 17.7 18.6 48.1 74.0 80.2 Chemicals & related products 8.0 18.8 3.2 14.5 13.6 15.7 Resource-based manufactures 5.6 10.0 28.5 19.7 11.6 7.8 Machinery & transport equipment 15.3 19.2 43.1 12.0 44.3 52.3 of which parts & components 20.4 18.1 52.3 3.4 30.2 33.5
Miscellaneous manufactures 13.3 17.0 30.8 1.8 4.4 4.7
Total 8.3 16.3 9.4 100.0 100.0 100.0
Source: Compiled from UN Comtrade database.
ASEAN-5 exports to China increased from 48.1% in 1989–90 to 80.2% in 2003–04, and manufacturing accounted for over 75% of the total export increment between these two periods. Within manufacturing, machinery and transport equipment, and in particular its parts and components sub-category, has been the most dynamic export item. It seems that China is becoming increasingly involved in intra-regional specialisation in assembly activities in these industries, and ASEAN countries have begun to benefi t from this new form of intra-regional specialisation (Athukorala 2005). However, Indonesia has not been able to profi t from these market opportunities to the same extent as other countries. In fact, among the ASEAN-5 countries, Indonesia is unique for the persistent decline in the share of manufacturing (from 88.0% in 1989–90 to 53.7% in 2003–04) in its exports to China. This decline seems to refl ect its poor performance in machin-ery and transport equipment exports, and especially in the parts and compo-nents sub-category. Interestingly, Indonesia has done relatively well in non-oil primary exports compared with the other two resource-rich countries, Thailand and Malaysia. However, this has failed make a big difference in overall relative export performance, given the strong manufacturing bias in China’s demand for ASEAN exports.
THE IMPLICATIONS OF MFA ABOLITION
In the lead-up to the expiry of the Multi-fi bre Arrangement in January 2005, there was much anxiety and confusion in Indonesian policy circles about the future of the country’s textile and apparel exports. The widely held view was that Indo-nesia was highly vulnerable to export contraction in the new quota-free market, in the face of strong competition from China and from relatively low-cost Asian competitors such as Sri Lanka, Bangladesh and India (James 2002; James, Ray and Minor 2003; Aswicahyono and Hill 2004: 291–2). Competitive pressure was also expected to come from African countries, which enjoy privileged access to the US market under the African Growth and Opportunity Act (AGOA), and from various other developing countries that had entered into preferential trading agreements with the US and the EU. Relatively higher wage growth in Indonesia (under the new minimum wage legislation) and other labour market rigidities were cited as additional disadvantages Indonesia was likely to suffer in the new non-MFA market context (Alisjahbana and Manning 2002: 293).
The data on textile and clothing exports from Indonesia for the fi rst 11 months of the post-MFA era, reported in table 9, are not consistent with these predic-tions, however. The combined export value of these products rose 11.3% during this period compared with the same period in 2004. At this rate, 2005 is likely to record the highest ever value of textiles and clothing exports (about $8 billion) from Indonesia. Clothing exports have increased at a much faster rate (13.2%) than textile exports (8.6%). As one would expect a priori, export value growth between January and November 2005 has emanated predominantly from export volume growth in both textiles and clothing. Removal of export quotas naturally leads to a reduction in (competitive) market prices as the quota rent dissipates. At the same time, exporting countries have greater room for volume expansion based on relative cost advantage as the quota restrictions are removed. It seems that, even under various constraints on the supply side (see below), Indonesia