INTRODUCTION
The demand of soybean in Indonesia is in-creasing by years. Meanwhile, the production is decreasing. The national production and import of soybean in 2015 reached 963,099 ton and 2,256,931.7 ton respectively (BPS, 2016). High rate of soybean import can be suppressed through the improvement of national soybean production. The improvement of soybean production can be achieved through land intensification, which is the
Effects of Planting Pattern on The Performance of Soybean
Genotypes
DOI: 10.18196/pt.2018.079.39-48
Titik Sundari* and Herdina Pratiwi
Indonesian Legumes and Tuber Crops Research Institute, Jalan Raya Kendalpayak, Km 8. PO Box 66, Malang, Indoensia 65101 *Corresponding author, email: [email protected]
ABSTRACT
Plant population is one of key factors in crops yield. The determination of optimum population per area unit needs to be accommodated through the planting space arrangement. This study aimed to know the performance of some soybean genotypes planted with both single and double row planting pattern. The research was conducted in Kendalpayak Experimental Field, Malang from February to May 2017 arranged in split plot experimental design with three replications. The main plot was planting space consisting of single row (40 cm x 15 cm) and double row (60 cm x 20 cm x 15 cm), while the sub-plot was the soybean genotypes consisting of 12 promising lines (Grob/IT-7-7, Grob/Pander-397-6, Grob/IT-17-1, IBK/Argop-276-3, Grob/Pander-395-2, Grob/ Pander-428-1, Grob/IT-7-5, Grob/IT-7-2, Grob/IAC-453-7, IBK/ Grob-296-10, Grob/IT-7-3, and Grob/IT-7-1) and 3 cultivars as comparison (Dena 1, Dena 2, and Grobogan). Each experimental unit was set in an area of 10.8 m2. Observation was performed on variables of plant height, number of fertile nodes, number of pods with three seeds, number of pods with two seeds, number of sterile pods, seeds dry weight, pod shells dry weight, weight of 100 seeds, and yields. The results of the research showed that each genotype performed different response to planting space depending on the characteristic of it. Yield obtained from double row planting space was 4.76% higher than that from single row planting space. There were 8 genotypes (Grob/IT-7-7, Grob/ Pander-397-6, Dena 1, Grob/IT-7-5, Grob/IT-7-2, Grob/IAC-453-7, Grob/IT-7-3, and Grob/IT-7-1) which were able to produce seeds > 2.0 ton/ha, either planted in single row or double row planting space..
Keywords:Double row, Single row, Yield component
ABSTRAK
Populasi tanaman merupakan salah satu faktor penentu hasil tanaman. Penentuan populasi optimum per satuan luas perlu diakomodasi melalui pengaturan jarak tanam. Penelitian bertujuan untuk mengetahui penampilan beberapa genotipe kedelai pada pola tanam baris ganda maupun baris tunggal. Penelitian dilakukan di Kebun Percobaan Kendalpayak, Malang pada bulan Februari-Mei 2017, menggunakan rancangan split plot (petak terbagi), tiga ulangan. Petak utama adalah jarak tanam, yaitu baris tunggal (40 cm x 15 cm) dan baris ganda (60 cm x 20 cm x 15 cm), sedangkan anak petak adalah 15 genotipe kedelai, terdiri dari 12 galur harapan (Grob/IT-7-7, Grob/Pander-397-6, Grob/IT-17-1, IBK/Argop-276-3, Grob/Pander-395-2, Grob/Pander-428-1, Grob/IT-7-5, Grob/ IT-7-2, Grob/IAC-453-7, IBK/ Grob-296-10, Grob/IT-7-3, dan Grob/IT-7-1) dan 3 varietas pembanding (Dena 1, Dena 2, dan Grobogan). Masing-masing unit perlakuan ditanam pada luasan 10,8 m2. Pengamatan dilakukan terhadap karakter tinggi tanaman, jumlah cabang, jumlah buku subur, jumlah polong isi 3, jumlah polong isi 2, jumlah polong hampa, bobot kering biji, bobot kering kulit polong, bobot 100 biji, dan hasil biji. Hasil penelitian menunjukkan bahwa setiap genotipe memperlihatkan respon yang berbeda terhadap jarak tanam, tergantung dari karakteristik masing-masing genotipe. Hasil biji yang dicapai pada pola tanam baris ganda 4,76% lebih tinggi dibandingkan baris tunggal. Terdapat 8 genotipe (Grob/IT-7-7, Grob/Pander-397-6, Dena 1, Grob/IT-7-5, Grob/ IT-7-2, Grob/IAC-453-7, Grob/IT-7-3, dan Grob/IT-7-1) yang mampu menghasilkan biji > 2,0 ton/ha, baik pada perlakuan baris tunggal maupun baris ganda.
Kata Kunci: Baris ganda, Baris tunggal, Komponen hasil
best management of agricultural land in order to improve agricultural yield by using existing technol-ogy. According to Mauad et al. (2010), among these management practices, planting times, cultivar options and plant spacing are factors that modify the yield of soybeans and the yield components.
regard-less of variety. The results of research conducted by Rahman et al. (2011) showed that soybean yields increased with increasing crop density and highest yields were obtained in populations of 80 to 100 plants / m2 depending on varieties and
seasons. Further population increase will reduce seed yield. These results indicated that each variety and growing season required different optimum populations.
According to Lee et al. (2008), the optimal soybean plant population ranged from 108,000 to 232,000 plants / ha for the May planting period and 238,000 to 282,000 ha-1 plants for the June planting period. The economically optimal plant population is 7 to 33% lower than the optimal population. Meanwhile, increased crop population density leads to decreased yield of soybeans (De Bruin and Pederson, 2009). Optimum crop popu-lations are a prerequisite for obtaining higher soy-bean productivity, so it is important to determine the number of crops per unit area most suitable for better yields (Gulluoglu et al., 2016).
The optimal crop population is determined by plant spacing. Setting spacing determines the position between plants. The position of adjacent plants allows competition. The main competitive factors are identified as competition for light, wa-ter, and nutrition (Brant et al., 2009). According to Egli (1988) and Wells et al. (1993) there are two general concepts that can illustrate the relationship between row spacing, crop density, and yields. First, the maximum yield can be obtained only when the plant is capable of producing sufficient leaf area for maximum light interception during reproductive growth. Second, long distances between crops will maximize yields as the competition between crops diminishes.
Several studies show that soybeans grown in double row planting patterns will express increased yield of beans higher than those grown in single
rows, if all growth factors, especially soil and soil moisture, are not a limiting factor (Bruns, 2011a; 2011b). According to Gulluoglu et al. (2016), soy-bean planting on a double row planting pattern of 80 cm x 25 cm x 80 cm x 3 cm (63 plants / m2) gives higher yields than single rows 70 cm x 4
cm (35 plants / m2), with increased yield reached
24.5%. The results of Kurt et al. (2017) stated that double rows on peanuts can increase pod yields 15.79 - 17.86% compared to single rows.
The purpose of planting space management will be achieved if supported by the selection of soybean genotype that adapts well to the desired cropping pattern. The aim of this research is to know the performance of each genotype of soybean on double row and single row planting pattern.
MATERIALS AND METHODS
The research was conducted at Kendalpayak Experimental Field, Malang at MK I (February-May 2017). The location of the study has a height of 445 m above sea level with a heavy Entisol soil type. The experiment was arranged in a split plot design with three replications. The main plot is plant spacing, i.e. L1: single row (40 cm x 15 cm) and L2: double row s(60 cm x 20 cm x 15 cm), while sub-plot is 15 soybean genotypes, consisting of 12 promising lines (Grob / IT-7-7, Grob / Pander-397-6, Grob / IT-17-1, IBK / Argop-276-3, Grob / Pander-395-2, Grob / Pander-428-1, Grob / IT -7-5, Grob / IT-7-2, Grob / IAC-453-7, IBK / Grob-296-10, Grob / IT-7-3, and Grob / IT-7-1) and 3 cultivars as comparison (Dena 1, Dena 2, and Grobogan). Each treatment unit was planted in a plot measuring 10.8 m2 with
the same population per plot between single row and double row, i.e. 360 plants (each hole contains two plants).
planting by spraying the land with herbicide dose 2 ml / L water, the second with weeding at the age of 4 weeks after planting. Pests and diseases were controlled by using pesticides (insecticides and fungicides) which were applied every 5 days. The spraying volume of the pesticide was 400 L / ha in the vegetative phase and 500 L / ha in the generative phase. Watering was done at planting time, flowering and soybean pod forming phase.
Observations were made on plant height, num-ber of branches, numnum-ber of fertile nodes, numnum-ber of pods with 3 seeds, number of pods with 2 seeds, number of sterile pods, dry weight of seeds, leaf dry weight, 100 seed weight, and seed yield. The collected data were analyzed with ANOVA based on split plot experimental design with three rep-lications. To compare the two middle values LSD test was performed at α 5%. Correlation analysis was used to know the relationship between yield component and yield.
RESULTS AND DISCUSSIONS
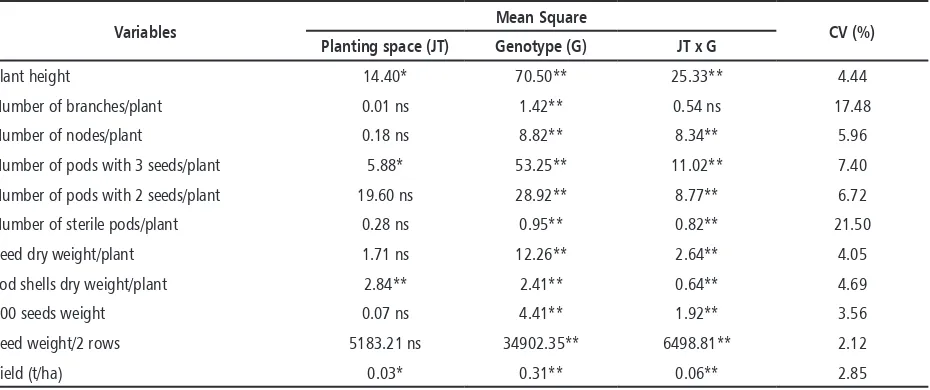
The result of analysis variance (ANOVA) on the character of the yield component and the yield showed the influence of the interaction between the genotype and the planting space of all observed
characters, except the number of branches (Table 1). The presence of interactions showed that each genotype showed a different response to the treat-ment of planting space.
Yield component
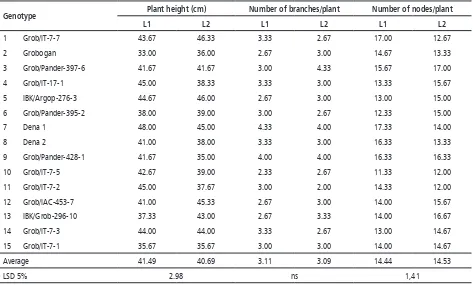
The soybean genotypes tested in two planting space treatments showed different plant height (Table 2). The average plant height of the soybean genotype on the double row was shorter than that on the single row (Table 2). This is presumably because the soybean planted in the double row with space of 60 cm x 20 cm x 15 cm gets more sunlight than the plants that are on a single row with space of 40 cm x 15 cm. According to the results of Chauhan and Opena (2013) research, soybeans grown at tight spacing have a tendency to increase plant height, due to light competition. Dena 1 is a genotype with the highest posture on single row treatment and Grobogan is the shortest posture genotype. In the double row, the highest plant posture is shown by Grob/IT-7-7 and the lowest is shown by Grob/Pander-428-1.
The number of soybean genotype branches test-ed was not influenctest-ed by the interaction between genotype and planting space, but the difference
Table 1. The Result of Anova on The Yield Component and The Yield of Soybean Genotypes
Variables Mean Square CV (%)
Planting space (JT) Genotype (G) JT x G
Plant height 14.40* 70.50** 25.33** 4.44 Number of branches/plant 0.01 ns 1.42** 0.54 ns 17.48 Number of nodes/plant 0.18 ns 8.82** 8.34** 5.96 Number of pods with 3 seeds/plant 5.88* 53.25** 11.02** 7.40 Number of pods with 2 seeds/plant 19.60 ns 28.92** 8.77** 6.72 Number of sterile pods/plant 0.28 ns 0.95** 0.82** 21.50 Seed dry weight/plant 1.71 ns 12.26** 2.64** 4.05 Pod shells dry weight/plant 2.84** 2.41** 0.64** 4.69 100 seeds weight 0.07 ns 4.41** 1.92** 3.56 Seed weight/2 rows 5183.21 ns 34902.35** 6498.81** 2.12 Yield (t/ha) 0.03* 0.31** 0.06** 2.85
Table 2. Average of Plant Height, Number of Branches, Number of Nodes of Soybean Genotypes in Two Kinds of Planting Space
Genotype Plant height (cm) Number of branches/plant Number of nodes/plant
L1 L2 L1 L2 L1 L2
1 Grob/IT-7-7 43.67 46.33 3.33 2.67 17.00 12.67 2 Grobogan 33.00 36.00 2.67 3.00 14.67 13.33 3 Grob/Pander-397-6 41.67 41.67 3.00 4.33 15.67 17.00 4 Grob/IT-17-1 45.00 38.33 3.33 3.00 13.33 15.67 5 IBK/Argop-276-3 44.67 46.00 2.67 3.00 13.00 15.00 6 Grob/Pander-395-2 38.00 39.00 3.00 2.67 12.33 15.00 7 Dena 1 48.00 45.00 4.33 4.00 17.33 14.00 8 Dena 2 41.00 38.00 3.33 3.00 16.33 13.33 9 Grob/Pander-428-1 41.67 35.00 4.00 4.00 16.33 16.33 10 Grob/IT-7-5 42.67 39.00 2.33 2.67 11.33 12.00 11 Grob/IT-7-2 45.00 37.67 3.00 2.00 14.33 12.00 12 Grob/IAC-453-7 41.00 45.33 2.67 3.00 14.00 15.67 13 IBK/Grob-296-10 37.33 43.00 2.67 3.33 14.00 16.67 14 Grob/IT-7-3 44.00 44.00 3.33 2.67 13.00 14.67 15 Grob/IT-7-1 35.67 35.67 3.00 3.00 14.00 14.67 Average 41.49 40.69 3.11 3.09 14.44 14.53
LSD 5% 2.98 ns 1,41
Note: L1: single row: 40 cm x 15 cm, L2: double rows: 60 cm x (20 cm x 15 cm), ns: not significant.
in the number of branches was more due to the genotype difference (Table 1). The average number of branches of each genotype is presented in Table 2. The largest number of branches in a single row was achieved by Dena 1 followed by Grob / Pan-der-428-1, while in the double line was achieved by Grob/Pander-397-6. Based on the number of branches, it is known that the genotype tested is classified as a branched type. Dena 1 and Grob / Pander-428-1 had a large number of branches, either in single or double rows, i.e. 4 branches / plants. According to the research of Gulluoglu et al. (2016), soybeans produced more branches per plant at low plant density (31.6 m-1 plants),
com-pared to high crop density (69.9 m-1). At low plant
densities, plants develop more branches because of low competition levels. When the crop density is high, the branching of each plant is reduced and the number of lateral branches is also reduced. This result is consistent with Cox and Cherney (2011)
findings; Worku and Astatkie (2011); Rahman and Hossain (2011) and Shamsi and Kobraee (2011).
Number of nodes/plant of the genotypes tested showed difference in each planting space (Table 1). Number of nodes of genotype is presented in Table 2. The largest number of nodes in single row treatment was achieved by Dena 1, while in double rows was achieved by Grob/Pander-397-6.
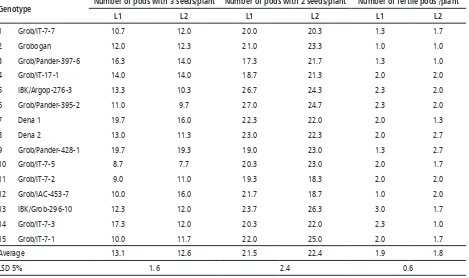
Grob-296-Table 3. Average Number of Pods With 3 Seeds, Pods With 2 Seeds, and Sterile Pods Ofsoybean Genotypes in Two Kinds of
Planting Space
Genotype Number of pods with 3 seeds/plant Number of pods with 2 seeds/plant Number of fertile pods /plant
L1 L2 L1 L2 L1 L2
1 Grob/IT-7-7 10.7 12.0 20.0 20.3 1.3 1.7 2 Grobogan 12.0 12.3 21.0 23.3 1.0 1.0 3 Grob/Pander-397-6 16.3 14.0 17.3 21.7 1.3 1.0 4 Grob/IT-17-1 14.0 14.0 18.7 21.3 2.0 2.0 5 IBK/Argop-276-3 13.3 10.3 26.7 24.3 2.3 2.0 6 Grob/Pander-395-2 11.0 9.7 27.0 24.7 2.3 2.0 7 Dena 1 19.7 16.0 22.3 22.0 2.0 1.3 8 Dena 2 13.0 11.3 23.0 22.3 2.0 2.7 9 Grob/Pander-428-1 19.7 19.3 19.0 23.0 1.3 2.7 10 Grob/IT-7-5 8.7 7.7 20.3 23.0 2.0 1.7 11 Grob/IT-7-2 9.0 11.0 19.3 18.3 2.0 2.0 12 Grob/IAC-453-7 10.0 16.0 21.7 18.7 1.0 2.0 13 IBK/Grob-296-10 12.3 12.0 23.7 26.3 3.0 1.7 14 Grob/IT-7-3 17.3 12.0 20.3 22.0 2.3 1.0 15 Grob/IT-7-1 10.0 11.7 22.0 25.0 2.0 1.7 Average 13.1 12.6 21.5 22.4 1.9 1.8
LSD 5% 1.6 2.4 0.6
Note: L1 : single row : 40 cm x 15 cm, L2 : double row: 60 cm x (20 cm x 15 cm)
10 and double rows was achieved by Dena 2 and Grob / Pander-428-1. The average number of fertile pods in double rows was 35 pods / plant and in single rows was 34.6 pods / plant. Accord-ing to Bell (2005), plantAccord-ing soybean with double row planting pattern can produce more number of pods per plant and increase yield compared to single row planting pattern. According to Table 3, it is known that there are 5 genotypes (IBK / Argop-276-3, Grob / Pander-395-2, Dena 1, Dena 2, and Grob / IT-7-3) capable of producing many fertile pods in single row and 10 genotypes (Grob / IT-7-7, Grobogan, Grob / Pander-397-6, Grob / IT-17-1, Grob / Pander-428-1, Grob / IT-7-5, GROB / IT-7 -2, GROB / IAC-453-7, IBK / GROB-296-10, GROB / IT-7-1) in the double row. An increase in the number of pods in the double row treatment is due to the degree of competition between the crops grown at wider distances when compared to those planted at dense planting space.
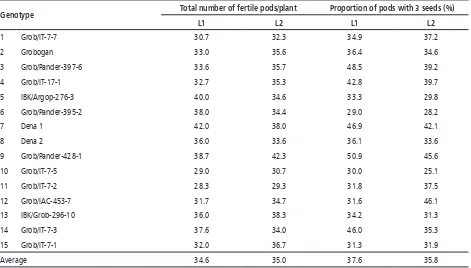
The proportion of the number of pods with 3 seeds to total pods per plant is presented in Table 4. There were 10 genotypes (Grobogan, Grob / Pander-397-6, Grob / IT-17-1, IBK / Argop-276-3 , Dena 1, Dena 2, Grob / Pander-428-1, Grob / IT-7-5, IBK / Grob-296-10, and Grob / IT-7-3) able to provide more proportion of pods with 3 seeds in single row than in double rows, and there were 3 genotypes (Grob / IT-7-7, Grob / IT-7-2, and Grob / IAC-453-7) capable of giving more propor-tion of pods with 3 seeds in double rows than in single row .
Yield
Table 4. Total Number of Fertile Pods and Proportion of Pods with 3 Seeds in Yield Trial
Genotype Total number of fertile pods/plant Proportion of pods with 3 seeds (%)
L1 L2 L1 L2
1 Grob/IT-7-7 30.7 32.3 34.9 37.2
2 Grobogan 33.0 35.6 36.4 34.6
3 Grob/Pander-397-6 33.6 35.7 48.5 39.2 4 Grob/IT-17-1 32.7 35.3 42.8 39.7 5 IBK/Argop-276-3 40.0 34.6 33.3 29.8 6 Grob/Pander-395-2 38.0 34.4 29.0 28.2
7 Dena 1 42.0 38.0 46.9 42.1
8 Dena 2 36.0 33.6 36.1 33.6
9 Grob/Pander-428-1 38.7 42.3 50.9 45.6 10 Grob/IT-7-5 29.0 30.7 30.0 25.1 11 Grob/IT-7-2 28.3 29.3 31.8 37.5 12 Grob/IAC-453-7 31.7 34.7 31.6 46.1 13 IBK/Grob-296-10 36.0 38.3 34.2 31.3 14 Grob/IT-7-3 37.6 34.0 46.0 35.3 15 Grob/IT-7-1 32.0 36.7 31.3 31.9
Average 34.6 35.0 37.6 35.8
Note: L1: single row: 40 cm x 15 cm, L2: double rows: 60 cm x (20 cm x 15 cm).
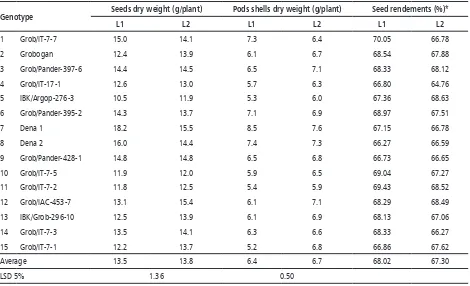
in Table 5. The highest yield in single row treat-ment was achieved by Dena 1 and the lowest was achieved by IBK / Argop-276-3, while in the double row treatment the highest plant seed weight was achieved by Dena 1 and Grob / IAC-453-7, while the lowest was achieved by IBK / Argop-276-3.
Grob / IT-7-1 had the highest seed rendements among genotypes tested in single row, with yield of seeds reaching 70.05%, while the lowest seed rende-ments was achieved by IBK / Argop-276-3 reaching 66.27% (Table 5 ). The highest seed rendements in the double row was achieved by Grob / IT-7-7 of 68.63% and the lowest was 64.76% achieved Grob / IT-7-5. These results indicated that the yield of seeds achieved in a single row was higher than that achieved in the double row. The average of seed rendements in single row was 68.1% and in double row was 67.3%. These results are different from those of Mascagni et al. (2008), and Bruns (2011a), which stated that the seed rendements of beans achieved in double row planting pattern was
higher than that achieved in single row planting pattern.
genotypes were not affected by the treatment of planting space. Different responses were shown by each genotype to planting space, depending on the characteristics and needs of the plant, especially the extent of the expansion of the canopy.
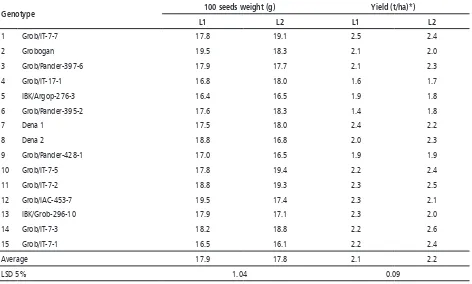
In single row, one genotype, Grob / IAC-453-7, had weight of 100 seeds which was equivalent to that of cultivar Grobogan. While in the double rows, there were 4 genotypes weighing 100 seeds larger than Grobogan, i.e. Grob / IT-7-7 , Grob / IT-7-5, Grob / IT-7-2, and Grob / IT-7-3. The strains are the result of crossing of cultivar Grobo-gan as female breeds that have the characteristics of large seeds.
The average yield achieved in the double rows was higher than the single row, with an increase of 4.76% (Table 6). The increase in the yield is thought to be due to the width of the row (60 cm) in the double rows that allows the leaves to absorb more sunlight as an energy source in the photosyn-thesis process, so that the rate of photosynphotosyn-thesis
increases and as a result the seed yield increases. According to Burns (2011b), this is thought to be due to better penetration of light and agrochemi-cals, as well as an increase in photosynthetic rate in double rows planting patterns, which can maximize yield. The results of Mascagni et al. (2008) reported that planting soybeans with double rows planting patterns can increase seed yield by 12.6 and 13.1% compared to single row. Other results suggest that planting soybeans with double row planting pat-terns can increase soybean yield by 17% compared to single row (Grichar, 2007).
Correlation between Yield Component and Yield
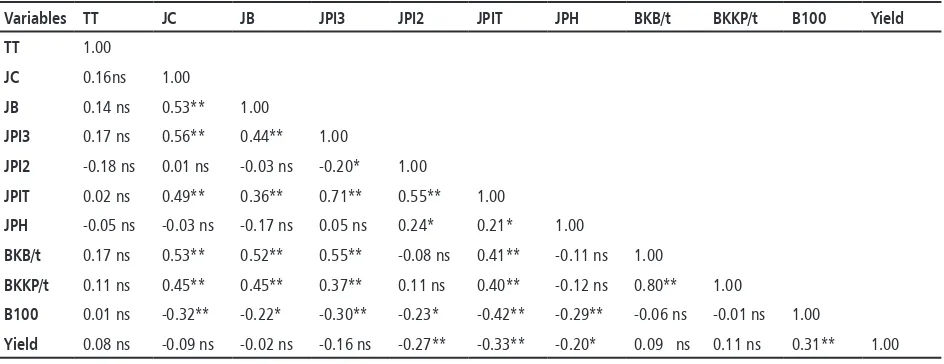
The results of correlation analysis between the variables of yield component and yield are pre-sented in Table 7. The result of correlation analysis showed that yield was significantly and positively correlated with the weight of 100 seeds with the correlation coefficient (r) of 0.31. It means that the increase in weight of 100 seeds (seed size) is closely
Table 5. Average of Seeds Dry Weight and Pods Shells Dry Weight of Soybean Genotypes in Two Kinds of Planting Space
Genotype Seeds dry weight (g/plant) Pods shells dry weight (g/plant) Seed rendements (%)*
L1 L2 L1 L2 L1 L2
1 Grob/IT-7-7 15.0 14.1 7.3 6.4 70.05 66.78 2 Grobogan 12.4 13.9 6.1 6.7 68.54 67.88 3 Grob/Pander-397-6 14.4 14.5 6.5 7.1 68.33 68.12 4 Grob/IT-17-1 12.6 13.0 5.7 6.3 66.80 64.76 5 IBK/Argop-276-3 10.5 11.9 5.3 6.0 67.36 68.63 6 Grob/Pander-395-2 14.3 13.7 7.1 6.9 68.97 67.51 7 Dena 1 18.2 15.5 8.5 7.6 67.15 66.78 8 Dena 2 16.0 14.4 7.4 7.3 66.27 66.59 9 Grob/Pander-428-1 14.8 14.8 6.5 6.8 66.73 66.65 10 Grob/IT-7-5 11.9 12.0 5.9 6.5 69.04 67.27 11 Grob/IT-7-2 11.8 12.5 5.4 5.9 69.43 68.52 12 Grob/IAC-453-7 13.1 15.4 6.1 7.1 68.29 68.49 13 IBK/Grob-296-10 12.5 13.9 6.1 6.9 68.13 67.06 14 Grob/IT-7-3 13.5 14.1 6.3 6.6 68.33 66.27 15 Grob/IT-7-1 12.2 13.7 5.2 6.8 66.86 67.62 Average 13.5 13.8 6.4 6.7 68.02 67.30
LSD 5% 1.36 0.50
Table 6. Average of 100 Seeds Weight and Yield of Soybean Genotypes in Two Kinds of Planting Space
Genotype 100 seeds weight (g) Yield (t/ha)*)
L1 L2 L1 L2
1 Grob/IT-7-7 17.8 19.1 2.5 2.4
2 Grobogan 19.5 18.3 2.1 2.0
3 Grob/Pander-397-6 17.9 17.7 2.1 2.3
4 Grob/IT-17-1 16.8 18.0 1.6 1.7
5 IBK/Argop-276-3 16.4 16.5 1.9 1.8 6 Grob/Pander-395-2 17.6 18.3 1.4 1.8
7 Dena 1 17.5 18.0 2.4 2.2
8 Dena 2 18.8 16.8 2.0 2.3
9 Grob/Pander-428-1 17.0 16.5 1.9 1.9
10 Grob/IT-7-5 17.8 19.4 2.2 2.4
11 Grob/IT-7-2 18.8 19.3 2.3 2.5
12 Grob/IAC-453-7 19.5 17.4 2.3 2.1 13 IBK/Grob-296-10 17.9 17.1 2.3 2.0
14 Grob/IT-7-3 18.2 18.8 2.2 2.6
15 Grob/IT-7-1 16.5 16.1 2.2 2.4
Average 17.9 17.8 2.1 2.2
LSD 5% 1.04 0.09
Note: L1: single row: 40 cm x 15 cm, L2 : double rows: 60 cm x (20 cm x 15 cm), *) = at seed water content of 11%.
related to the increase of seed yield. This result is in accordance with Ohyama et al. (2013) mentioning that the size of the beans directly affects the crop. Meanwhile, the weight of 100 seeds was signifi-cantly and negatively correlated with the number of branches, the number of fertile nodes, the number of pods with 3 and 2 seeds, and the total number of fertile pods (Table 7). It means that the increase in the value of those characters is closely related to the weight loss of 100 seeds, which will affect the yield achieved. This is evidenced by the existence of a real negative correlation between the yield with the number of fertile pods. The yield was significantly and negatively correlated with the number of pods per plant with a correlation coefficient of -0.33, meaning that the increase in the number of pods per plant is closely related to the decrease in seed yield. This is because the more number of pods the contents, the more sinks that must be supplied but not balanced with the source. Less number of pods causes the allocation of photosynthates from source to sink is more focused and efficient so that
the size of the beans becomes larger even though the number of pods is less. Yasari et al. (2009) reported that the reduction of interest as sinks in soybean causes the number of pods per plant to decrease. However, it causes the size of the beans to be larger due to more assimilate allocation to the intended sink.
Table 7. Coefficient Correlation Between Variables of Yield Component and Yield of Soybean
Variables TT JC JB JPI3 JPI2 JPIT JPH BKB/t BKKP/t B100 Yield TT 1.00
JC 0.16ns 1.00
JB 0.14 ns 0.53** 1.00
JPI3 0.17 ns 0.56** 0.44** 1.00
JPI2 -0.18 ns 0.01 ns -0.03 ns -0.20* 1.00
JPIT 0.02 ns 0.49** 0.36** 0.71** 0.55** 1.00
JPH -0.05 ns -0.03 ns -0.17 ns 0.05 ns 0.24* 0.21* 1.00
BKB/t 0.17 ns 0.53** 0.52** 0.55** -0.08 ns 0.41** -0.11 ns 1.00
BKKP/t 0.11 ns 0.45** 0.45** 0.37** 0.11 ns 0.40** -0.12 ns 0.80** 1.00
B100 0.01 ns -0.32** -0.22* -0.30** -0.23* -0.42** -0.29** -0.06 ns -0.01 ns 1.00
Yield 0.08 ns -0.09 ns -0.02 ns -0.16 ns -0.27** -0.33** -0.20* 0.09 ns 0.11 ns 0.31** 1.00
Note: Significant differences according LSD test was performed at α 5% [**p < 0.001, *p < 0.05, ns (not significant)], TT = plant height, JC=number of branches, JB=number of fertile nodes, JPI3=number of pods with 3 seeds, JPI2 = number of pods with 2 seeds, JPIT =total number of fertile pods, JPH = number of sterile pods, BKB/t = seeds dry weight/plant, BKKP/t = pods shells dry weight/plant, B100 = 100 seeds weight, Yield= yield/plot.
CONCLUSION
Based on the results of the research, it can be concluded that: each genotype performed different response to the planting space tested depending on its characteristic. Each genotype has its own proper planting space to produce seeds optimally. There were 10 genotypes which were able to pro-duce seeds >2 t/ha in single row and 9 genotypes in double rows. Among those genotypes, there were eight genotypes which were able to produce high yield when planted with both single row and double rows, i.e. Grob/IT-7-7, Grob/Pander-397-6, Dena 1, Grob/IT-7-5, Grob/IT-7-2, Grob/IAC-453-7, Grob/IT-7-3, and Grob/IT-7-1. To know the stability of each genotype’s yield in each planting system, the research needs to be repeated in differ-ent planting season and location.
REFERENCES
Abady, S., F. Merkeb, and Z. Dilnesaw. 2013. Heritability and path-coefficient analysis in soybean (Glycine max L Merrill) geno-types at Pawe, Northwestern Ethiopia. J. Environ. Sci. Water Resour. 2: 270-276.
Aditya, J., P. Bhartiya, and A. Bhartiya. 2011. Genetic variability, heritability and character association for yield and component characters in soybean (G. max (L.) Merrill). J. Central Eur.Agric.
12: 27-34. DOI: 10.5513/JCEA01/12.1.877
Akond, A. G., M. Bobby, R. Bazzelle, W. Clark, S. K. Kantartzi, K. Mek-sem, and A. Kassem. 2013. Effect of two row spaces on several agronomic traits in soybean [Glycine max (L.) Merr.]. Atlas J.
of Plant Biology. 1(2):18-23. DOI: 10.5147/ajpb.2013.0073 Badan Pusat Statistik BPS. 2016. Statistik Indonesia. 680p. Bell, A. 2005. Higher yields with twin-row soybeans. Available at
http://delta-farmpress.com/higher-yields-twin-row-soybeans (verified 25 Feb. 2011). Delta Farm Press, Penton Media, New York.
Brant, V., K. Necká, J. Pivec, M. Duchoslav, J. Holec, P. Fuksa, and V. Venclová. 2009. Competition of some summer catch crops and volunteer cereals in the areas with limited precipitation. Plant, Soil and Environment. 55: 17–24.
Bruns, H. A. 2011a. Planting date, rate, and twin-row vs. single-row soybean in the Mid-South. Agronomy J., 103(5): 1308-1313. Bruns, H. A. (2011b). Comparisons of single-row and twin-row
soybean production in the Mid-South. Agron J. 103(3): 702–708. De Bruin, J. L. and P. Pedersen. 2009. New and old soybean cultivar responses to plant density and intercepted light. Crop Science. 49(6): 2225-2232.
Chauhan, B. S. and J. L. Opena. 2013. Effect of plant spacing on growth and grain yield of soybean. American Journal of Plant Sciences. 4: 2011-2014.
Cox, W. J. and J. H. Cherney. 2011. Growth and yield responses of soybean to row spacing and seeding rate. Agronomy J. 03(1): 123-128.
Egli, D. B. 1988. Plant density and soybean yield. Crop Science, 28: 977-980.
Grichar, W. J. 2007. Row spacing, plant populations and cultivar effects on soybean production along Texas Gulf Coast. Crop Manag. doi: 10.1094/CM-2007-0615-01-RS
Gulluoglu, L., H. Bakal, and H. Arioglu. 2016. The effects of twin-row planting pattern and plant population on seed yield and yield components of soybean at late double-cropped planting in Cukurova region. Turkish Journal Field Crop, 21(1): 59-65. Kurt, C., H. Bakal, L. Gulluogulu, and H. Arioglu. 2017. The effect of
Lee, C. D., D. B. Egli, and D. M. TeKrony. 2008. Soybean response to plant population at early and late planting dates in the Mid-South. Agronomy Journal. 100(4): 971-976. doi:10.2134/ agronj2007.0210
Lyimo, L. D., M. R.Tamba, and R. R. Madege. 2017. Effects of geno-type on yield and yield component of soybean (Glycine max
(L) Merrill). African Journal of Agricultural, 12(22): 1930-1939. DOI: 10.5897/AJAR2017.12177
Mascagni, H.J., E. Clawson, D. Lanclos, D. Boquet, and R. Ferguson. 2008. Comparing single-row, twin-row configurations for Louisiana crop production. Lousiana Agriculture, 51 (3): 16-17. Mauad, M., T. L. B. Silva, A. I. Almeida Neto, and V. G. Abreu. 2010. Influência da densidade de semeadura sobre características agronômicas na cultura da soja. Agrarian. 3: 175-181. Ngalamu, T., M. Ashraf, and S. Meseka. 2013. Soybean (Glycine
max L) genotype and environment interaction effect on yield and other related traits. American J. Exp. Agric., 3(4): 977-987. Ohyama, T., R. Minagawa, S. Ishikawa, M. Yamamoto, N. Van Phi
Hung, N. Ohtake, K. Sueyoshi, T. Sato, Y. Nagumo, and Y. Taka-hasi. 2013. Soybean Seed Production and Nitrogen Nutrition. In J. E. Board (Ed.). Agricultural and Biological Sciences “A Comprehensive Survey of International Soybean Research-Genetics, Physiology, Agronomy and Nitrogen relationships”, pp. 115-157. Intech, Japan.
Rahman, M.M., M.M. Hossain, M.P. Anwar, and A. S. Juraimi. 2011. Plant density influence on yield and nutritional quality of soy-bean seed. Asian Journal of Plant Sciences. 10(2): 125-132. doi: 10.3923/ajps.2011.125.132
Rahman, M. M. and M. M. Hossain. 2011. Plant density effects on growth, yield and yield components of two soybean varieties under equidistant planting arrangement. Asian Journal of Plant Sciences 10(5): 278-286. DOI: 10.3923/ajps.2011.278.286 Shamsi, K. and S. Kobraee. 2011. Soybean agronomic responses
to plant density. Annals of Biological Research. 4: 168-173. Wells, R. J., J. W. Burton, and T.C. Kilen. 1993. Soybean growth and
light interception: response to differing leaf and stem morphol-ogy. Crop Science. 33: 520-524. DOI:10.2135/cropsci1993.00 11183X003300030020x
Worku, M. and T. Astatkie. 2011. Row and plant spacing effects on yield and yield components of soya bean varieties under hot humid tropical environment of Ethiopia. J. Agronomy and Crop Science 19, 67-74.