Project:
Measuring Fairness in Supply Chain Trading Relationships
Authors:
A collaboration between Kent Business School, IIED, Oxfam GB and Unilever
Paper:
Measuring Fairness
in Supply Chain
Trading
Relationships:
This paper is part of a publication series generated by the New Business Models for Sustainable Trading Relationships project. The partners in the four-year project – the Sustainable Food Laboratory, Rainforest Alliance, the International Institute for Environment and Development, the International Center for Tropical Agriculture, and Catholic Relief Services – are working together to develop, pilot, and learn from new business models of trading relationships between small-scale producers and formal markets. By working in partnership with business and looking across a diversity of crop types and market requirements – fresh horticulture, processed vegetables, pulses, certified coffee and cocoa – the collaboration aims to synthesize learning about how to increase access, benefits, and stability for small-scale producers while generating consistent and reliable supplies for buyers. This paper is also the result of a collaboration between NBMSTR partners and a joint project between Unilever and Oxfam on learning how to do business with smallholders.
For further information see:
www.sustainablefoodlab.org/projects/ ag-and-development and http://www. linkingworlds.org/
Please contact Justin Tait at
[email protected] or Abbi Buxton at [email protected] if you have any questions or comments.
ISBN 978-1-84369-876-0
Available to download at www.iied.org/pubs ©International Institute for Environment and Development/Oxfam 2012
All rights reserved
This guide and tool kit was developed by the Centre for Value Chain Analysis at Kent Business School (University of Kent), the International Institute for Environment and Development and a collaboration between Oxfam GB and Unilever plc. It is licensed under a Creative Commons Attribution-NonCommercial 3.0 Unported License <http://creativecommons.org/ licenses/by-nc/3.0/>
Chapter title 1
Measuring Fairness in Supply
Chain Trading Relationships:
Methodology Guide
Table of contents
Glossary ___________________________________ 2
Preface ____________________________________ 3
Introduction _______________________________ 4
1. Conceptual framework __________________ 6 1.1 The five key principles of sustainable
supply chains _________________________ 6 2. Measuring fairness ______________________ 9 2.1 Survey design _________________________ 9 2.2 Choice of survey method ______________ 10 2.3 Questionnaire design __________________ 11 2.4 Sampling strategy _____________________ 11 2.5 Conducting the survey _________________13
2Measuring Fairnes in Supply Chain Trading Relationships: methodology guide
Buyer the actor or actors in the supply chain who purchase raw or processed materials. These could be end buyers, such as Unilever, or intermediary buyers such as traders or processing factories
Downstream refers to the activities of processing, distribution and retail in an agricultural supply chain
Smallholders typically farm less than 2 hectares (but this is crop specific, can be 10 hectares or more in tea or palm oil); run family farms where the family largely relies on agriculture for its livelihood and most of the family’s food is produced on the farm
Supplier the actor or actors who grow, process and deliver within the supply chain
Supply chain refers to the network of relationships, activities and mechanisms that exist to move produce from the point of production to the point of sale Surveyor the person/organization
commissioning the survey and responsible for running it Upstream refers to the activities of
farm-level production in an agricultural supply chain
Preface
In July 2010 Oxfam and the international consumer goods company Unilever began a five-year project to work in collaboration to explore, develop and implement innovative smallholder-based sourcing models for food ingredients.
In March 2012 IIED and its partners concluded a four-year, Gates Foundation-funded project looking at the implementation of sustainable trading relationships for smallholders’
participation in formal markets. As a part of the project IIED began to develop a tool to measure and understand the sustainability of the
relationships in smallholder-based supply chains.
As with the IIED work, Oxfam and Unilever want to understand the sustainability of trading relationships that involve smallholder producers as set up under various initiatives.
IIED and Oxfam have long collaborated with partners, such as the Sustainable Food Lab, to understand the guiding principles for
establishing fair and inclusive smallholder-based supply chains. A natural progression from this work was to develop a survey and analysis tool and methodology to capture and analyze data from these metrics.
Together with the Centre for Value Chain Research at the University of Kent, IIED and Oxfam developed such a tool, to provide evidence of the principles in action by looking at the relationships between actors in the chain. The tool provides a health check on the state of relationships and gives an indication of where further investigation may be required. The following Methodology Guide explains the conceptual foundation of the metrics, the survey design and implementation, and how to analyse and apply the results. The Survey Instruments Tool is available separately at http://pubs.iied. org/G03429.html?. Finally, a Survey Analysis Tool is available in the form of an Excel
spreadsheet (see Part 3) and can be requested from either Abbi Buxton or Justin Tait (details below).
The tool is aimed primarily at two audiences: i) procurement teams for organizations sourcing agricultural raw materials wholly or partly from smallholder producers; and ii) development organizations implementing value chain projects. The survey tool and methodology are in early stages of development. This beta version of them is being rolled out to selected partners to use and test and we look forward to engaging with you on it.
Abbi Buxton, IIED & Justin Tait, Unilever/Oxfam
Abbi Buxton
Researcher, Sustainable Markets Group International Institute for Environment and Development (IIED)
Tel: +44(0)2034637443 Email: [email protected]
Justin Tait
Project Sunrise Learning and Communications Manager Unilever/Oxfam
Introduction
A supply chain is a system of organizations, people, technology, activities, information and resources involved in moving a product or service from supplier to customer. Supply chain activities transform natural resources, raw materials and components into a finished product that is delivered to the end customer. The increasing environmental costs of these networks and growing consumer pressure for eco-friendly products mean that sustainability is becoming the watchword of corporations the world over. Sustainable supply chains are (1) lean – they use resources efficiently; (2) agile – they respond to market signals quickly; (3) resilient – they have the capacity to bounce back from external shocks; and (4) responsible – they are sensitive to social and environmental pressures (Fearne, 2009). This growing emphasis on sustainability is resulting in a significant re-positioning of supply chain management from being a functional necessity to a potential sustainable competitive advantage. The development of sustainable supply chains requires a shift in buyer–supplier relationships from being opportunistic and arm’s length to strategic and collaborative. Collaborative buyer– supplier relationships involve trust, commitment, transparency and integrity and are one of the fundamental enablers for the efficient and effective flow of information and allocation of resources within and between organizations.
However, buyer–supplier relationships don’t become collaborative by themselves or overnight. They require an investment of time, effort and – in certain circumstances – financial resources, from buyers and suppliers. Most importantly, they require a change in the attitudes and perceptions of buyers and sellers – the people at the interface of buyer–supplier relationships.
This Methodology Guide and accompanying survey tool are designed to help businesses better understand the sustainability of their trading relationships. It does so by measuring how actors along the supply chain perceive the fairness of the relationships they are involved in. Understanding these perceptions is the first step in improving the long-term viability of these relationships and in developing mutually beneficial arrangements.
Introduction 5
The Methodology Guide and survey tool have been developed by researchers at Kent Business School, who have expertise in the analysis of supply chain relationships, in conjunction with practitioners from Unilever, Oxfam and the International Institute for Environment and Development (IIED), who are actively engaged in projects designed to develop sustainable supply chains involving smallholders in developing countries.
The Guide comprises five parts:
• Part one describes the conceptual framework for the development of sustainable supply chains involving smallholders in developing countries, of which the measurement of buyer–supplier relationships is a part.
• Part two explains the measurement process – survey method and questionnaire design – and provides practical guidance on
sampling and the administration of the survey.
• Part three covers the analysis of the survey data and interpretation of the results.
• Part four outlines dissemination and impact.
• Part five reviews some of the data limitations that still need to be resolved.
Please also see accompanying Survey Instruments Tool available at http://pubs.iied. org/G03429.html?, which contains the questionnaires and interview guidelines used during surveys of all links in the supply chain.
1.1 The five key principles of
sustainable supply chains
Sustainable buyer–supplier relationships in supply chains involving developing country smallholders are based on five key principles: 1. Fair and transparent governance: an
overarching concept that refers to decision-making processes and the way in which actors participate in the chain (the division of functions, the allocation of responsibilities and the distribution of risks and rewards). 2. Chain-wide collaboration: in the allocation
and use of resources and the resolution of problems.
3. Inclusive innovation: giving smallholders a voice in the adoption of new ideas and new technology.
4. Equitable access to inputs: enabling smallholders in developing countries to access new markets and distribution channels from which they are often excluded due to poor availability of, or access to, key inputs (e.g. credit, seed, fertilizer) and services (e.g. agronomy advice). 5. Chain-wide measurement of outcomes:
extending the line of sight from individual businesses or links in the chain to the chain as a whole, for the purpose of continuous improvement. This is part of the monitoring and evaluation process, of which the assessment of the relationship strength is a part, providing feedback for the review of the strategy, objectives and design of the supply chain.
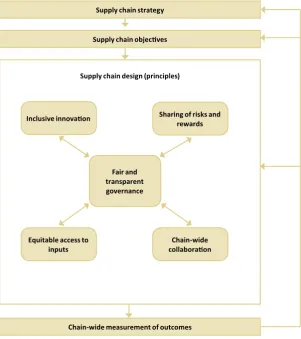
These principles influence the supply chain at various levels and in different ways (Figure 1). The starting point is the establishment of a supply chain strategy by the food retailer or manufacturer, referred to in this guide as the ‘chain captain’. The specific supply chain objectives are derived from the market and product characteristics and inform the design of the supply chain, which constitutes the unit of analysis. It is at this stage that key decisions are taken that affect the inclusivity of the chain. The approach taken here to measuring sustainable supply chain relationships focuses primarily on the over-arching principle of fair and transparent governance (principle 1), which lies at the heart of the conceptual framework. This is fundamental to the overall process – without it, none of the other principles is achievable. The approach taken to measure fair and transparent governance is based on the theory of organizational justice (Hornibrook et al., 2009). This theory has its origins in the assessment (and improvement) of employer– employee relationships and has five
components:
1. Distributive justice (the perceived fairness of the distribution of benefits).
2. Procedural justice (the perceived fairness of decision-making processes).
3. Informational justice (the perceived fairness of the exchange and use of information). 4. Inter-personal justice (the perceived fairness
of communication between individuals). 5. Commitment (the allocation of
resources – time, effort, money – to
strengthen relationships and improve supply chain performance).
Part 1
Conceptual framework 7
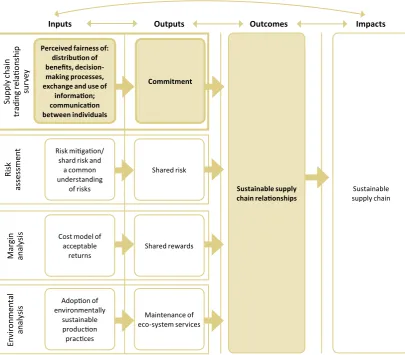
If the first four components are perceived to be in place by all members of a supply chain, the outcome will be commitment. Without commitment, there cannot be a sustainable supply chain. This is illustrated in Figure 2, which also highlights how a survey measuring fairness fits into the overall process of developing sustainable supply chains.
The diagram also shows that it is important to recognize that there are additional
measurements that are necessary in order for the diagnosis of supply chain sustainability to be complete (e.g. risk assessment, margin analysis and environmental analysis). These will take place at different points in the chain with different data and with different methods of analysis. This wider context is discussed further in Section 5.1.
Figure 1: A conceptual framework for the development of sustainable supply chains involving smallholders in developing countries
Supply chain strategy
Supply chain objecives
Supply chain design (principles)
Inclusive innovaion Sharing of risks and rewards
Equitable access to inputs
Chain-wide collaboraion Fair and
transparent governance
8Measuring Fairnes in Supply Chain Trading Relationships: methodology guide
Figure 2: The importance of understanding fairness in sustainable supply chains
Sustainable supply
Perceived fairness of: distribuion of beneits, decision-making processes, exchange and use of
This section explains the survey design, choice of survey method, key components of the sampling strategy and the practical steps required for the collection, analysis and interpretation of the survey data.
2.1 Survey design
The survey is designed to measure the strength of buyer–supplier relationships along the supply chain, through an analysis of the perceptions of fairness, with a particular emphasis on the strength of relationships with the most vulnerable stakeholders – primary producers. Thus,
measurements are taken at each of the
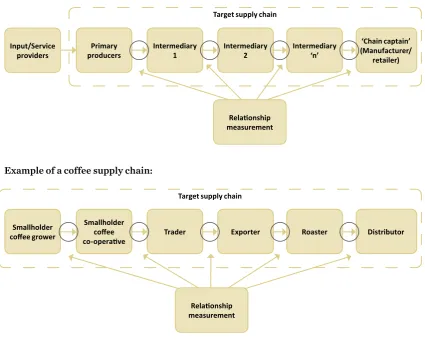
interfaces between the different links in the chain and, where appropriate, between links that are not directly connected (e.g. Intermediary 1 and the chain captain). Figure 3 illustrates this using the example of the links in a coffee supply chain, from smallholder coffee grower to distributor. Because we are focusing particularly on the sustainability of relationships with the primary producer/smallholders in the chain, the survey is split into two parts:
1. A survey specifically for primary producers, to measure their perceptions of fairness as a means of understanding relationship strength, their satisfaction with outcomes and
processes and access to inputs (see Survey Instrument Tool).
2. A survey designed for all the other stakeholders beyond the farm gate (see Survey Instrument Tool).
The common element in both survey types is the measurement of perceived fairness in the outcomes and processes in the buyer–supplier relationship, from the perspective of both parties. In the case of the primary producers, the
measure is of their perceptions of relationship strength with the person or organization to whom they sell directly – Intermediary 1. In all the other links ‘downstream’ (i.e. beyond the farm gate), we explore relationships both up and down the supply chain. So for people involved in
purchasing, we want to know how fair they perceive their treatment of the suppliers is, as well as their treatment of those who they sell to. Taking the coffee supply chain illustrated in Figure 3 as an example, we can measure the smallholder coffee co-operative’s views of their buying relationships with smallholder coffee growers and of their selling relationship with the trader, and so on.
Part 2
Measuring fairness
10Measuring Fairnes in Supply Chain Trading Relationships: methodology guide
2.2 Choice of survey method
The choice of survey method is governed by three factors: the type of information required, the nature and location of the recipients, and the budget available.
The perceived fairness of buyer–supplier relationships cannot be measured directly, but it will be reflected in the way people behave and how people perceive the behavior of others, and the outcomes of that behavior. The information required to measure the strength of buyer– supplier relationships is essentially attitudinal –
measuring the perceptions of buyers and suppliers regarding the behavior of the people with whom they engage in the process of buying and supplying goods and/or services.
This information can be captured using any of the survey methods available: in-person, mail, telephone or internet. Nevertheless, the specific context of smallholders in developing countries generally precludes the use of mail, telephone or internet surveys upstream, whilst the internet survey is the most efficient way of collecting information downstream.
Example of a coffee supply chain:
Smallholder cofee co-operaive
Trader Smallholder
cofee grower Exporter Roaster Distributor
Figure 3: Application of the survey instrument along the supply chain
Primary producers
Intermediary 1 Input/Service
providers
Target supply chain
Target supply chain
Intermediary ‘n’
‘Chain captain’ (Manufacturer/
retailer) Intermediary
2
Relaionship measurement
Measuring fairness 11
The proposed survey method comprises face-to-face interviews with primary producers and an online questionnaire for the remaining stakeholders (post farm gate). The assumption is that engagement of the relevant primary
producers in the measurement process can only be guaranteed through face-to-face delivery of the questionnaire. It is also assumed that all other stakeholders will be comfortable with and have access to a reasonable internet connection. Where this is not the case then face-to-face or telephone interviews may be more appropriate.
2.3 Questionnaire design
We have designed the questionnaires with three key considerations in mind: robustness of measurement (Box 1), ease of implementation, and generic application.
Box 1 What do we mean by ‘robust measurement’?
There are two key characteristics of robust measurement – validity and reliability: • Valid measures are accurate (they measure
precisely what we want to measure) and result from asking people lots of questions in as much detail as possible.
• Reliable measures are consistent (they always measure what we want to measure, regardless of the context). They require robust sampling of as large and
representative sample as possible. Questions need to be limited – to avoid respondent fatigue – and as easy as possible to answer (to prevent respondents from guessing).
Thus, there is a trade-off between the need for a lot of detail for validity and the need for simplicity for reliability. All researchers acknowledge this challenge. The secret is to combine a questionnaire that accurately captures the most important elements of the conceptual framework with a sampling strategy that generates a dataset that is as representative as possible of the target population.
In each of the questionnaires, respondents are required to indicate their level of agreement/ disagreement with a series of statements. These statements are then scored as follows:
2=strongly disagree, 1=disagree, 0=neither agree nor disagree, -1= agree, -2=strongly agree (see Case Study 1 in Part 3). This permits the estimation and comparison of perceived fairness in the buyer–supplier relationship (and its distinct components) at different stages in the chain and for the chain as a whole. It also highlights any misalignments between a buyer’s and a supplier’s perception of the fairness of the buyer’s behavior. All respondents are given an opportunity to identify key areas for improvement in an open question at the end of the
questionnaire; and if there is any disagreement about what is regarded as ‘fair’ in the various responses.
The producer questionnaire also contains questions on equitable access to inputs and services – this is specific to production.
Respondents are asked to comment explicitly on their satisfaction with the level of access they have to inputs using a four-point rating scale: 1=not at all satisfied, 2=quite satisfied, 3= very satisfied, 4= extremely satisfied. In addition, the producer questionnaire contains a number of profiling questions about the personal characteristics (age, gender) and business characteristics (size of farm, enterprise mix, quantity and quality of output, distribution channels served) which are used to determine the degree of inclusivity within the target supply chain and so the extent to which the target chain includes/excludes certain categories of
producer or enterprise.
2.4 Sampling strategy
12Measuring Fairnes in Supply Chain Trading Relationships: methodology guide
Who to sample?
This depends on the structure of the supply chain being considered, as the number of stakeholders will vary from product to product. But the starting point in the chain is the primary producer. In most developing countries there will be at least two intermediaries between the primary producer and the retailer – one responsible for procurement, grading,
classification and export, and one for importation and forward distribution to either a manufacturer or retailer (Figure 3). There could be more intermediaries, but the important point is that the survey should be administered to all types of stakeholders, from primary producers through to the retailer or ‘chain captain’. The identification of key individuals within each organization and their engagement in the measurement process should be the responsibility of the person instigating the survey. If it is not the chain captain instigating the survey then they should be brought on board as they will be the stakeholder with the greatest influence in the chain and thus the one most likely to generate support for carrying out the survey amongst other stakeholders.
How many to sample?
To answer this question you need to identify who is involved in each buyer–supplier relationship along the chain. In most cases this will be one person, but in some instances there will be two or more people with different roles or
responsibilities, for example, the procurement and sales managers. The one exception to this is at the primary production stage, where there can be hundreds if not thousands of producers involved.
In practice, the sample size will be determined by the available budget. Given the need to
administer the producer questionnaire in person, it is likely that it will have to be administered to a sample of primary producers. For example, if the budget for data collection is $1,000 and the cost of hiring a fieldworker is $30/day plus travelling expenses, then depending on how far they have
to travel, the target sample size would be around 30. This is the minimum number necessary to carry out the valid statistical analysis. The larger the sample size, the more reliable the survey data from producers. The fact that non-producer stakeholders are few in number means it is not possible to conduct statistical tests to determine the significance of any implied differences in the perceived fairness and/or transparency further along the chain. This assessment will have to be subjective.
How to sample?
The answer to this question depends entirely on how you plan to analyse the data. If the budget is tight then the most reliable analysis would use the entire sample without exploring any differences between categories of producer. However, an analysis of inclusivity would require you to differentiate between responses from different types of producer, for example according to age, gender etc. Under tight budget constraints the most appropriate sampling method would be a random selection of producers, where the number selected (‘n’) is determined by dividing the available budget by the cost per interview (see Section 3.4 for tips on maximising the efficiency of data collection). Ideally the survey results should be analysed for different categories of respondent (women
versus men, for example) and, where relevant, for different growing regions. In this case, the most appropriate sampling method would be a ‘stratified sample’. This is achieved by allocating quotas for different categories of producer, which the interviewers would then apply when selecting respondents in the field. If the relevant details of producers are available on file then the selection process can be randomized in advance of the fieldwork, which avoids any selection bias resulting from the interviewers’ personal preferences or third party interference. Where sampling units vary in size, the
Measuring fairness 13
proportional to the size of its population. This is particularly relevant for field work involving agricultural production as agricultural holdings vary in size both within and between distinct geographical areas. PPS assures that those farms in larger communities have the same probability of getting into the sample as those in smaller communities, and vice versa, resulting in a representative random sample.
2.5 Conducting the survey
Having identified the target respondents for the survey, the next question is how to administer the survey along the chain. The choice of survey method has already been discussed (see Section 2.1), so this section deals with the practical issues associated with the physical collection of data.
For all stakeholders other than the primary producers, the data can be collected
automatically through the administration of an online survey (described below). Collecting data from primary producers is more involved, more costly and more time-consuming, as it requires conducting the questionnaire in person.
Surveying intermediaries and retailers
Questionnaire templates for surveying
intermediaries and retailers can be found in the Survey Instrument Tool.
You can create online versions of these templates based tools such as Surveymonkey (www.surveymonkey.com – an online scripting tool). You can adminster these surveys online. Using an online version of the questionnaire takes between 10 and 15 minutes to complete and the responses are downloadable in the form of a Comma Separated Value (CSV) Excel (spreadsheet) file that in turn can be uploaded directly into the Excel (spreadsheet) analytical toolkit (see Part 3) for analysis.
Respondents should be invited to complete the online questionnaire by email, including a
web-link to the questionnaire, along with a deadline for completion.
Surveying farmers
There are many more issues to consider when collecting data from primary producers, including the appointment of field agents to administer the survey, organizing translation and data capture.
The producer survey may best be undertaken by an established (local) service provider, such as a local market research agency or an NGO that understands supply chains involving
smallholders from developing countries. Where possible the survey should be undertaken by an independent service provider to try to avoid any conflict of interest.
Field agents
Field agents should be engaged as early as possible in the measurement process, as their experience – with primary producers and/or the target region(s) – can provide valuable input to any adaptations to the questionnaire and the proposed sampling strategy. Local field agents are also the logical first port of call for translating the producer questionnaire, which may need to be administered in more than one language or dialect (see below). Field agents can be appointed by the chosen local service provider. Experience of primary production and
knowledge of the regions to be covered in the sampling strategy will be critical for ensuring that the data collected are as valid and reliable as possible. As interviews are completed and returned there needs to be regular data checking, cleaning, and immediate feedback to field agents to improve how the survey is administered.
Translation
14Measuring Fairnes in Supply Chain Trading Relationships: methodology guide
back-translated by an independent third party from the local language/dialect into English, to ensure that none of the meaning is lost in the translation process. Where discrepancies arise they should be the subject of discussion and clarification, as translation is a potential threat to the validity and reliability of survey data.
Piloting and implementing the questionnaire
The final version of the questionnaire should be subjected to a pilot, however small, to ensure that producers understand the questions (no matter how perfectly they may be translated) and are willing and able to answer them honestly and completely without confusion or fatigue.
The questionnaire has been designed to make it as easy and quick to administer as possible. Thus, most of the questions are closed (multiple choice) in format. For these questions, the interviewer asks the questions and fills in the form. However, a small number of open questions have been included to allow
respondents to use their own words to describe their relationship with the first stage buyer and potential areas for improvement. Detailed guidance notes, question by question, are provided for the administration of the producer questionnaire (see the Survey Instruments Tool), which deal with FAQs and prompts for the generation of additional (qualitative) insights.
The easiest way to capture the answers to these few open questions is to use a Dictaphone. This helps to: 1) clarify issues prompted by any ‘negative’ responses; and 2) record what was said if there are any data queries during analysis. In some circumstances it may be possible to administer the questionnaire using a laptop computer or i-Pad. This avoids an extra step of data entry – saving time and money. On the other hand, if primary producers are unfamiliar with or suspicious of the use of IT equipment there may be some resistance to this approach. Local field agents should be able to offer advice; any potential negative reaction from respondents should be revealed during the pilot process (Box 2).
If the producer survey is administered in person and by hand then the field agents will need to make the data available for analysis in one of two ways. They can either enter the data manually into an Excel spreadsheet using the coding scheme and spreadsheet template provided, or they can use the online version of the
questionnaire. The results can then be
downloaded as a CSV file in the same way as for the other respondents in the chain. Either way, the data will then be in a format that can be uploaded into the Excel (spreadsheet) Survey Analysis Tool, which has validity checks to capture any inconsistencies in the data collected.
Box 2: Anonymity and sensitivity: being aware
This section describes how the tool analyzes the data collected, explains how the results should be interpreted and gives some examples of how they might be usefully reported. This part of the Methodology Guide should be used in
conjunction with the Survey Analysis Tool, which is available through either Justin or Abbi. The person or organization responsible for the survey will need a basic understanding of statistics and how to use Microsoft Excel (spreadsheets).
3.1 Analysing buyer–supplier
relationships
The data generated by the Survey Analysis Tool should enable you to answer the following questions:
• Are buyer–supplier relationships perceived to be fair at different points in the chain and for the chain as a whole? In particular, is the supply chain inclusive and equitable for all types of smallholder producer?
• Are perceptions consistent across all of the dimensions of fairness (distribution of benefits, decision-making processes, exchange and use of information, communication between individuals, commitment)?
• Are perceptions consistent between different types of primary producer?
• Is there evidence of commitment from buyers and suppliers to the development of
relationships in this chain?
The Survey Analysis Tool produces a series of summary tables and graphs for each of these key topics: the perceived fairness of the distribution of benefits, the perceived fairness of decision-making processes, the perceived fairness of the
exchange and use of information, the perceived fairness of communication between individuals, and commitment to the buyer–supplier
relationship. It generates reports for the
individual links in the chain and the chain overall. For each topic the frequency of responses (levels of agreement with the different statements) are reported graphically and summarized by presenting average scores for each link in the chain, as well as for the chain as a whole. Agreement with behavior that is deemed to be fair is scored positively (strongly agree = +2, agree = +1) and color coded in shades of green, whilst disagreement with such behavior is scored negatively (strongly disagree = –2, disagree = –1) and color coded in shades of red (see Case Study 1). Ambivalence (neither agree nor disagree) is scored as neutral (zero) and colored amber (this is a legitimate response for a survey designed to measure perceptions). What emerges is a set of graphs and summary tables that enable the surveyor to instantly identify problems or areas of weakness (see Case Study 2).
If primary producers have identified a particular problem, the questionnaire allows the interviewer to probe more deeply (see the interview guide – part of the Survey Instruments Tool). These comments are also stored within the analysis tool. This allows the user to click on specific questions that scored low (colored red and with a negative mean score) and download all the comments made by primary producers to justify their disagreement and/or dissatisfaction. Small sample sizes amongst the intermediary respondents mean that statistical analysis is not possible. But, the existence of negative scores, regardless of the number of respondents or sample size, should prompt the survey instigator to explore the situation further and identify
Part 3
16Measuring Fairnes in Supply Chain Trading Relationships: methodology guide
Case Study 1: Smallholder flower producers in Kenya: analysis of commitment to the trading relationship
Wilmar Agro Limited, a Kenyan-based and run export firm, contracts 2,500 small-scale flower growers to supply the Dutch cut flower auction markets. A trading relationship survey was undertaken in January 2012 on the relationship between growers and Wilmar supplying the Dutch auction markets. The table below shows an excerpt from the survey analysis tool for the topic of commitment as perceived by flower growers. These statements assess the perception of loyalty and obligation to the trading
relationships with Wilmar.
The negative scores on commitment to the trading relationship are a result of statements (questions?) asking growers if they would be willing to invest – financially or otherwise – in developing the relationship. Although growers strongly agree that they expect their relationship with Wilmar to continue for a long time and would like to strengthen their relationship, the analysis shows that the growers would have to make more profit on their flowers to be able to reinvest in production:
‘If they change prices I am more than willing to invest even more so as to make good profit.’ ‘If the grading is fair and the prices are good, I would be willing to invest more in my flower farming business.’
Positive responses on commitment are based largely on the consistency of purchase:
‘Wilmer is reliable customer, and they pay us not like those brothers who denied us our money so I would not neglect Wilmar that easily.’
‘Wilmar is reliable than brokers since they always stick to agreements we make like collecting and paying. Apprreciate these are colloquial but ‘more’, presumably, is missing before ‘reliable’
Data analysis and interpretation 17
Classification
Strongly disagree (–1 to –2) Disagree (0 to –1)
Neither agree nor disagree (0.0) Agree (0 to 1 )
Strongly agree (1 to 2 )
*Statements that have been reversed from a negative to a positive statement to allow for color-coded analysis.
Statement Mean Score
(Item)
Co
mm
it
men
t t
o
th
e
tr
ad
in
g
rel
ai
on
sh
ip
1. I expect my relaionship with Wilmar will coninue for a long ime 1.21 2. I would like to strengthen my relaionship with Wilmar in the future 1.30 3.* I am willing to invest inancially to develop my business with Wilmar –0.78 4.* I am willing to devote ime and efort to develop my business with
Wilmar –0.80
5. I share the same ethical values as Wilmar 0.57 6. The commercial goals of Wilmar are compaible with mine 0.38 7. I would have no diiculty replacing my business with Wilmar
because there are a plenty of alternaives –0.25 8. I would not want to lose my business with Wilmar because I have
made a signiicant inancial investment in order to supply them –0.05 9. I would not want to lose my business with Wilmar because I have
invested a signiicant amount of ime and efort in developing a
relaionship with them –0.06
10. I would not want to lose my business with Wilmar because of the
inancial investment I would have to make in order to replace them 0.14 11. I willingly do “whatever it takes” to saisfy the demands of Wilmar –1.35 12.* Wilmar occasionally makes excepional demands of me with which I
18Measuring Fairnes in Supply Chain Trading Relationships: methodology guide
changes that in the future could increase the perceived fairness and/or transparency along the chain.
For the primary producer data, the analysis tool can test the hypotheses that the perceptions of fairness are independent of the gender, age, and experience of the producer and the location and size of the enterprise. An appropriate statistical test (Chi-Square) is built into the Survey Analysis Tool to determine whether any differences
reported by different categories of respondent are statistically significant. If there are significant differences, action can be taken to 1) explore the reasons for the perceived lack of fairness and/or transparency amongst certain categories of producer; and 2) identify changes in buyer behavior (procedures or outcomes) that in the future might induce a greater sense of justice amongst disaffected producers.
Case Study 2: Smallholder flower producers in Kenya: Access to inputs and services Poor and small-scale producers often need
support in accessing key services and inputs in order to participate fully in inclusive and beneficial trading relationships. The chart below is an output from the survey of flower producers in Kenya.
The results show that growers are least satisfied in access to market information. A large number of growers are also unsatisfied with their access to credit. Many growers
commented that they received no market information, in particular on price.
Respondents requested that Wilmar provide loans to growers to support investment in production. Access to extension services and production inputs were broadly considered satisfactory. Negative comments on
production inputs were related to the costs of fertilizers being too high.
Access to producion Access to extension Access to credit Access to market
inputs services informaion
Extremely saisied Quite saisied Not very saisied Not at all saisied
50
45
40
35
30
25
20
15
10
5
0
N
um
be
r o
f gr
ow
er
Data analysis and interpretation 19
3.2 Commitment
Commitment is assessed in the buyer–supplier survey through 12 statements to which
respondents are asked to indicate their level of agreement. Analyzing this data involves calculating the average score for all 12
statements. A positive average score indicates a good level of commitment, conducive to the development of long-term relationships. On the other hand, a negative score indicates a lack of commitment to relationship development and should prompt action by those involved in the chain. Case study 1 above illustrates how this works in practice.
3.3 Inclusivity
Inclusivity is one of the principles of sustainable supply chains. Only the questionnaire for primary producers includes questions on inclusivity (e.g.
demographic information). This is because it is mainly at the level of primary production where we are particularly concerned about the inclusion of marginal groups – such as women, young people, geographically marginalized producers and those with less secure land tenure.
The survey of primary producers analyses how key groups differ in their perceptions of the fairness of the trading relationship. The Survey Analysis Tool allows the user to analyze the perceptions of fairness in the distribution of benefits, decision making, communication between individuals, exchange and use of information and commitment, for specific sample characteristics, for example female producers, or producers with less than 1 hectare of land. It will be important for analytical integrity that this relates back to the sampling strategy (see Section 2.4) which requires that the sample characteristics proportionately reflect the demographics and key characteristics of the population of primary producers.
3.4 Equitable access to inputs
Equitable access to inputs is another principle of sustainable trading relationships that is of particular relevance to primary producers in developing countries. Thus the questionnaire for primary producers asks respondents to indicate their satisfaction with their access to key production inputs (seed, fertilizer and agro-chemicals) and services (credit, market information, extension).
Satisfaction is measured using a simple four-point scale – extremely satisfied, quite satisfied, not very satisfied, not at all satisfied. The analysis involves generating a frequency table (Case study 2), and can also test whether the level of satisfaction varies by gender, age, experience of the producer, location and farm size. When a respondent expresses
dissatisfaction the interviewer is prompted to seek further information to illustrate or
substantiate the reasons for their dissatisfaction. This information is captured within the Survey Analysis Tool and downloadable for further analysis, by clicking on the specific question for which a low mean score and/or high frequency of dissatisfaction is reported.
Measuring perceptions is a critical part of the continuous improvement cycle of the supply chain, but how can users make the most of the information generated by the survey? The focus here is on four key steps:
1. Verifying results: If the measurements are not accurate and do not reflect reality, the results will be ignored.
2. Communicating results: If the findings are not effectively communicated then individuals will remain blind to the need for change.
3. Action planning: Who should you expect to do what?
4. Embedding the process: How can you integrate the measurement process within existing supply chain functions, when and how should the measurement process be repeated, and how often?
4.1 Verification
Verifying and effectively communicating the survey results are critical for the process of continuous improvement.
The verification process can be described as ‘groundtruthing’. This involves sharing the findings for the individual links (buyer–supplier relationships) in the chain with the stakeholders concerned. This gives them an opportunity to provide further information and/or clarification in light of the insights gained from the survey results.
Groundtruthing involves feeding back the results of the survey to respondents (or a small sample if there are too many), ideally face to face. This will either confirm that the findings are an accurate reflection of the situation, or else reveal the need
for further investigation to verify the findings prior to their wider dissemination. This is an important part of the communication process, because respondents may be unaware of an issue or in denial of its existence, or may have been reluctant to be honest about their views for fear of reprisals (see Box 3) and having a negative impact on the trading relationship. Therefore, groundtruthing must be done with humility and sensitivity. The process may lead to modification of how the results are interpreted, presented and/or communicated. The primary goal is to ensure that all stakeholders agree that the results of the survey can be shared with others, internally or externally. Without this agreement, the whole process can unravel as buyers lose faith and suppliers disengage from a process in which they have no confidence.
4.2 Communicating results
Once findings are confirmed as an accurate reflection of reality, and key stakeholders have agreed that the findings can be shared, the process of dissemination can begin. This can involve different activities according to the stakeholders and target audiences:
• Face-to-face briefings work well with primary producers, providing them with an
opportunity to comment on the findings and reach consensual views regarding solutions to (common) problems. These can be carried out by the local partner who implemented the survey.
• Internal or external presentations where the interests of downstream stakeholders might be best served. These can be an effective way to explore sectoral issues as well as to present and invite examples of good practice.
Part 4
Using the findings 21
4.3 Acting on the findings
It is important that action to strengthen buyer– supplier relationships is multi-stakeholder. Improvements designed and implemented in isolation will rarely deliver optimal solutions for the chain as a whole. Thus, the design and implementation of improvement projects should be a shared responsibility. This may require establishing new governance processes or, at the very least, a supply chain project team or a continuous improvement group. Whatever the forum, the guiding principle is that multiple stakeholders should be engaged in the process from the outset.
The single most important – but difficult – task is to gather all the stakeholders in the chain together to discuss the results and what they mean for the day-to-day management of their businesses and the relationships between them. This is especially challenging in supply chains that are in difficulty – if the diagnosis is one of adversarial, opportunistic arm’s length trading then the stakeholders are unlikely to respond favorably to an invitation to come together and discuss the next steps. However, the survey sponsor must try to engage as widely as possible. A good technique is to use video or telephone conferencing. For example, this could bring together the retailer at their head office in California, the importer based in Chicago, the exporter based in Accra and the growers (or a grower representative) dispersed all over Ghana. The foundations of the assessment of
relationship strength are the principles of organizational justice – distributive, procedural, informational and inter-personal (see Section 1.1). Improvement actions are therefore likely to be related to these. Actions will of course depend on the issues that emerge from the
survey but will invariably include reviews of contractual terms and conditions (distributive justice), decision-making processes (procedural justice), the availability and use of information (informational justice) and the way in which individuals communicate (inter-personal justice; Box 4).
Box 4: Examples of the types of actions stimulated by the survey
Some of the issues arising from the survey will require relatively simple or straightforward action, such as:
• Improving communication of the way in which price is determined (see Case Study 3) including discussing in detail the way prices are set at monthly producer meetings. Other actions will require greater investment, for example:
• Enabling access to regular market information.
• Offering training on understanding and interpreting market information.
• Monitoring grower profits and investments to ensure a positive contribution to household income.
22Measuring Fairnes in Supply Chain Trading Relationships: methodology guide
Case study 3: smallholder flower producers in Kenya: opportunities for action The survey considers perceptions of trading
relationships in terms of profit sharing and the division of reward between the flower producer and Wilmar, and vice versa. These questions reveal some areas where action could be taken to improve perceptions about the price levels growers receive.
The data show that in general the trading relationship between flower growers in Kenya and Wilmar is broadly felt to be fair. The biggest issue is around price – both in the way it is determined and the amount. Negative responses to these questions were backed up by comments like:
‘I have never been rewarded at any time whether I produce good quality or not, it’s all the same.’
‘Sometimes Wilmar rejects some of my best flowers even when I have done my best, only
because of the height being unsatisfactory by a few centimeters.’
‘So far I have not seen anyone being
rewarded. All times are the same whether you meet the requirements or not.’
The data show that growers would like to see more profit from their flowers given the time and resources invested, which sometimes results in a loss (particularly in the low season). The New Business Models project aimed to address issues of price inconsistency by giving farmers a stable retail price and price levels by increasing, on average, the amount received from retail markets as compared to auction markets (see further Buxton and Vorley 2012). Wilmar also needs to consider the way in which it communicates price and pricing decisions to growers as this may help address more negative perceptions.
Statement Mean Score
(Item)
1. Wilmar does not take advantage of their bargaining posiion to
secure a beter deal from me 0.48
2. Wilmar recognises that we both need to beneit from doing business
with each other 0.65
3. I am saisied with the iming of payment ofered by Wilmar 1.50 4. I am saisied with the method of payment ofered by Wilmar 1.53 5. I am fairly rewarded for meeing the requirements of Wilmar –0.04 6. I am saisied with the proit I make from my business with Wilmar –0.16 7. The proit I make from my business with Wilmar is fair given the ime
and efort I spend meeing their requirements –0.38 8. The proit I make from my business with Wilmar is fair given the
inancial costs I incur in meeing their requirements –0.39 9.* The price premium I receive from Wilmar for exceeding the minimum
quality standards relects the ime and efort it takes to improve the
quality of Flowers 0.99
10.* The price premium I receive from Wilmar for exceeding the minimum quality standards adequately compensate for the addiional inancial
Using the findings 23
4.4 Embedding the process
Embedding the process in normal operations ensures that it is not a one-off event. It means routinely monitoring relationship strength – ideally annually – as part of the retailer’s supplier relationship management (SRM) process. An important part of embedding the process is deciding who should conduct the regular follow-up surveys. Outsourcing survey implementation improves the likelihood of effective supplier engagement. This is because suppliers are more likely to participate and provide ‘honest’ answers to the questions. Outsourcing also gives the process integrity and exposes the stakeholders to objective
This approach to the measurement of buyer– supplier relationships is built on solid theoretical, conceptual and methodological foundations; the practical guidelines for implementing the survey are based on real experience in the field, but it is recognized that the measurement of buyer– supplier relationships and the assessment of their sustainability is still very much a ‘work in progress’. This final section reflects on the limitations in this approach and the lessons learnt. There are two key issues to focus on:
• Data analysis – how the information has been analyzed to determine the fairness of buyer– supplier relationships.
• Further research – what further information is necessary to look at, beyond the assessment of buyer–supplier relationships, to ensure that the supply chain as a whole becomes more sustainable?
5.1 Data analysis
The survey tool explores perceptions of fairness, because fairness is perceived as an important enabler for collaboration and an essential building block for fair and inclusive governance in supply chains involving smallholders from developing countries. Yet there are clearly other factors that affect the sustainability of trading relationships and supply chain operations (see Figure 2).
The tool presented in this guide does not assess the actual allocation of risks and rewards, or the financial flows (costs of production, margins and profitability) along the chain. Although those assessments are similarly fraught with problems of data access and reliability, the exclusive reliance on perceptions raises the problem of a mismatch between individual perceptions and commercial reality.
Perceptions of fairness in the buyer–supplier relationship may well be influenced by broader economic and socio-political factors outside the control of the supply chain stakeholders. By looking at only one supply chain we are blind to what is happening elsewhere – in other regions, with people growing the same crop but for different markets, and with people in the same region growing other crops (who may compete with the target producers for scarce resources). The measurement process would therefore be strengthened by adding:
• some environmental analysis that takes account of market dynamics for competing and complementary products; and
• some analysis of parallel supply chains – serving different customers or different distribution channels – for the target product. This will add both complexity and cost to the process of measurement and analysis but would undoubtedly result in a richer picture, reduce the probability of spurious inferences being drawn from a single supply chain analysis and facilitate the identification of broader (sector-wide, industry-wide, country-wide) issues and barriers to change.
Part 5
Limitations 25
5.2 A call for feedback
As stated at the beginning of this guide, the methodology is still being fine-tuned and will benefit from being used and from users’ feedback on what can be improved. The measurement process can never be perfect – there are always constructs, variables and relationships that can be more completely defined, scales that can be adapted to ensure more consistent measurement and sampling strategies that can be modified to ensure greater representation of the target population. This invariably results in changes to both the questions asked and the people talked to. However, whilst we feel comfortable with our understanding and measurement of the core constructs of organizational justice (distributive, procedural, informational, inter-personal), significant gaps remain in our understanding of relationship dynamics and how perceptions of fairness affect and are affected by trust, commitment and inter-dependence. Currently, these relationships are assumed, but we have not formally tested the hypotheses that these constructs are related; nor have we established the direction of causality.
We also have little empirical evidence that improving perceptions of fairness in buyer– supplier relationships significantly improves commercial outcomes – fairer supply chains may be more socially sustainable but are they more profitable? It may be that a more equitable distribution of benefits results in competitive disadvantage – the size of the profit pie shrinks so there is less cash to be shared, no matter how fairly it is distributed.
Finally, we have little empirical evidence of the impact of intermediaries (government agencies, private consultants and NGOs) on the
development and regeneration of individual (commercially focused) supply chains. Historically, these stakeholders have operated primarily at the macro (industry/country/region) or meso (sector) level or exclusively upstream at the micro level, with limited involvement in the ‘cut and thrust’ of shaping businesses, building supply chains and brokering deals. This appears to be changing; new business models for agrarian development are emerging based on market pull and ‘self-help’ rather than large-scale institutional investment, infrastructural
transformation and a donor culture that does little (or not enough) to empower individuals and collaborative groups to have a greater ‘say’ in what they want and greater control in achieving it.
This project – the development of a trading relationship survey tool – is an example of the different kind of relationships that are emerging between academic researchers, NGOs and commercial businesses for mutual benefit and, hopefully, the wider benefit of the most
Buxton, A. and Vorley, W. 2012. Smallholder Flowers from Kenya: the role of ethical agents. New Business Models for Sustainable Trading Relationships Case Study Series, IIED, London. Available at http://pubs.iied.org/16037IIED.html
Cadilhon J., Moustier P., Poole N., Giac Tam P. and Fearne A. 2006. Traditional vs. Modern Food Systems? Insights from vegetable supply chains to Ho Chi Minh City (Vietnam).
Development Policy Review, 24(1): 31–49.
Cadilhon, J.-J., Fearne, A.P., Giac Tam, P.T., Moustier, P. and Poole, N.D. 2009. Market Linkages: characterizing business-to-business relationships in Vietnamese vegetable supply chains.
Acta Horticulturae 809: 135–46.
Duffty, R., Fearne, A. and Hornibrook, S. 2003. Measuring Distributive and Procedural Justice: an exploratory investigation of the fairness of retailer-supplier relationships in the UK food industry. British Food Journal, 105(11).
Duffy, R. and Fearne, A. 2004. Buyer–Supplier Relationships: an investigation of moderating factors on the development of partnership characteristics and performance. International Food and Agribusiness Management Review, 27(6): 456–72.
Fearne, A. 2009. Sustainable food and wine value chains. Final Report – Adelaide Thinkers in Residence, Department of Premier and Cabinet, Government of South Australia, Adelaide. Fearne, A., Duffy, R. and Hornibrook, S. 2005. Justice in UK Supermarket Buyer–Supplier Relationships. International Journal of Retail and Distribution Management, 33(8): 570–82.
Gedeon, I., Fearne, A. and Poole, N. 2009. The Role of Inter-personal Relationships in the Dissolution of Business Relationships. Journal of Business and Industrial Marketing, 24(3/4): 218–26.
Hornibrook, S., Fearne, A. and Lazzarin, M. 2009. Exploring the Association between Fairness and Organisational Outcomes in Supply Chain Relationships. International Journal of Retail and Distribution Management, 37(6): 790–803.
Oxfam. 2010. Think Big, Go Small: Adapting business models to incorporate smallholders into supply chains. Briefings for Business (International Edition), No.6, Oxfam International, Oxford.
Soosay, C. and Fearne, A. 2010. Using Sustainable Value Chain Analysis as a Catalyst for Co-Innovation in Regional
Development: A case study of South Australian wine from the Riverland. International Journal of Innovation and Regional Development, 3(2).
Vorley, W., Ferris, S., Seville, D. and Lundy, M. 2010. Linking worlds: new business models for sustainable trading relations between smallholders and formalized markets, Working Paper, International Institute for Environment and Development (IIED), London.