www.elsevier.comrlocateratmos
Parameterisation of surface radiation flux at an
Antarctic site
A. Orsini
a, F. Calzolari
a, T. Georgiadis
a,), V. Levizzani
a,
M. Nardino
a, R. Pirazzini
a, R. Rizzi
b, R. Sozzi
c, C. Tomasi
aa
ISAO-CNR, Institute of Atmospheric and Oceanic Sciences,Õia Gobetti 101, I-40129, Bologna, Italy
b
Physics Department, UniÕersity of Bologna,Õiale Berti Pichat 6r2, I-40127 Bologna, Italy
c
SerÕizi Territorio Via Garibaldi 21, I-20096 Cinisello Balsamo, Italy
Received 24 May 1999; accepted 17 March 2000
Abstract
During the Antarctic summer 1994r95 the values of downward and upward flux densities of both solar and terrestrial radiation were recorded at 1200 m for a period of 1 month on the Reeves
Ž X X
.
Neve Glacier lat 74` 839 S, long 161835 E , near the Italian base of Terra Nova Bay. The relations w
proposed by Swinbank Swinbank, W.C., 1963. Long-wave radiation from clear skies. Q. J. R.
x w
Meteorol. Soc. 89, 339–348 , Idso and Jackson Idso, S.B., Jackson, R.D., 1969. Thermal
x w
radiation from the atmosphere. J. Geophys. Res. 74, 5397–5403 and Deacon Deacon, E.L., 1970. x The derivation of Swinbank’s long-wave radiation formula. Q. J. R. Meteorol. Soc. 96, 313–319 associating the long-wave atmospheric radiation flux only to the air temperature at screen level were tested in extreme Antarctic climatological condition. A relation between the long-wave radiation flux and both screen air temperature and cloud cover fraction in accordance to the height of the cloud base was defined using the Kasten and Czeplak relationship that relates the solar radiation flux and the cloud cover index. The study of the incoming short-wave radiation flux from the clear sky and that reflected by the surrounding snow cover allowed for highlighting the role of surface geometry on the albedo measurements.q2000 Elsevier Science B.V. All rights
reserved.
Keywords: Radiation flux; Solar radiation; Terrestrial radiation; Cloud cover index
)Corresponding author. Tel.:q39-051-639-9586; fax:q39-051-639-9652.
Ž .
E-mail address: [email protected] T. Georgiadis .
0169-8095r00r$ - see front matterq2000 Elsevier Science B.V. All rights reserved. Ž .
1. Introduction
Ž .
In the planetary boundary layer PBL the solar energy received by the surface primes mechanisms of heat exchange between the surface and the atmosphere causing the development of different physical quantity fluxes. Such fluxes mainly have a turbulent character and show irregular patterns characterised by random variations of physical quantities in space and time.
To facilitate radiation studies at the surface, the incoming and reflected flux are
Ž . Ž .
normally divided into a short-wave radiation flux, b solar radiation, confined to the Ž .
spectral range between 0.3 and 2.2 mm, and c long-wave radiation flux, originated by
the sky and the surface and delimited between 6.8 and 100 mm. The 2.2–6.8 mm.
interval includes both short- and long-wave, which is, however, less than 5% of the total
Ž .
radiation Geiger, 1966 .
The radiation balance at the surface is described by the following relation:
QnsSiySoqLiyLo
where Q is the net radiation flux, S and S the short-wave radiation flux coming fromn i o
the sky and that reflected by the surface, L and L those in the long-wave coming fromi o
the atmosphere and emitted by the surface.
The fluxes in the PBL are regulated by the diurnal cycle of the surface energy balance:
QnyGqHqEs0
where G is the vertical heat flux into the surface, while H and E represent the latent and sensible heat flux in the atmosphere.
The data-set analysed in this work was collected at an Antarctic site where the surface is permanently covered by snow. The consequent high albedo values contribute to make it the coldest continent of the earth. The annual net radiation flux above the Antarctic surface is negative since in winter the visible radiation is practically absent, while in summer the high albedo reduces the radiation absorbed by the surface. The annual deficit in radiative energy must be balanced by the transfer of sensible and latent heat between the surface and the PBL.
Different systematic parameterisations have been proposed to model the incoming
Ž . Ž .
short-wave radiation S . Kasten and Czeplak 1980 proposed the following formulai
obtained for clear-sky conditions:
Sisa sin1
Ž
C.
ya2whereC is the solar elevation angle, a and a are experimental coefficients, which are1 2
strongly connected with the local conduction parameters, such as the altitude and the air turbidity.
Ž .
Another parameterisation was made by Haurwitz 1945 :
b
Sisasin
Ž
C.
exp ycrsinŽ
C.
The cloud cover has a strong influence in the long and short-wave radiation fluxes. Both the incoming and reflected visible radiation show a marked dependence on the cloud cover variation. On the contrary, the long-wave radiation emitted by the surface does not depend on the cloud cover. In Antarctica changes in cloud amount can determine considerable variations in albedo. In fact, on snow-covered surfaces the reflected radiation strongly depends on the incident direction of the light so that the presence of clouds can modify the ratio between direct and indirect radiation. The incoming short-wave flux is composed of two terms: a direct flux with a single angular direction and a component of diffused light due to scattering in the atmosphere which has, on the average, a smaller incident angle with the surface and is thus more reflected. Both are partially reflected by the surface and therefore depend on several factors such as the kind of soil, the surface humidity and its geometry.
Ž .
Iqbal 1983 proposed a parameterisation of albedo with the elevation angle:
X X X
a C
Ž
.
sa qŽ
1ya.
exp y0.1CyŽ
1ya.
r2whereaX
is the albedo at the maximum solar elevation angle andC the solar elevation
angle.
Another parameterisation obtained from a set of data recorded at the South Pole was
Ž . Ž
proposed by Carroll and Fitch 1981 . In clear-sky conditions NF0.25, with N cloud
.
cover index and forCF208their relation is:
a C
Ž
.
s0.98y0.0075Cso that for high elevation angles the albedo reaches a minimum value of 0.83.
Ž . Ž .
ForCF188in overcast conditions NG0.7 , Carroll and Fitch’s 1981
parameteri-sation changes in:
a C
Ž
.
s0.93y0.0050Cso that forC)188, the albedo value is 0.84.
The incoming long-wave radiation is the sum of the radiation emitted and transmitted by the various layers of the atmosphere. However, it is possible to consider the entire
atmosphere as a grey-body with an effective emissivity´a. Thus, the incoming long-wave
Ž .
flux becomes Paltridge and Platt, 1976 :
Lis´ sa Ta4
wheres is the Stefan–Boltzmann constant and T the air temperature near the surface.a
Ž .
Kondratyev 1969 was the first to emphasise the connection between ´a and the
vertical profile of humidity and temperature from the surface to 1–2 km a.m.s.l.
For convenience, relationships were formulated to relate ´a exclusively to the values
of humidity and temperature near the surface.
Ž .
The Brunt 1932 releationship makes ´a dependent on the square root of the water
Ž .
Ž1983 , or the dew-point temperature, like Berdhal and Martin 1984 . Another class of. Ž .
formulas utilises only the air temperature T at the surface to obtain the incominga
Ž .
long-wave radiation. An example is Swinbank’s 1963 formula:
Ls5.31=10y1 4T6
i a
Ž .
The Idso and Jackson 1969 expression is:
2
where LSw in is the relation proposed by Swinbank 1963 and Z the height of the station
in meters a.m.s.l.
Ž .
These expressions are based on the following facts: 1 a shallow surface layer with a
temperature close to T contains sufficient water vapour and CO to provide essentiallya 2
Ž .
full radiation in the H O and CO wave-band, and 2 the atmospheric water vapour2 2
content depends on its temperature.
Several studies showed that the diurnal trend of measured L differs from thisi
parameterisation, according to a well-defined distribution: during night-time the
Swin-Ž .
bank 1963 formula underestimates the real atmospheric emission by a constant
amount, while overestimates it the rest of the day with a maximum in the early afternoon.
Ž . Ž .
A similar trend was also found by Arnfield 1979 and Idso 1972 , through the
Ž .
analysis of the deviation from Idso and Jackson’s 1969 formula. The deviation always occurs during two well-defined periods of the day: during the first, which lasts almost 10 h, both relationships underestimate atmospheric emission, while in the second, corre-sponding to the early afternoon, they overestimate it.
Ž .
Paltridge 1970 realised that the air temperature at the surface was only a convenient approximation of the atmospheric temperature, and that it would have been more correct to use the emission barycenter temperature located at 200–300 m above the surface. In fact, during the night conditions when a thermal inversion generally take place, the surface air temperature is lower than the long-wave emission temperature of the sky; during the diurnal hours, when the maximum lapse-rate values are observed, the opposite occurs.
Different empirical relationships have been developed to relate the daily global irradiance with a cloud cover index.
In 1980 Kasten and Czeplak proposed the relationship:
SsS
Ž
1qb Nb 2.
i ifor 1
where N is the cloud cover index previously introduced, b and b empirical coeffi-1 2
cients that depend on the climate of the site, and S and Si ifor the incoming short-wave
Table 1
Coefficients of cloud type ki
Cloud type ki
data recorded in Hamburg over a 10-year period, they obtained the following mean values:
b1s y0.75
b2s3.4
Ž .
Concerning long-wave radiation, Arnfield 1979 proposed a relationship to correlate the sky radiation flux with the amount and type of cloud cover:
´as´ 1q
Ž
Ýk c ci i.
In this formula ´ represents the atmospheric emissivity in clear sky condition, k isi
the ith coefficient related to the individual cloud type i, c the total cloud cover fraction
and c the fractional cloud amount of any cloud type. Table 1 shows the k values usedi i
Ž .
by Arnfield 1979 .
Ž .
Paltridge 1970 tried to correlate the increase in infrared radiation coming from the sky with a cloud cover index by analysing a set of data recorded in Aspendale,
Australia. He found that any 1r10 of increase in the cloud cover index corresponds to a
mean increase of 0.6 mW cmy2 in the long-wave radiation flux.
This work aims at verifying the admissibility of the daily mean values of infrared radiation from the sky at the Antarctic measuring site with respect to the values of the
Ž . Ž . Ž .
Swinbank 1963 , Deacon 1970 and Idso and Jackson 1969 relationships. It shows
how to correlate the incoming solar radiation with the deviation of L from the expectedi
Ž .
Swinbank’s 1963 values for a clear day. It was possible to relate this deviation to the cloud cover amount according to the cloud height using the formula of Kasten and
Ž .
Czeplak 1980 . Finally, a particular geometric surface is modelled to explain the
Ž .
deviation from Iqbal’s 1983 formulation of the daily pattern of the albedo values, with regard to the solar azimuth and elevation angle.
2. Materials and methods
During the 9th and 10th Italian expedition a pyrradiometer and albedometer were set up at the Antarctic site. The biennial experiment, proposed by the Italian Programme of
Ž .
and development of katabatic flows and, more generally, to collect a data-set on the climatic patterns in this remote area. In the first year, the measurements were performed
Ž X
at two different sites located near the Italian base of Terra Nova Bay lat 74841 S, long
X
.
164807 E , close to the intersect point of the Priestley Glacier and the Nansen ice sheet
and, in the following year, over the Reeves Neve Glacier at 1200 m a.s.l.
`
The second set of measurement is used for the present work, which were collected
Ž .
throughout December every 10 min with a Schenk mod. 8111 net pyrradiometer and a
Ž .
Schenk mod. 8104 albedometer. Both were equipped with two sensors to collect the incoming radiation from the whole sphere. A direct estimation of both the total net radiation and the albedo was possible.
The net pyrradiometer is able to estimate the total net radiation in the 0.3–30 mm.
spectral range. The black surface of the upward sensor estimates the direct and indirect solar radiation and the thermal radiation emitted by the atmosphere. The visible radiation reflected by the surface and the long-wave radiation emitted from it are detected by the downward-looking sensor.
Ž .
The albedometer is made up of two pyranometers 0.3–3 mm for the direct
determination of the albedo. The upward sensor receives only the direct and indirect solar radiation from the sky, while the other receives the radiation reflected by the surface.
By means of a resistance thermometer inside the pyrradiometer, it is possible to determine the total radiation coming from the sky and from the surface, according to the following formulas
SqL sV f q´ sT4
i i u u s s
and
SoqLosV f1 1q´ ss Ts4
respectively, where T is the internal temperature of the instrument ands ´s its emissivity;
signals V and V are generated in the upper and lower receiving plates, respectively,u l
and fu and f are the calibration parameters suitable for the conversion in watts perl
square meter. Subsequently, using the albedometer signals, the incoming and outgoing long-wave radiative components are determined.
All the analog signals are converted into digital values by a fully programmable Campbell CR-10 data-logger capable to periodically store the values in an internal memory.
3. Results and discussion
3.1. Long-waÕe radiation
Ž .
To verify the suitability of the Swinbank 1963 formulation concerning the long-wave
Ž y2. Ž .
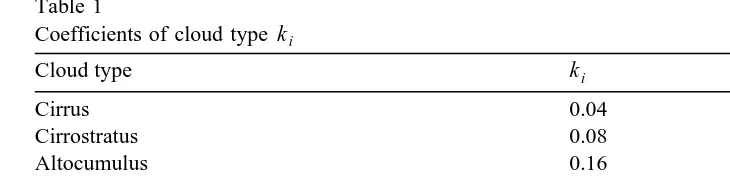
radiation from the sky, the entire set of values L mW cmi are plotted in Fig. 1 a , as
Ž .
Fig. 1. a Infrared atmospheric flux vs. long-wave radiation of a black-body with air temperature at screen
Ž .
level. Plotted is the entire data set from Reeves Neve. b Daily mean values of the atmospheric infrared flux` ŽLi.in comparison with the Swinbank 1963 , Idso and Jackson 1969 , and Deacon 1969 relationships.Ž . Ž . Ž .
temperature at screen level since the atmospheric effective emissivity is defined by the ratio of these quantities.
The analysis of L measurements shows a fairly homogeneous distribution around thei
Ž .
trend defined by Swinbank’s 1963 relationship, which was based on a set of measures
characterised by a black body radiation between 30 and 50 mW cmy2
Fig. 2. Daily pattern of infrared radiation from the sky on a clear-sky day.
According to a preliminary analysis of solar radiation flux data during the whole day, it is possible to make a preliminary classification between sunny days, with a sinusoidal trend nearly proportional to the sinus of sun elevation angle, and overcast days.
Ž .
In Fig. 1 b the mean daily values of the thermal atmospheric radiation flux are
plotted divided into sunny and cloudy days. As expected, L values for cloudy days arei
higher than for sunny days, but the mean values generally seem to confirm the Swinbank
Ž1963 and Deacon 1970 relations, being distributed near the Swinbank 1963 trend. Ž . Ž .
Ž .
and below the curve of Idso and Jackson 1969 .
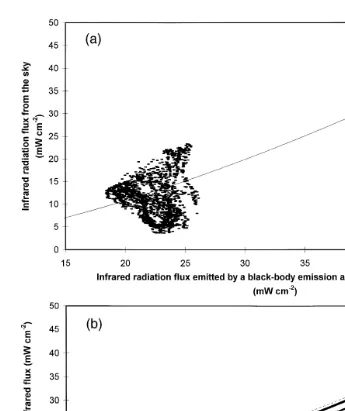
The values of the atmospheric radiation flux on one clear day are plotted them in Fig. 2 vs. the flux emitted by a black body at air temperature. Note the characteristic eight-shape pattern, a major feature of all clear days. The lowest part includes the mid-day values. On cloudy days we notice a spread with increasing radiation and temperature values.
Ž .
According to Paltridge 1970 , the values for cloudless days were plotted as
devia-Ž .
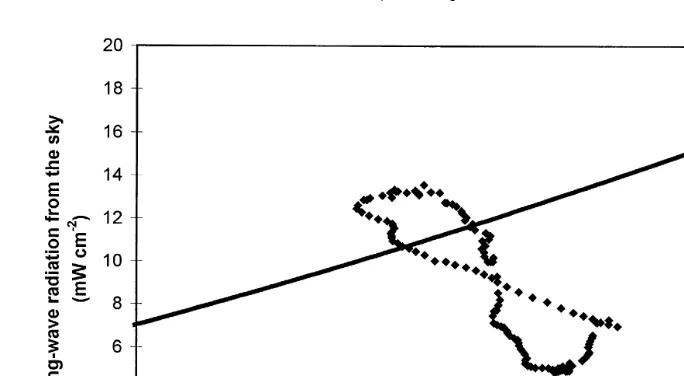
tions from Swinbank’s 1963 formula all day long. Fig. 3 displays the values of three
Ž .
nonconsecutive very clear days, which presented a similar pattern days: 332–334–344 .
Ž .
They are characterised by a trend at mid-day hours where the Swinbank 1963 relation seems to overestimate the flux of real atmospheric radiation, reaching minimal radiation
values neary9 mW cmy2
near mid-day.
The absence of a day–night cycle in polar measurements removes the night plateau characterised by a positive constant pattern.
3.2. Cloud coÕer
Ž .
Ž .
Fig. 3. Deviation of the atmospheric radiation values from those predicted by the Swinbank 1963 relation:
Ž .
solid lines correspond to three clear-sky days and the dashed line to a partially covered day early hours only . Numbers refer to day from the beginning of the year 1994.
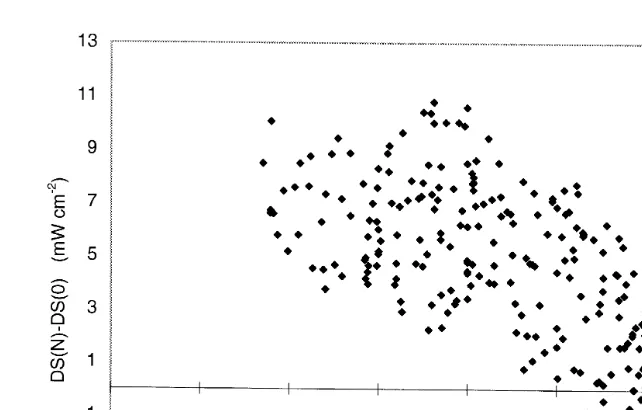
be closely connected to the cloud cover and, according to hypothesis, is independent of
Ž .
the temperature and humidity ranges. Paltridge 1970 associated this difference with the
Ž .
cloud cover index between 0 and 1 : on average, one degree of cloud cover corresponds
to a difference of about 0.6 mW cmy2. Following this argument it is possible determine
the daily pattern of the cloud cover index for any given day.
The study of all the available measurement days allows us to determine local
differences of up to 8–9 mW cmy2
from the trend line, which identify the three clear-sky days that always underestimate any different point value.
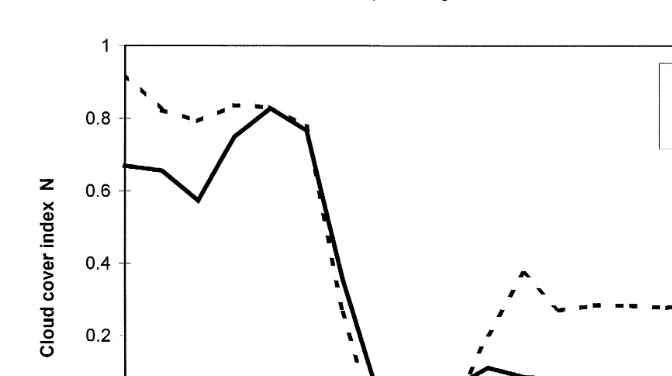
Fig. 4 shows the mean hourly trend of cloud cover index for the same partially
covered day as in Fig. 3; any 0.85 mW cmy2 of difference from the mean clear sky
trend corresponds to one degree of cloud cover. The relation used follows: DS N
Ž .
yDS 0Ž .
Ns
8.5
Ž .
where DS N represents the difference between the real flux of infrared atmospheric
Ž .
radiation and the one expected by the Swinbank 1963 formula, which depends on the air temperature values.
Ž .
According to the Kasten and Czeplak 1980 relation, the cloud cover can also be estimated using the variation of incident solar radiation flux by comparison with a clear day. In Fig. 4 the mean hourly values of N for the same partially covered day are plotted according to the following expression:
1rb2
1 S N
Ž .
Ns
ž
y1/
Ž .
Fig. 4. Mean hourly values of the cloud cover index throughout a day obtained from infrared solid and
Ž .
visible dashed radiation.
Ž .
where S 0 includes the mean hourly values of a clear day with marked clearness. The
Ž .
values of b and b coefficients are those calculated by Kasten and Czeplak 1980 at1 2
Hamburg on the basis of a 10-year data-set, assuming that in winter coefficient b has a1
mean value of 0.7, likely due to multiscattering effects between the snow surface and the cloud base.
The analysis of the daily pattern of the cloud cover index indicates a correlation between the result obtained through the atmospheric radiation flux and that deriving from the solar radiation flux: the partially covered day is characterised by a pronounced cloud cover in the last hours of day and a clear sky for the rest of the day. However, the entire set of mean hourly values appears to produce a poor correlation because a spread
Ž . Ž .
range of values of DS N yDS 0 corresponds to a single value of the quantity
Ž . Ž .
S N rS 0 . Unlike the case of solar radiation, for a given cloud cover index the
incoming infrared flux strongly depends on the physical characteristics of the cloud, especially the cloud base temperature, which in turn is directly linked to the cloud height.
Ž . Ž .
Fig. 5 plots the mean two-hourly values of DS N –DS 0 vs. the corresponding
Ž . Ž . Ž . Ž .
mean values of S N rS 0 y1 with the corresponding mean values of DS N yDS 0
at the same conditions of solar radiation, the picture shows a marked spread in infrared values which, however, seems to be limited by two linear relations.
Ž
Fig. 5. Relation between the mean two-hourly values of the fraction of visible radiation with respect to a clear
. Ž .
day and the differences from the clear day trend of the deviation from Swinbank’s 1963 formula.
According to this hypothesis, the data were divided into two groups: the values set under the best fit line belong to the group characterised by clouds at middle-low altitude; the data set below the best fit line was assigned the group characterised by clouds at
Fig. 6. Mean two-hourly values of the log10 of the fraction of visible radiation and of the difference between
Ž .
middle-high altitude. The coefficients a and b of the following formula for the two groups were subsequently and separately determined:
S N
Ž .
b1y sa DS N
Ž .
yDS 0Ž .
S 0
Ž .
The analysis of the middle-low cloud altitude data group resulted in good confidence coefficients a, mean value 0.02, and b, mean value 1.4. The analysis of the middle-high altitude data produced the coefficients a of about 0.16 and b of about 0.5. The confidence in this last case is somewhat lower and this can be ascribed to the fact that high clouds have less influence on the infrared terms than low clouds, unlike the case of visible radiation.
Ž .
The Kasten and Czeplak 1980 relationship introduced the following relation be-tween the cloud cover index and the difference bebe-tween the trends of the deviation from
Ž .
the Swinbank 1963 formula and the cloudless sky trend:
d
Nsc DS N
Ž .
yDS 0Ž .
Ž .
where DS 0 corresponds to the mean hourly values of the difference between the infrared radiative flux and the Swinbank one on a cloudless day. Table 2 shows the values of coefficients c and d depending on the height of the cloud base.
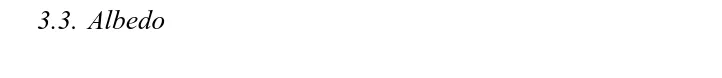
Fig. 7 is a scatter plot relating the cloud cover index obtained using the Kasten and
Ž .
Czeplak 1980 relation to that resulting from the parameterisation of long-wave
radiation.
The parameterisation is subject to strong limitations at low values in the cloud cover
Ž .
index. Kasten and Czeplak’s 1980 Hamburg measurements, especially in winter,
showed that the mean hourly values of the visible radiation flux for values up to about 0.3–0.4 of the cloud cover index were higher than the clear-sky day values, most likely on account of the scattering of visible radiation by clouds and surface.
3.3. Albedo
The short-wave radiation terms of a snow-covered surface need to be determined since the albedo is a crucial parameter that influences the surface energy balance. In Antarctica it presents high values limited between 0.81 and 0.85.
Because of these high values even a small variation in albedo can cause substantial variations in the absorbed visible radiation: indeed, a variation in albedo values 0.81 to 0.85 corresponds to a reduction of 21% in solar radiation absorbed by the surface. High
Table 2
Coefficients c and d in relation to the height of cloud cover base
Height of cloud base c d
High 0.65 0.15
Fig. 7. Scatter diagram of the cloud cover index N obtained by visible and infrared radiation.
albedo values cause the radiation balance in Antarctica to be negative for most of the year.
Fig. 8 shows the large variation of albedo during three cloudless days. This variation
Ž . Ž .
is more marked than in the Carroll and Fitch 1981 and Iqbal 1983 relations, and does
Ž . Ž . Ž .
Ž .
Fig. 9. Deviation of the observed albedo from the Iqbal 1983 expression for three cloudless days.
not have a good correlation with the elevation angle. We have calculated the difference
Ž .
between the measured albedo and that predicted by Iqbal 1983 :
r
Ž
C.
srXqŽ
1yrX.
expŽ
y0.1CyŽ
1yrX.
r2.
where rX is the albedo at the highest sun elevation angle and c the sun elevation angle.
In Fig. 9 the differences of the measured albedo for three cloudless days are plotted. Note that data refer to a set of measurements where the sun elevation was never below the horizon and an axial symmetry exists in to E–W direction with lowest albedo values when the sun was in the east and the highest in the opposite direction. This symmetry can be explained by the geometric conditions of the snow-covered surface.
Ž .
Fig. 11. Deviation in the albedo values of the modelled surface from the Iqbal 1983 formula.
A first solution to the problem of this albedo behaviour was to consider the effects of the surface slope in connection with the incident angle of the sun beam. The Reeves
glacier is in fact characterised by a constant slope in the E–W direction of about 2–38.
A quick analysis shows, however, that this value is by no means sufficient to explain so high a deviation from the expected albedo.
A strong relation has been assumed to exist between albedo and shape of the reflecting snow surface. It is well known that the surface of this Antarctic area is often
Ž .
subject to erosive and modelling phenomena sastrugi . A geometric model of such a surface that can cause these symmetry conditions has been conceived and is reported in
Ž .
Fig. 10 longitudinal cross-section . It is assumed that the longitudinal axis of this
surface lies in an E–W direction and that the angleg formed by the direct radiation with
the horizontal surface can be expressed by the relation below, proposed by Wendler and
Ž .
Kelley 1988 . The determination of the portion of the surface that lies in the shade at any time during the day is then computed as follows:
gsarctan tan
Ž .
c rcos AZŽ
=Dqp.
C and AZ are the elevation and solar azimuth angle, respectively, and D the
longitudinal direction of the surface.
For any given value ofg the ratio between the surface illuminated by the sun and
that corresponding tog ispr2 can be computed. Assuming the albedo is proportional
to the non-shady surface, the following relations allow for the determination of the effective albedo values from those of a perfectly horizontal surface:
Fig. 12. Photograph of the snow-covered surface at the measurement site. Clearly visible are the sastrugi formations.
The first approximates the albedo when the solar radiation illuminates the concave side of the surface, i.e. when the sun is to the West. Conversely, when the sun is in the
East, the albedo is approximated by the second relation, with g the solar elevation
angle.
Ž .
By introducing in this parameterisation Iqbal’s 1983 albedo relation instead of the
albedo for the plane surface and supposing that the ratio Lrh equals 20, we plotted the
difference between the albedo values generated by this particular surface and the expected values of a plane surface throughout the day. In Fig. 11 the trend generated by this surface model is plotted. The graph shows a reasonably good agreement with the real measured values, given also the very simple model.
To support the modelled surface pattern a photograph of the snow surface at the measurement site is reported in Fig. 12. A closer look reveals a crest about 10 cm high and a mean shed of about 2 m.
4. Conclusions
The validity of all relationships relating atmospheric radiation and air temperature at
Ž .
an Antarctic site was checked. Special attention was devoted to Swinbank’s 1963 formula while analysing on an hourly basis data recorded during the entire polar day, which did not have any night-time during the examined period.
Ž .
Following the approach of Paltridge 1970 the study concerned a set of cloudless days so that a clear-sky trend could be determined that relates the deviation of
Ž .
Assuming that the long-wave radiation due to clouds is independent of the hour, the cloud cover was estimated throughout the day even for partially or totally covered days simply through comparison with clear-sky trend. Unlike short-wave radiation, long-wave radiation coming from the sky to the surface resulted strongly dependent on the height of the cloud body. Under the same cloud cover conditions the low cloud body supplied a more pronounced radiative contribution than the high one. The estimate of the cloud
Ž .
cover using the deviation from the Swinbank’s 1963 relationship as input for the one
Ž Ž ..
obtained by the short-wave analysis Kasten and Czeplak 1980 provided more
information on the kind of cloud cover, in addition to its extension.
A study of the albedo values throughout the day permitted the verification of
Ž .
geometric hypotheses concerning the morphology of the snow cover sastrugi .
Acknowledgements
Ž .
This work was granted by PNRA National Program of Antarctic Researches . The authors wish to thank Dr. Zucchelli and the staff of the ENEA-Progetto Antartide for their logistic and technical support.
References
Arnfield, A.J., 1979. Evaluation of empirical expressions for the estimation of hourly and daily totals of atmospheric long-wave emission under all sky conditions. Q. J. R. Metereol. Soc. 105, 1041–1052. Berdhal, P., Martin, M., 1984. Emissivity of clear skies. Solar Energy 32, 663–664.
Brunt, D., 1932. Notes on radiation in the atmosphere. Q. J. R. Meteorol. Soc. 58, 389–420.
Brutsaert, W., 1975. On a derivable formula for long-wave radiation from clear skies. Water Resour. Res. 11, 742–744.
Carroll, J.J., Fitch, B.W., 1981. Effects of solar elevation and cloudiness on snow albedo at the south pole. J.
Ž .
Geophys. Res. 86 C6 , 5271–5276.
Deacon, E.L., 1970. The derivation of Swinbank’s long-wave radiation formula. Q. J. R. Meteorol. Soc. 96, 313–319.
Haurwitz, B., 1945. Insolation in relation to cloudiness and cloud density. J. Meteorol. 2, 154–166. Idso, S.B., 1972. Systematic deviations of clear sky atmospheric thermal radiation from predictions of
empirical formulae. Q. J. R. Meteorol. Soc. 98, 399–401.
Idso, S.B., 1983. On calculating thermal radiation from cloudless skies. Arch. Meteorol., Geophys. Bioklama-tol., Ser. B 32, 53–57.
Idso, S.B., Jackson, R.D., 1969. Thermal radiation from the atmosphere. J. Geophys. Res. 74, 5397–5403. Iqbal, M., 1983. An Introduction to Solar Radiation. Academic Press, 390 pp.
Kasten, F., Czeplak, G., 1980. Solar and terrestrial radiation dependent on the amount and type of cloud. Solar Energy 24, 177–189.
Kondratyev, K., 1969. Radiation in the Atmosphere. Academic Press, New York, 912 pp.
Paltridge, G.W., 1970. Day-time long-wave radiation from the sky. Q. J. R. Meteorol. Soc. 96, 645–653. Paltridge, G.W., Platt, C.M., 1976. Radiative processes in meteorology and climatology, Dev. Atmos. Sci. 5
Elsevier.
Swinbank, W.C., 1963. Long-wave radiation from clear skies. Q. J. R. Meteorol. Soc. 89, 339–348. Wendler, G., Kelley, J., 1988. On the albedo of snow in Antarctica: a contribution to I.A.G.O. J. Glaciol. 34,


![PENDAHULUAN Pengaruh Penambahan Aluminium Sulfat [Al2(SO4)3] Terhadap Penurunan Biological Oxygen Demand (Bod) Limbah Cair Tahu Di Dukuh Kanoman Gagaksipat Ngemplak Boyolali.](data:image/gif;base64,R0lGODlhAQABAIAAAP///wAAACH5BAEAAAAALAAAAAABAAEAAAICRAEAOw==)