Classification of urban feature from unmanned aerial vehicle images using GASVM
integration and multi-scale segmentation
M.Modiri, A.Salehabadi, M.Mohebbi, A.M.Hashemi, M.Masumi
National Geographical Organization
KEY WORDS: Classification, UAV images, GASVM, segmentation
Abstract:
The use of UAV in the application of photogrammetry to obtain cover images and achieve the
main objectives of the photogrammetric mapping has been a boom in the region
.
The images
taken from REGGIOLO region in the province of, Italy Reggio -Emilia by UAV with non-metric
camera Canon Ixus and with an average height of 139.42 meters were used to classify urban
feature. Using the software provided SURE and cover images of the study area, to produce dense
point cloud, DSM and Artvqvtv spatial resolution of 10 cm was prepared. DTM area using
Adaptive TIN filtering algorithm was developed. NDSM area was prepared with using the
difference between DSM and DTM and a separate features in the image stack. In order to extract
features, using simultaneous occurrence matrix features mean, variance, homogeneity, contrast,
dissimilarity, entropy, second moment, and correlation for each of the RGB band image was
used Orthophoto area. Classes used to classify urban problems, including buildings, trees and tall
vegetation, grass and vegetation short, paved road and is impervious surfaces. Class consists of
impervious surfaces such as pavement conditions, the cement, the car, the roof is stored. In order
to pixel-based classification and selection of optimal features of classification was GASVM pixel
basis.
In order to achieve the classification results with higher accuracy and spectral composition
informations, texture, and shape conceptual image featureOrthophoto area was fencing. The
segmentation of multi-scale segmentation method was used.it belonged class. Search results
using the proposed classification of urban feature, suggests the suitability of this method of
classification complications UAV is a city using images. The overall accuracy and kappa
coefficient method proposed in this study, respectively, 47/93% and 84/91% was.
1.
Introduction
The use of UAVs in various fields and
particularly photogrammetry has expanded.
UAV is the Motor vehicle and are reusable
unmanned. Van Blyenburgh, 1999)). This
means the remote control, semi-automatic,
automatic, or a combination of the ability to
differentiate. In UAV with manned aircraft,
it is clear that the main difference between
the two systems is that the UAV pilot in the
aircraft to be operated without physical
presence.The major advantages of UAVs
conditions and relatively rainy climate, data
acquisition with UAVs because they are able
to fly below the clouds is still possible
weather conditions such as data acquisition
with integrated large format cameras
installed on manned aircraft due to fly
height does not allow for more. In addition,
one of the main advantages of UAVs lack of
psychological pressure or acceleration G and
the height of the pilot. In addition,
supplementary benefits in the ability and the
ability for quick access to information Real
time, as long as images and videos can be
transmitted in real time to a ground control
station
.
More UAV systems on the market is
low-cost systems. as a result one of the main
advantages of using UAVs is the cost factor.
Figure 1 position among other branches
UAV photogrammetric surveying shows.
Figure 1. UAV photogrammetry place alongside other sub-branches of photogrammetry
In this study, we tried to classify the urban
feature in the images taken by a UAV with
the highest precision and quality style. Then,
in the next section details the proposed
method and the third part of the data used
and the desired characteristics of the aircraft
will be introduced. Then, in the fourth part
of the implementation and results of the
evaluation will be presented and discussed.
Finally, conclusions and recommendations
expressed in the fifth.
2. The offered method to classify the
urban feature of UAV images
The proposed method to classify urban
feature of images captured by the UAV
consists of five main parts. In the first part
of convergent images taken from the area
Orthophoto, DSM, DTM and NDSM is
provided. The next section features GLCM
of Orthophoto area of tissue matrix is
produced and then used as input along with
NDSM fall. The third part of the core SVM
classifier using genetic algorithms and
parameters of the main features of the kernel
SVM determined. In fact, in this part of the
image classification features and parameters
are set using GASVM. In the fourth part
Orthophoto of images taken by UAV
produced using multi-scale segmentation.
Finally in the fifth classification image by
image segmentation merge with. This
integration is this section that are more than
50% of classes in the image of Nada floor
covering belong to that class.
2.1. Preparation of Orthophoto, DSM,
DTM, NDSM
Error Orthophoto place UAV sensors made
from images taken by the Landsat images
have more importance than manned aircraft.
Because of the spatial and angular
parameters, UAV images of much lower
order than aerial imagery that has regular
flight routes and distances are given specific
shooting. In precision work,
a UAV sensor consists of three main stages
were as follows:
• justification
Images
• Production of the grid
• Production
Orthophoto Field
The justification images, using automatic
matching algorithm such as SIFT and SURF
cloud
common
condition
in
images
produced by the linear adjustment beam out
images of justification is provided. It should
be
noted
that
elements
of
internal
justification and calibration method is
produced by the UAV camera calibration
parameters. In the second phase for the
production of grid fitted sheet on the
corresponding point cloud generated in the
previous step and therefore DSM production
area to be used. DTM production area of
Adaptive TIN filtering method is used.
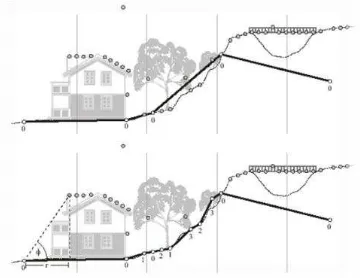
Figure 2. Progressive compression algorithm Axelsson. first estimate based on the minimum height
of the bare ground in neighborhoods (above) and subsequent estimates based on the angle and distance
to the nearest node
Labeling function for this algorithm is as
follows
ability of the algorithm to model the uneven
levels of returns, in addition to the
significant potential of urban areas to
separate from the rest of the raw LiDAR is
the bare ground. In this study was to identify
the feature high model surface normal level
nDSM production. Then by applying a
threshold elevation on the high feature
identification was done. Digital models are
used to produce normal levels of the
following equation.
2.2. extraction of texture features
Using a combination of spectral and textural
classes with similar spectral responses (such
as low density vegetation areas and urban
areas) increased the classification accuracy
(Zhang, 1999). Feature extraction involves
extracting tissue characteristics of spectral
bands. One of the common methods used to
extract texture features matrix images at the
same event. Haralick and colleagues in 1973
had taken images at the same time features
based on occurrence matrix and each was
introduced as a representative of a
characteristic image (Haralick et al., 1973).
In this study the properties of mean,
variance,
homogeneity,
contrast,
dissimilarity, entropy, second moment, and
correlation were used.
2.3- Classification by GASVM
parametric methods such as classification
Maximum likelihood is the more accurate
[12]. SVM classification of certain statistical
distribution of data does not assume and
because remote sensing data usually have no
statistical distribution, it is important that the
parameters are heterogeneous and also in
cases of demonstrated well [13]. The basic
idea of SVM finding the optimal hyperplane
to separate the two classes are separated by
the greatest margin. For the non-linear
separation through kernel function input
space into a higher dimensional feature
space where a linear list can be found above,
the mapping.
2.4. Multi-scale segmentation
At this stage Orthophoto production of UAV
images were segmented. In fact, break the
image segmentation polygon areas with
different characteristics. The image of the
objects are called. Multi-scale segmentation
is one of the best methods of segmentation
of images. Multi-scale segmentation a
segmentation method that integrates areas of
a pixel start and for successive pixels or
objects merge the existing image. The
successive step integration of the region so
far-is that the heterogeneity of the parameter
in question does not exceed the threshold.
This bottom-up approach based on local
integration technique progress. The local
integration combine objects based on the
nearest object and parameter control
together the final image does not exist [42].
There is an optimal algorithm for a specified
number of objects at least parameter
heterogeneity and homogeneity provides
maximum parameter. The best method of
two-way. Figure 3 9-section of the most
important methods of display.
Figure 3 types of fencing, the above figure, multi-scale and left, the four-and-down tree, grid
2.5 The integration of the results of the
classification and segmentation
At this stage, the results of image
segmentation and classification
Multi-scale segmentation Orthophoto with
other UAV images are produced. Each of
the segments produced by segmentation
Chndmqyas·h that more than 50% of
classes in the cover image classification
to belong to that class. So the results of
the segmentation and classification, in
the final classification maps are very
impressive.
3. used Data
the
images
which
taken
from
REGGIOLO region in the province of
Emilia, Italy Rjyv- by UAV with
non-metric camera Canon Ixus and of
medium height 139.42 m was used to
classify urban feature. The study
involved unmanned aircraft over the city
average of 42/139 meters altitude flying
and 18 of the region's image. Using the
software provided SURE and cover
images of the study area, to produce
dense point cloud, DSM and carefully
place Artvqvtv 10 cm was used. Figure 1
Study
area
and
DSM
obtained
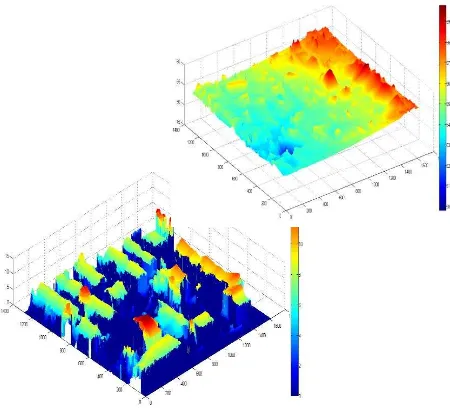
Figure 4. The provided data a) Ortho Photo area B) produced DSM
Ortho photo and DSM and area DTM as
input data are entered into the offered
algorithm to classification of urban
features.
4. Implementation and evaluation of
results
In order to implement the proposed
method, the software MATLAB 2013b,
SURE and eCognition 9.2 is used. Other
parts of the proposed method in
accordance with the details described in
the previous section's programming. This
section details the implementation and
results presented and discussed.
4.1 Evaluation Results
DTM area was provided using Adaptive
TIN filtering algorithm. NDSM area
using the difference between DSM and
DTM was prepared and a separate
features in the image stack. Figure 6,
DTM and NDSM of the area shows.
Figure 5 (a)) DTM obtained from the study area) NDSM obtained from the study area
feature selection took place at the same
time. Interval [2 ^ (- 5), 2 ^ 10] and [2 ^
(-
7), 2 ^ 3, respectively for C and γ
parameters were considered. After the
implementation GASVM band input of
17 bands were selected as features and
optimal parameter
s C and γ respectively
245 and 775/0 was selected. Figure 7
graph algorithm convergence transgenic
best Kappa coefficient based on the best
features and kernel parameter indicates
the term compensation.
Figure 6 charts the genetic algorithm
convergence to the lowest amount of merit (best Kappa coefficient
The evaluation criteria for classification
accuracy GASVM Orthophoto prepared
from UAV images of the study area is
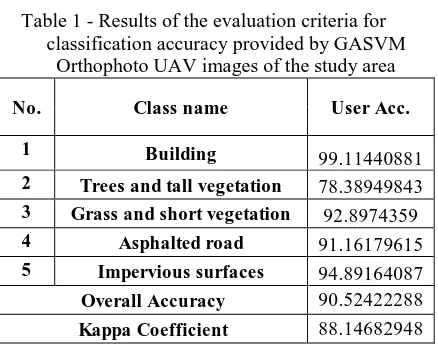
given in Table 1.
Table 1 - Results of the evaluation criteria for classification accuracy provided by GASVM
Orthophoto UAV images of the study area
No. Class name User Acc.
1 Building 99.11440881
2 Trees and tall vegetation 78.38949843
3 Grass and short vegetation 92.8974359
4 Asphalted road 91.16179615
5 Impervious surfaces 94.89164087
Overall Accuracy 90.52422288
Kappa Coefficient 88.14682948
According to Table 1, the most accurate
classification
GASVM,
for
office
buildings, and the lowest accuracy of
impermeable surfaces, due to the spectral
similarity with other classes. In order to
achieve the classification results with
higher
accuracy
and
spectral
composition,
texture,
and
shape
conceptual image featureOrthophoto area
was fencing. The division of the
multi-scale-package was used. Because based
on the integration of a pixel area which
has started and for successive pixels or
objects merge the existing image.
Parameters of the scale, shape and
homogeneity on the basis of resolution
Orthophoto and complications in the
area, respectively with 30, 2.0 and 3.0
were considered. Figure 7 Orthophoto
segmented by segmenting Chndmqyas·h
show.
Figure.7 urban features multi-scale Segmentation of Ortho photo made from taken
images from UAV
Finally, The image acquisition is
classified for urban side of the area of
integration of the results of the
classification of the pixels were GASVM
as the segment that more than 50 percent
of the class classification were included
in the picture belonged to that class..
Table 2 - Results of the evaluation criteria for classification accuracy urban of the integration of the results of classification using multi-scale Orthophoto GASVM and fencing made from UAV images of the
No. Class name User Acc.
1 Building 99.66515188
2 Trees and tall vegetation 86.22039135
3 Grass and short vegetation 94.6337926
4 Asphalted road 93.98350315
5 Impervious surfaces 94.22730006
Overall Accuracy 93.47752291
Kappa Coefficient 91.84276828
By comparing the results in Table 1 and
2
is
classified
as
urban
feature
Orthophoto prepared from UAV images
using the integrated multi-scale image
classification Bkhsh¬Bndy GASVM and
more accurate classification of all classes
to use for single GASVM.
a b
Figure.8Classification of urban features Orthophoto city derived from images taken from the
UAV images a) classification GASVM b) the integration of multi-scale classification
.
5
.Conclusion
The use of UAVs in the application of
photogrammetry to obtain cover images
and achieve the main objectives of the
photogrammetric mapping has been a
boom in the region. Due to the need for
such
systems
in
photogrammetric
applications, the need for the feasibility
of such systems for the classification of
urban toll system images are palpable. In
this study, using the integration of the
results of multi-scale image classification
and the classification GASVM urban
problems with quality and precision than
using single classification of GASVM
Orthophoto prepared from UAV images
of the study area better result was
reached. So that the overall accuracy and
kappa coefficient classification image
using this method 953/2 and 696/3
percent,
respectively.
The
use
of
integration and classification of events
leading
to
the
use
of
spectral
information, texture and geometric
feature
and
background
better
classification
of
urban
problems,
particularly in Orthophoto UAV images
is provided
.
6. REFERENCES
[1] P. Axelsson, "DEM generation from laser scanner data using adaptive TIN models," International Archives of Photogrammetry and Remote Sensing, vol. 33, pp. 111-118, 2000.
[2] G. Xu and Z. Zhang, Epipolar geometry in stereo, motion and object recognition: a unified approach vol. 6: Springer, 1996. [3] A. C. Bovik, M. Clark, and W. S. Geisler,
"Multichannel texture analysis using localized spatial filters," Pattern Analysis and Machine Intelligence, IEEE Transactions on, vol. 12, pp. 55-73, 1990. [4] M. Clark, A. C. Bovik, and W. S. Geisler,
"Texture segmentation using Gabor modulation/demodulation," Pattern Recognition Letters, vol. 6, pp. 261-267, 1987.
[5] J. G. Daugman, "Complete discrete 2-D Gabor transforms by neural networks for image analysis and compression," Acoustics, Speech and Signal Processing, IEEE Transactions on, vol. 36, pp. 1169-1179, 1988.


