MAPPING FROM SPACE
–
ONTOLOGY BASED MAP PRODUCTION USING
SATELLITE IMAGERIES
A. Asefpour Vakilian*, M. Momeni
Department of Surveying, Faculty of Engineering, University of Isfahan, Hezar Jarib Street, Isfahan, Iran - (afshin.asefpour, momeni)@eng.ui.ac.ir
KEY WORDS: HRSI, ontology, cartographic feature determination, map production
ABSTRACT:
Determination of the maximum ability for feature extraction from satellite imageries based on ontology procedure using cartographic feature determination is the main objective of this research. Therefore, a special ontology has been developed to extract maximum volume of information available in different high resolution satellite imageries and compare them to the map information layers required in each specific scale due to unified specification for surveying and mapping. ontology seeks to provide an explicit and comprehensive classification of entities in all sphere of being. This study proposes a new method for automatic maximum map feature extraction and reconstruction of high resolution satellite images. For example, in order to extract building blocks to produce 1:5000 scale and smaller maps, the road networks located around the building blocks should be determined. Thus, a new building index has been developed based on concepts obtained from ontology. Building blocks have been extracted with completeness about 83%. Then, road networks have been extracted and reconstructed to create a uniform network with less discontinuity on it. In this case, building blocks have been extracted with proper performance and the false positive value from confusion matrix was reduced by about 7%. Results showed that vegetation cover and water features have been extracted completely (100%) and about 71% of limits have been extracted. Also, the proposed method in this article had the ability to produce a map with largest scale possible from any multi spectral high resolution satellite imagery equal to or smaller than 1:5000.
* Corresponding author.
1. INTRODUCTION
It is a fact that high spatial resolution satellite imagery is an alternative for aerial photography due to its advantages over aerial photogrammetry such as globally availability, low cost, including hyper or multi spectral bands and so on. One of the main disadvantages of using satellite images in map production is the lower information compared with aerial images. Satellite remotely sensed images consist of spectral, spatial and temporal resolution. Spectral information is the main foundation of remotely sensed image classification. High resolution commercial satellite images with multi spectral channels are now available, which provides more potential for automatic and accurate building detection and extraction. Although the high resolution data contain rich information in the spatial domain, it is generally agreed that the increase of spatial resolution does not necessarily signify the increase of interpretation accuracy because of variation in each class and effects of boundaries in high resolution satellite images (Alpin et al., 1999; Hsieh et al., 2001). Recent advances in high resolution image processing focus on spatial and structural feature extraction, e.g., pixel shape index (Huang et al., 2007), differential morphological profiles (Benediktsson et al., 2003), wavelet based textures (Bian, 2003; Saroj, 2007), combination of both pixel based and object based analysis (Chen and Blong, 2003) and Gray Level Co-occurrence Matrix (GLCM) (Pacifici et al., 2009). The spatial information can be used to complement the spectral feature space and enhance the separability of classes with similar spectral responses (Huang and Zheng, 2011). Another research used ECHO and ISODATA classifiers to provide an approximate location of buildings, and a fine extraction was then carried out through a squaring approach based on the
Hough transformation (Lee et al., 2003). An automated building extraction strategy was presented which simultaneously exploited structural, contextual, and spectral information with integrating the results of mentioned information sources (Jin and Davis, 2005). Another study integrated the stereo image pairs, segmentation of classified image, and the level-set based shape model for automatic building detection (Lu et al., 2006). Another research used neural networks and Markov random field to classify boundary and non-boundary pixels, respectively. Final result was obtained based on a decision fusion (Gamba et al., 2007). Structural information needed for interpretation of an image does not exist in just one pixel and the whole meaningful objects in the image are involved (Flanders et al., 2003). An Object Based Analysis (OBA) approach studied the optimization of multi scale segmentation for building recognition (Tian and Chen, 2007). An adaptive mean shift segmentation procedure was proposed for discrimination of urban structures with similar spectral attributes (e.g., buildings, roads, trails) (Huang and Zhang, 2007). However, some researches revealed that the major limitation of the OBA was the inaccurate spatial relation between objects and segments (Lhomme et al., 2009), i.e., the segmentation results can not accurately describe the position, shape and context of objects. A recent research developed an automatic object rule-based approach to extract features from high resolution multi spectral satellite images (Bouziani et al., 2010). This method consists of pixel-based, object-based and rule-based techniques. The digital map should be available in this method. Accuracy of this method approximated higher than 90%. In another research, a combination of two levels of micro information (homogeneity, entropy, angular second moment, International Archives of the Photogrammetry, Remote Sensing and Spatial Information Sciences, Volume XL-1/W3, 2013
dissimilarity, mean, correlation, variance, contrast) and macro information (edge information such as size and shape) was presented to extract features from Quick Bird high resolution images (Ouma et al., 2010). Discrete wavelet transformation and GLCM transformation were used to extract macro and micro information respectively. A Morphological Building Index (MBI) for automatic extraction of buildings from High Resolution Satellite Images (HRSI) was presented next (Huang et al., 2011). A threshold was defined on morphological properties (reconstruction, granulometry and directionality) to extract buildings from HRSI. Another research performed a comparison between pixel-based and object-based classification methods (Murthy et al., 2012). They found out that object-based methods are more accurate than the pixel-based methods. The most recent research presents a classification method based on GLCM for HRSI, in which features are extracted after smoothing by Gaussian filter (Ariputhiran et al., 2013). Finally, extracted features were classified using Back Propagation Artificial Neural Network (BPANN).
In this paper, an automated building extraction strategy for high resolution satellite imagery is proposed which uses maximum information available in an image. This strategy runs automatically without any pre-classification or any training sets, also there is no need to any initial values to be set by the user. First, some rules were created using ontology and a set of morphological operations of different sizes and orientations performed on the initial image to build the Differential Morphological Profile (DMP) to provide image structural information. Resulted image in this level contained maximum data of roads, blocks of buildings, vegetation covers and shadows. Spectral information was used to extract vegetation cover, shadows information and bright buildings. Second, shadows were extracted and their main azimuth was calculated to determine orientation of building blocks to separate them from other objects. According to unified specification for surveying and mapping, there were four feature classes needed to create a 1:5000 scale map: blocks of buildings, roads, vegetation cover and water features. Third, an MBI threshold was defined to eliminate extra information. Furthermore, a geodesic closing operation was performed to prevent weak connections between structures. Road network was then extracted from subtracting resulted image from morphological operations and the image of shadows. By having the maximum level of information extracted from initial image and the information available from shadows, roads, vegetation covers and water features separately, it could be possible to extract building blocks information more precisely. Finally, a comparison between precision in each level of feature extraction like road network, vegetation covers and water features and their effects on precision of building extraction has been developed. It is obvious that final precision of building blocks extraction directly depends on precision in each level of feature extraction. Performance evaluations of the different extraction combinations of information were reported and analysed. Results showed a better performance for feature extraction in proposed method.
2. METHODOLOGY
ontology seeks to provide an explicit and comprehensive classification of entities in all sphere of being. The classification should be definitive and exhaustive in order that it can select entities that are needed for a complete description and explanation of all the goings-on in the universe, and also all types of entities should be included in it. In order to create ontology for a special usage, concepts which are depending on
both particular task and domain must be described. Finally, the minimum number of concepts and their relationships will be defined as top-level ontology. For example, some application (low-level) concepts for high resolution satellite imagery inferred in this study were: building, road, vegetation cover, shadow, contrast, homogeneity, adjacency, size, geometry, scale and the azimuth of the sun. First step was to study the ability of human intelligence to recognize features and then, rules have been established to extract them and one of these rules was dependency of features. In other words, one set of features cannot be extracted till other ones did not extract. For example, building objects can recognise better by understanding the position and direction of road networks, or it is hard to recognise buildings without any shadows.
Some low-level ontological concepts for feature extraction are described below:
Regular geometry shape: each human made object has a regular geometric shape. Buildings and building blocks have a regular geometrc shape and orientation.
Adjacency: because of the adjacency of buildings and road networks, if one has been extracted, the other can be extracted easily.
Shadow: there must be an appropriate shadow for each building in order to extract. Shadows are always connected to the building directly. Agricultural fields have a regular geometric shape too, but they do not have shadows, and also they are vast. Size and length to width ratio: buildings are squared shape while roads are linear and agricultural fields are vast.
Vegetation cover: multispectral satellite images make it easy to calculate Normalized Differential Vegetation Index (NDVI) to separate vegetation cover and canopy from other objects. Homogeneity: roads are almost homogeneous, but roofs of the buildings can be heterogeneous.
Contrast: it is almost consistent on every man-made object. Scale: prevent cars and other small regular objects from knowing as a building.
Azimuth of the sun: this parameter can be calculated from shadows direction and it can be used to identify the right orientation of building blocks and road networks. Building blocks are always parallel to the azimuth of the shadows, but road networks can be orthogonal to them.
In this paper, ontology was used to recognize and extract maximum amount of features related to 1:5000 scale map from high resolution satellite image. Therefore, Quick Bird multispectral and panchromatic satellite image acquired in September 2008 was used to test the ontological integrated map production strategy. The multispectral image had a spatial resolution of 2.4 m and contains four bands (red, green, blue and near infrared). Mentioned image was merged with the panchromatic image, which had a spatial resolution of 0.6 m. Mathematical morphology differed from many other image processing techniques because it was a nonlinear approach, usually dealing with discrete data in terms of sets and set operations. The morphological profile and the DMP were new concepts and both were based on the use of opening and closing by reconstruction with different Structuring Element (SE) sizes (Pesaresi and Benediktsson, 2001).
Proposed method in this paper used an opening operation with a structuring element oriented in four main directions (45, 90, 135 and 180 degrees) and five different scales (5×5, 10×10, 15×15, 20×20, 25×25 pixels). Therefore, 20 different opening operations have been performed on the input satellite image. A sample test was presented here in order to demonstrate the processing steps of the proposed procedure (from Figure 1 to Figure 4). Figure 1A shows the difference between main image and reconstructed image with 5×5 size SE. The scale of SE International Archives of the Photogrammetry, Remote Sensing and Spatial Information Sciences, Volume XL-1/W3, 2013
differed from 5 to 25 from Figure 1A to Figure 1E. Figure 1F is the result of summation of previous images. Figure 2 to Figure 4 present a rotation from 90° to 180°. Finally, resulted image from four main directions with five scales were summed to result the final image with more features in it (Figure 5).
Figure 1. Subtraction of main image from reconstructed image by a SE with 45 degree direction and a scale of, A. 5×5, B. 10×10, C. 15×15, D. 20×20, E. 25×25. F. Summation of A to E
Figure 2. Subtraction of main image from reconstructed image by a SE with 90 degree direction and a scale of, A. 5×5, B. 10×10, C. 15×15, D. 20×20, E. 25×25. F. Summation of A to E
Figure 3. Subtraction of main image from reconstructed image by a SE with 135 degree direction and a scale of, A. 5×5, B. 10×10, C. 15×15, D. 20×20, E. 25×25. F. Summation of A to E
Figure 4. Subtraction of main image from reconstructed image by a SE with 180 degree direction and a scale of, A. 5×5, B. 10×10, C. 15×15, D. 20×20, E. 25×25. F. Summation of A to E
Figure 5. The result of summation of 20 levels of performing opening operator.
According to unified specification for surveying and mapping, there were four main feature classes existing in a 1:5000 and smaller scale map; blocks of buildings, roads, vegetation cover and water features. Two last feature classes can easily extracted using NDVI or any other vegetation index. However, there was an interaction between two other classes. Blocks of buildings and roads were more complicated and one could not extract while the other one did not extract.
For extraction of vegetation cover, spectral bands were used. NDVI was calculated on the image and pixels with values greater than 0.2 were classified as vegetation. However, there was no single tree in a 1:5000 scale map and there were only colonnades or planting area. The shape attributes such as length width ratio and area were computed based on the connected component analysis (Gonzalez and Woods, 2002) Thus, connected component operation was performed and components with area less than 3 pixels were eliminated. The difference between planting area and colonnades could be determined based on the length width ratio of each connected component; if the ratio is more than 5, it is a colonnade; else, it is a planting area (Figure 6).
Figure 6. Colonnades vegetation cover extracted using NDVI
Water features could be extracted just like vegetation cover. NDVI less than -0.1 for each pixel showed a water feature. However, it was possible that single pixel water features remained in the final result. Therefore, connected component operation was performed again to eliminate components with area less than 10 pixels. There were also two classes for water features in a 1:5000 scale map: lakes and rivers. Characteristics of lakes and rivers were similar to planting area and colonnades, respectively. Therefore, length with ratio was used again to separate these two features. But there was no water object in the sample image.
Next step was extraction of shadows and determination of their azimuth followed by determination of azimuth of the sun. For this reason, a closing operation was performed on the image resulted in Figure 5 and then, features with area more than 1000 pixels or less than 40 pixels and length width ratio less than 3 were eliminated from image. Therefore, only components with relation to shadow features remained (Figure 7A). Borders of shadow components were extracted using morphological approach (Gonzalez and Woods, 2002). In this approach, the main image eroded with a 3×3 SE and the main image subtracted from resulted image from dilation (equation 1).
) ( )
(A A AB
(1)Where, A is the main image and B is the squared shape SE with a dimension of 3×3. (A) is the boundary given by the set difference between A and its erosion. Figure 7B shows the borders of shadows.
The length to width ratio for each component was calculated and the larger edge was selected as the length of each component. By knowing the position of pixels related to the larger edge of each component, main azimuth of shadows was calculated as a value from 0 to 90.
Figure 7. A. Main shadows extracted using closing operation followed by elimination of unrelated connected components, B.
Borders of shadows
Azimuth of the sun at the time of capture of the image calculated using the orthogonal to azimuth of shadows. By having the azimuth of shadows, Building azimuths and even road networks azimuths can be determined, because of adjacency of road networks and buildings. Therefore, the azimuth of each branch of road networks is parallel or orthogonal to the azimuth of buildings.
Next step was extraction of road networks. Shadow pixels were eliminated using NDVI, because near infrared values in shadowed area is much more than red values in the same area. Thus, NDVI showed bigger value in the shadowed area and NDVI bigger than 0.2 were absolutely contained all shadow pixels. NDVI values related to the road network were smaller than 0.15.
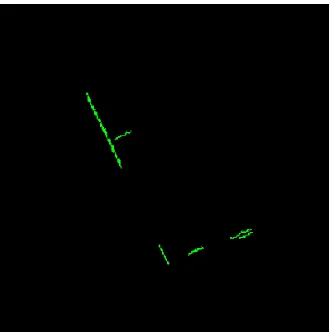
Therefore, main image was subtracted from shadow-free image to produce the image with maximum amount of pixels related to road networks, and there were few pixels related to water features, shadows and vegetation cover (Figure 8A). To reduce extra information from resulted image, opening and closing operations were performed on the image, respectively (Figure 8B). Hough transform was then used to connect single pixels remained in the Figure 8B based on the azimuth of shadows or its orthogonal angle (Figure 8C). Pixels with no connections were not eliminated, because they were steel related to a branch of road networks.
Figure 8. A. Subtracting main image from shadow-free image, B. Opening and closing operators were performed on (A) to eliminate extra objects, C. Final road networks from Hough
transform
Next step was to reconstruct shadow components based on components with known azimuth and to eliminate other components (Figure 9A). Then, a combination of road networks and resulted image was developed. Building blocks were created by expansion of shadows till they meet a branch of the road network (Figure 9B). Therefore, precision of building extraction is directly interacted with precision of road network extraction. Shadows were eliminated from image to produce the map. Shadows which placed between two blocks of buildings change their properties to buildings and shadows which placed on one edge of buildings were removed (Figure 9C).
Figure 9. A. Reconstruct shadow components based on components with known azimuth, B. Building blocks were International Archives of the Photogrammetry, Remote Sensing and Spatial Information Sciences, Volume XL-1/W3, 2013
created by expansion of shadows till they meet a branch of the road network, C. Result with shadows eliminated
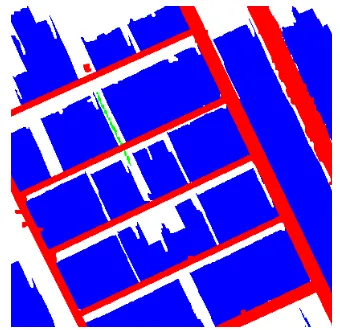
Finally, all features related to four main classes in a 1:5000 scale map (blocks of building, roads, vegetation cover and water features) were extracted in separate classes. Final map produced by integrating all four layers (Figure 10). Building blocks in this image were smoothed using a closing operation.
Figure 10. Final map produced from proposed method
3. CONCLUSION
A new ontological and morphological approach for 1:5000 and smaller scale map production was proposed in this article. First, unified specification for surveying and mapping was used to answer the question: what features are necessary to extract to make a map. Four classes including blocks of buildings, roads, vegetation covers and water features were necessary for this purpose. It was found out that water features and vegetation cover are easy to extract using a vegetation index, but blocks of buildings and road networks have an interaction and they are not easy to extract. Therefore, shadows were used to identify the azimuth of shadows and the sun. Then, direction of road networks and their branches were considered parallel or orthogonal to the azimuth of shadows. This consideration was because of adjacency of building blocks and road network and their regular geometric shape. After extraction of road networks, building blocks were extracted from combination of road networks and building shadows. In this step, building shadows were expanded till they reach to a branch of road networks. Therefore, all layers were provided to create a 1:5000 scale map from residential area. After performing the proposed method on 10 cropped images from residential areas, precision of the proposed method calculated about 85% and its accuracy was calculated about 91%.
REFERENCES
Aplin, P., Atkinson, P. and Curran, P.J., 1999. Fine spatial resolution simulated satellite sensor imagery for land cover mapping in the United Kingdom, Remote Sensing of Environment, Vol. 68, No. 1, pp. 206-216.
Ariputhiran, G. and Gandhimathi, a., 2013. Feature extraction and classification of high resolution satellite images using GLCM and Back Propagation technique, International Journal
of Engineering and Computer Science, Vol. 2, No. 2, pp. 525-528.
Benediktsson, J.A., Pesaresi, M. and Arnason, K., 2003. Classification and feature extraction for remote sensing images from urban areas based on morphological transformations,
IEEE Transactions on Geoscience and Remote Sensing, Vol. 41, No. 9, pp. 1940-1949.
Bian, L., 2003. Retrieving urban objects using a wavelet transform approach, Photogrammetric Engineering & Remote Sensing, Vol. 69, No. 2, pp. 133–141.
Bouziani, M., Goita, K. and He, D.C., 2010. Rule-based classification of a very high resolution image in an urban environment using multi-spectral segmentation guided by cartographic data, IEEE Transactions on Geoscience and Remote Sensing, Vol. 48, No. 8, pp. 3198-3211.
Chen, K. and Blong, R., 2002. Extracting building features from high resolution aerial imagery for natural hazards risk assessment, Geoscience and Remote Sensing Symposium
(IGARSS ‘02),Vol. 4, No. 1, pp. 2039-2041.
Flanders, D., Mryka H. and Joan P., 2003. Preliminary evaluation of e-Cognition object-based software for cut block delineation and feature extraction, Canadian Journal of Remote Sensing, Vol. 1, No. 20, pp. 441-452.
Gamba, P., Dell’Acqua, F., Lisini, G. and Trianni, G., 2007. Improved VHR urban mapping exploiting object boundaries,
IEEE Transactions on Geoscience and Remote Sensing, Vol. 45, No. 8, pp. 2676–2682.
Gonzalez, R.C. and Woods, R.E., 2002. Digital Image Processing, Second edition, Prentice Hall, Upper Saddle River, New Jersey, 793 p.
Hsieh, P.F., Lee, L.C. and Chen, N.Y., 2001. Effect of spatial resolution on classification errors of pure and mixed pixels in remote sensing, IEEE Transactions on Geoscience and Remote Sensing, Vol. 39, No.1, pp. 2657-2663.
Huang, X. and Zhang, L., 2011. A directional and multi-scale morphological index for automatic building extraction from multi-spectral GeoEye-1 Imagery, Photogrammetric Engineering and Remote Sensing, Vol. 77, No. 7, pp. 721-732.
Huang, X., Zhang, L. and Li, P., 2007. Classification and extraction of spatial features in urban areas using high-resolution multi-spectral imagery, IEEE Geoscience and Remote Sensing Letters, Vol. 4, No. 2, pp. 260-264.
Jin, X., and Davis, C.H., 2005. Automated building extraction from high-resolution satellite imagery in urban areas using structural, contextual, and spectral information, EURASIP Journal on Applied Signal Processing, Vol. 14, pp. 2196–2206.
Lee, D.S., Shan J. and Bethel, J.S., 2003. Class-guided building extraction from Ikonos imagery, Photogrammetric Engineering & Remote Sensing, Vol. 69, No. 2, pp. 143–150.
Lhomme, S., He, D.C., Weber, C. and Morin, D., 2009. A new approach to building identification from very-high spatial International Archives of the Photogrammetry, Remote Sensing and Spatial Information Sciences, Volume XL-1/W3, 2013
resolution images, International Journal of Remote Sensing, Vol. 30, No. 5, pp. 1341–1354.
Lu, Y.H., Trinder, J.C. and Kubik, K., 2006. Automatic building detection using the Dempster-Shafer algorithm,
Photogrammetric Engineering & Remote Sensing, Vol. 72, No. 4, pp. 395–403.
Murthy, Y.S.S.R., Murali Krishna, I.V. and Gupta, S., 2012. Object oriented image analysis for feature extraction from high resolution multi-spectral imagery, Indian Journal of Electronic and Electrical Engineering, Vol. 1, No. 2, pp. 1-9.
Ouma, Y.O., Tateishi, R. and Sri-Sumantyo, J.T., 2010. Urban features recognition and extraction from very-high resolution multi-spectral satellite imagery: a micro-macro texture determination and integration framework, The Institution of Engineering and Technology Image Processing, Vol. 4, No. 4, pp. 235-254.
Pacifici, F., Chini, M. and Emery, W.J., 2009. A neural network approach using multi scale textural metrics fromvery high resolution panchromatic imagery for urban land use classification, Remote Sensing of Environment, Vol. 113, No. 6, pp. 1276–1292.
Pesaresi, M. and Benediktsson, J.A., 2001. A new approach for the morphological segmentation of high resolution satellite imagery, IEEE Transactions on Geoscience and Remote Sensing, Vol. 39, No. 2, pp. 309–320.
Saroj, K., Meher, B., Shankar U. and Ghosh, A., 2007. Wavelet feature-based classifiers for multi-spectral remote sensing images, IEEE Transactions on Geoscience and Remote Sensing, Vol. 45, No. 6.
Tian, J. and Chen, D.M., 2007. Optimization in multi scale segmentation of high-resolution satellite images for artificial feature recognition, International Journal of Remote Sensing, Vol. 28, No. 20, pp. 4625–4644.